Wood Pellets Market Analysis, Size, and Forecast 2026-2030: Europe (UK, Germany, and France), North America (US, Canada, and Mexico), APAC (Japan, China, and South Korea), Middle East and Africa (Turkey, South Africa, and Saudi Arabia), South America (Brazil and Argentina), and Rest of World (ROW)

Wood Pellets Market Analysis, Size, and Forecast 2026-2030:
Europe (UK, Germany, and France), North America (US, Canada, and Mexico), APAC (Japan, China, and South Korea), Middle East and Africa (Turkey, South Africa, and Saudi Arabia), South America (Brazil and Argentina), and Rest of World (ROW)

Published: Mar 2026 283 Pages SKU: IRTNTR72964

Market Overview at a Glance

$7.65 B
Market Opportunity
8.9%
CAGR 2025 - 2030
58.3%
Europe Growth
$7.63 B
Residential segment 2024

Wood Pellets Market Size 2026-2030

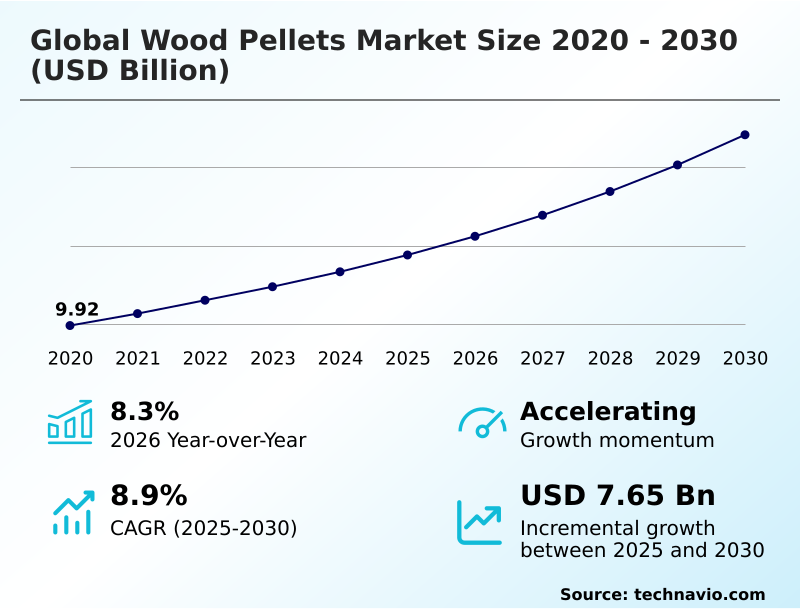
The wood pellets market size is valued to increase by USD 7.65 billion, at a CAGR of 8.9% from 2025 to 2030. Decarbonization mandates and industrialization of utility-scale biomass conversion will drive the wood pellets market.

Major Market Trends & Insights

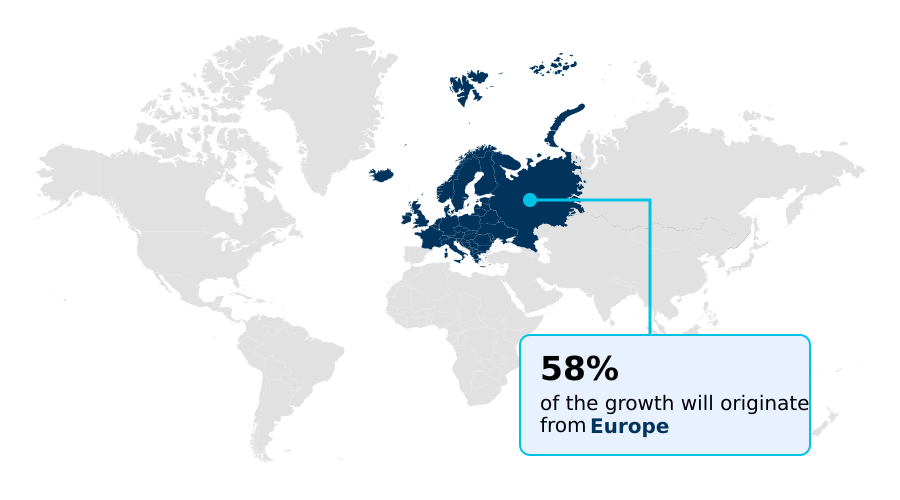
  • Europe dominated the market and accounted for a 58.3% growth during the forecast period.
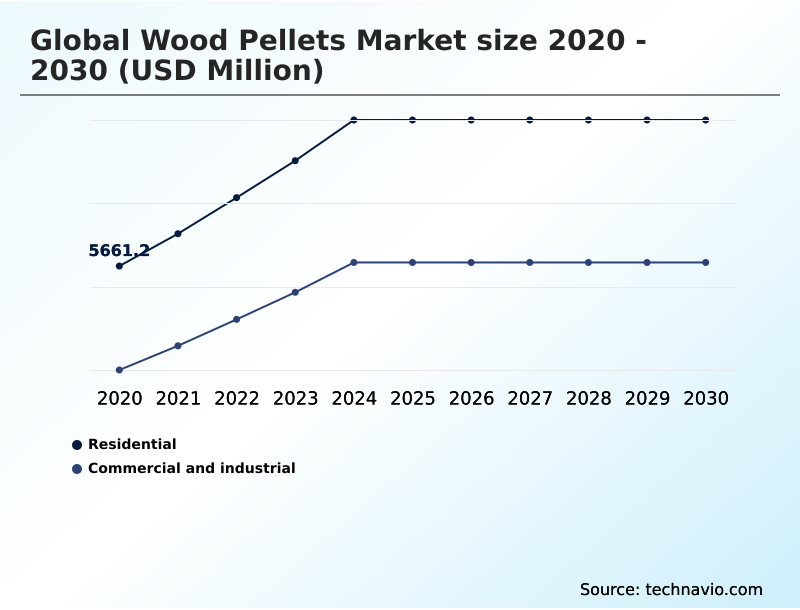
  • By End-user - Residential segment was valued at USD 7.63 billion in 2024
  • By Application - Power generation segment accounted for the largest market revenue share in 2024

Market Size & Forecast

  • Market Opportunities: USD 12.13 billion
  • Market Future Opportunities: USD 7.65 billion
  • CAGR from 2025 to 2030 : 8.9%

Market Summary

  • The wood pellets market is undergoing a structural expansion, becoming a critical component of the international renewable energy matrix. This growth is driven by a global mandate for carbon neutrality, which has positioned densified biomass as a versatile, low-carbon alternative for utility-scale power generation and industrial combined heat and power sectors.
  • A key business scenario involves utilities retrofitting legacy coal assets to use industrial wood pellets, a strategy that leverages existing infrastructure to reduce capital expenditure while meeting stringent emissions targets. This transition necessitates a resilient supply chain focused on sustainable sourcing and feedstock diversification, incorporating agricultural residues and purpose-grown energy crops.
  • The industry is also seeing a move toward transparency and sustainability certification, with advanced tracking technologies ensuring provenance and addressing environmental concerns. In emerging economies, government incentives are accelerating the development of domestic manufacturing, reducing reliance on imported energy and establishing biomass as a foundational element for future decarbonization efforts in sectors like aviation and maritime transport.

What will be the Size of the Wood Pellets Market during the forecast period?

Get Key Insights on Market Forecast (PDF) Request Free Sample

How is the Wood Pellets Market Segmented?

The wood pellets industry research report provides comprehensive data (region-wise segment analysis), with forecasts and estimates in "USD million" for the period 2026-2030, as well as historical data from 2020-2024 for the following segments.

  • End-user
    • Residential
    • Commercial and industrial
  • Application
    • Power generation
    • Combined heat and power
    • Heating
  • Grade type
    • Utility grade
    • Standard grade
    • Premium grade
  • Geography
    • Europe
      • UK
      • Germany
      • France
    • North America
      • US
      • Canada
      • Mexico
    • APAC
      • Japan
      • China
      • South Korea
    • Middle East and Africa
      • Turkey
      • South Africa
      • Saudi Arabia
    • South America
      • Brazil
      • Argentina
    • Rest of World (ROW)

By End-user Insights

The residential segment is estimated to witness significant growth during the forecast period.

The residential segment is a critical pillar for the market, driven by demand for sustainable residential heating solutions that offer energy security and autonomy.

Homeowners are incentivized by renewable heating incentives to adopt modern biomass boiler systems, leading to the displacement of fossil fuels.

This trend is supported by a preference for premium grade pellets meeting ENplus A1 certification standards, which guarantee a low ash content fuel and high calorific value biomass.

The convenience of these systems is enhanced by features like automated ash removal, which, combined with the use of low moisture biofuel, ensures efficient operation and contributes to air quality improvement by reducing particulate emissions.

In some key European markets, this segment now accounts for over 50% of total volume consumption, highlighting its role in the clean energy transition.

Request Free Sample

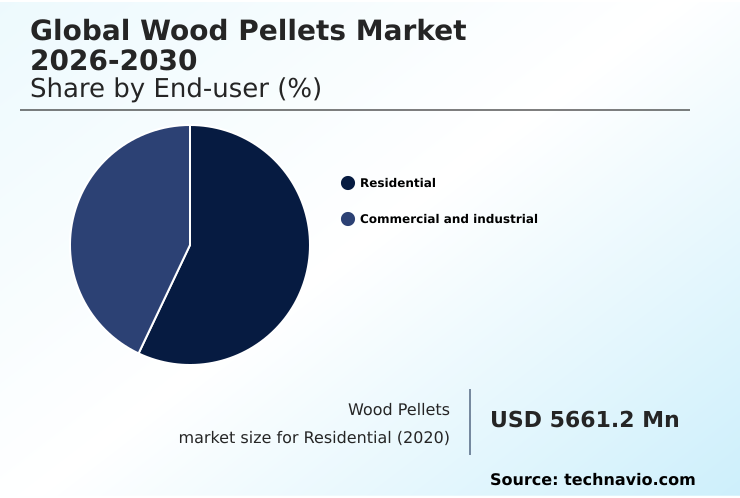
The Residential segment was valued at USD 7.63 billion in 2024 and showed a gradual increase during the forecast period.

Request Free Sample

Regional Analysis

Europe is estimated to contribute 58.3% to the growth of the global market during the forecast period.Technavio’s analysts have elaborately explained the regional trends and drivers that shape the market during the forecast period.

See How Wood Pellets Market Demand is Rising in Europe Request Free Sample

The global geographic landscape is dominated by Europe, which accounts for over 58% of total consumption, driven by mandates like the renewable energy directive III that promote renewable thermal energy.

In contrast, APAC is the fastest-expanding region, with growth outpacing North America by nearly 0.4 percentage points, fueled by demand for carbon-neutral industrial fuel in Japan and South Korea.

South America is emerging as a critical supplier, leveraging its expertise in biomass densification process to produce high-density biomass fuel for export.

Across regions, there is a growing use of biomass gasification technology to produce syngas from wood pellets for combined heat and power (CHP) applications and to support district heating networks.

The natural binding properties of lignin are essential for producing durable standard grade pellets, facilitating rural electrification support and the growth of a global bio-based economy.

Market Dynamics

Our researchers analyzed the data with 2025 as the base year, along with the key drivers, trends, and challenges. A holistic analysis of drivers will help companies refine their marketing strategies to gain a competitive advantage.

  • Strategic decision-making in the global wood pellets market is increasingly complex, shaped by a confluence of economic, regulatory, and technological factors. Businesses must evaluate the cost of coal-to-biomass conversion against the long-term benefits of using a carbon-neutral fuel source.
  • A key consideration is the efficiency of torrefied wood pellets, as the difference between black pellets vs white pellets can significantly alter operational outcomes. The challenges of EUDR compliance are forcing a re-evaluation of supply chains, with a new focus on geospatial tracking for feedstock to ensure transparency.
  • Simultaneously, the potential for BECCS for negative carbon emissions is creating new value streams, as adopting these frameworks can improve carbon credit monetization by over 20% compared to standard biomass combustion. Residential pellet stove efficiency and the availability of ENplus certification for residential use remain critical for the consumer segment, which requires automating residential biomass heating systems.
  • On the supply side, feedstock competition with the pulp industry and the logistics of transoceanic pellet shipping influence pricing. As the market diversifies, the viability of using agricultural residue for pellets and designing multi-feedstock pellet plant designs becomes paramount.
  • Understanding the impact of subsidy removal on biomass and the overall carbon footprint of wood pellets is essential for assessing the utility-scale biomass plant economics. Furthermore, the role of biomass for sustainable aviation fuel is an emerging frontier, dependent on the fuel requirements of CHP plants and the use of advanced drying for low moisture content.

What are the key market drivers leading to the rise in the adoption of Wood Pellets Industry?

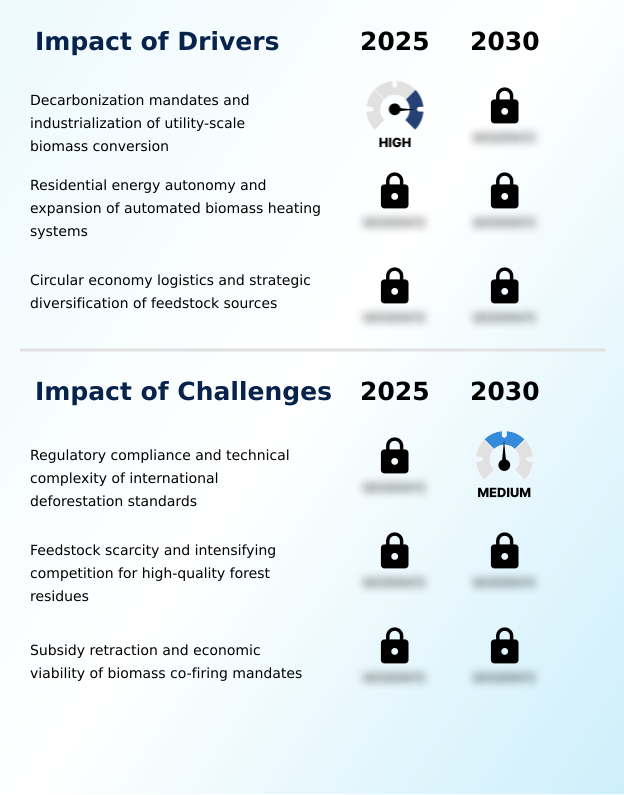
  • Decarbonization mandates, coupled with the industrialization of utility-scale biomass conversion, are key drivers of market growth.

  • Market growth is fundamentally driven by the global decarbonization of power generation and the push for industrial boiler retrofitting.
  • The industrialization of coal-to-biomass conversion is accelerating, with utilities utilizing industrial wood pellets and utility-grade biomass fuel for co-firing in power plants.
  • These initiatives are supported by biomass co-firing mandates and the need to comply with frameworks like the EU green deal.
  • This transition to base-load renewable power is made possible by a robust sustainable sourcing infrastructure and advanced drying technologies that ensure pulverized fuel compatibility.
  • New densification lines for industrial process heat are projected to add over twelve million metric tons of incremental capacity, expanding feedstock sources by more than 10% in key production zones.
  • In the residential sector, government subsidies are accelerating adoption, leading to a 30% reduction in payback periods for household energy upgrades in some areas.

What are the market trends shaping the Wood Pellets Industry?

  • The institutionalization of torrefaction technology is a key market trend. This is leading to the increased adoption of high-density black pellets with superior energy properties.

  • Key market trends are redefining the bioenergy value chain through advanced biofuel development and a focus on a circular bio-based economy. The institutionalization of torrefaction technology is central to this shift, with black pellets production using thermal-chemical conversion to create hydrophobic biomass fuel. This is driving a 9% higher adoption rate in industrial applications seeking high-performance alternatives to coal.
  • Concurrently, the expansion of bioenergy carbon capture storage (BECCS) frameworks is positioning biomass as a negative emissions technology, enabling carbon credit monetization. Furthermore, the diversification into multi-feedstock processing, including agricultural residue pelletization, is expanding the feedstock base significantly.
  • This integration of sustainable agriculture could account for up to 14% of the total bioenergy supply, creating new waste-to-energy solutions and enhancing supply chain resilience.

What challenges does the Wood Pellets Industry face during its growth?

  • A key challenge affecting industry growth is the regulatory compliance and technical complexity associated with international deforestation standards.

  • Navigating market challenges requires managing regulatory complexities and supply chain pressures to build a resilient energy infrastructure. The implementation of EU deforestation regulation compliance demands rigorous geospatial feedstock tracking and carbon intensity verification, increasing operational expenditures by up to 15% for some exporters and disrupting the biomass supply chain logistics.
  • Concurrently, feedstock scarcity is intensified by competition for sawdust and wood chips from other industries, impacting pellet mill extrusion operations and highlighting the importance of sustainable forest management and forest residue utilization.
  • The potential retraction of subsidies, such as the review of renewable energy certificate weighting, threatens the economic viability of new projects, potentially impacting over 40% of planned capacity expansions in certain APAC markets. This uncertainty affects commercial biomass heating and efforts to ensure grid stability with biomass.

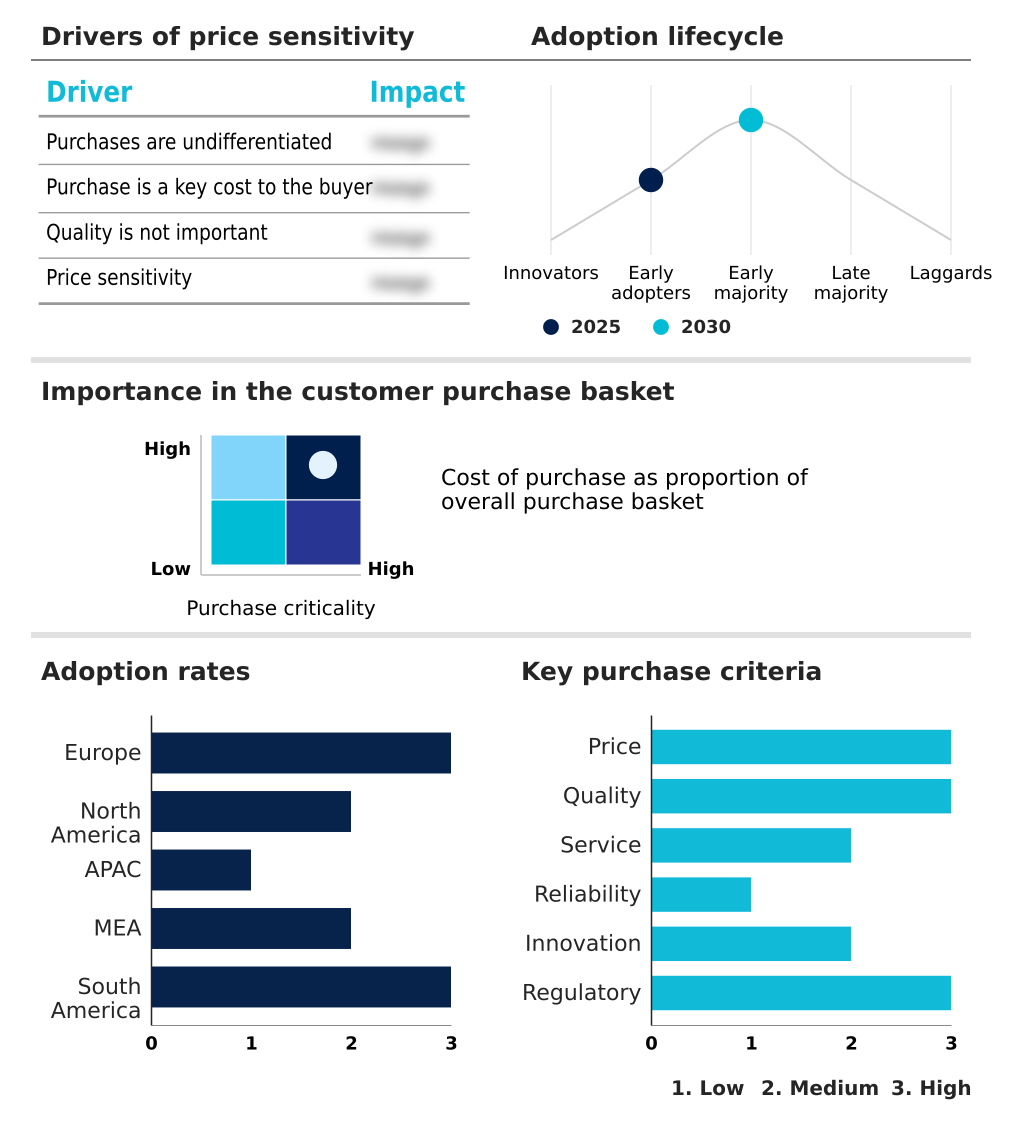
Exclusive Technavio Analysis on Customer Landscape

The wood pellets market forecasting report includes the adoption lifecycle of the market, covering from the innovator’s stage to the laggard’s stage. It focuses on adoption rates in different regions based on penetration. Furthermore, the wood pellets market report also includes key purchase criteria and drivers of price sensitivity to help companies evaluate and develop their market growth analysis strategies.

Customer Landscape of Wood Pellets Industry

Competitive Landscape

Companies are implementing various strategies, such as strategic alliances, wood pellets market forecast, partnerships, mergers and acquisitions, geographical expansion, and product/service launches, to enhance their presence in the industry.

AS Graanul Invest - Focuses on sustainably sourced biomass fuels, enabling large-scale production of industrial and premium pellets for the global sustainable energy transition.

The industry research and growth report includes detailed analyses of the competitive landscape of the market and information about key companies, including:

  • AS Graanul Invest
  • Binderholz GmbH
  • Bio Eneco
  • BioPower Sustainable Energy
  • BrasPine Madeiras Ltda
  • CT Pellet
  • ECARE
  • Energy Pellets of America
  • Enviva Inc.
  • Highland Pellets LLC
  • JP Green Fuels
  • Land Energy Girvan Ltd.
  • Lignetics Inc.
  • Pfeifer Holding GmbH
  • PREMIUM PELLETS sro
  • PRODESA
  • SNOW ENTITIES
  • VIRIDIS ENERGY INC.

Qualitative and quantitative analysis of companies has been conducted to help clients understand the wider business environment as well as the strengths and weaknesses of key industry players. Data is qualitatively analyzed to categorize companies as pure play, category-focused, industry-focused, and diversified; it is quantitatively analyzed to categorize companies as dominant, leading, strong, tentative, and weak.

Recent Development and News in Wood pellets market

  • In December 2024, Enviva Inc. confirmed its strategic focus on completing new production facilities after emerging from financial restructuring, aiming to enhance the supply of industrial and residential pellets.
  • In February 2025, the government of South Korea initiated a formal review of Renewable Energy Certificate (REC) weightings for biomass co-firing, creating significant uncertainty for exporters targeting this key APAC market.
  • In October 2024, PowerWood Canada Corp. finalized a multi-million-dollar agreement to construct two specialized black pellet facilities in Alberta, designed to convert wildfire-damaged timber into high-density torrefied pellets for export.
  • In September 2024, several North American exporters suspended certain industrial-grade pellet shipments to European utilities due to persistent ambiguities in the new EU Deforestation Regulation (EUDR) geolocation requirements.

Dive into Technavio’s robust research methodology, blending expert interviews, extensive data synthesis, and validated models for unparalleled Wood Pellets Market insights. See full methodology.

Market Scope
Page number 283
Base year 2025
Historic period 2020-2024
Forecast period 2026-2030
Growth momentum & CAGR Accelerate at a CAGR of 8.9%
Market growth 2026-2030 USD 7648.6 million
Market structure Fragmented
YoY growth 2025-2026(%) 8.3%
Key countries UK, Germany, France, Italy, The Netherlands, Spain, US, Canada, Mexico, Japan, China, South Korea, India, Indonesia, Australia, Turkey, South Africa, Saudi Arabia, UAE, Israel, Brazil, Argentina and Chile
Competitive landscape Leading Companies, Market Positioning of Companies, Competitive Strategies, and Industry Risks

Request Free Sample

Research Analyst Overview

  • The market's evolution is defined by a sophisticated interplay of technology and regulation. The core biomass densification process relies on pellet mill extrusion and advanced drying technologies to produce a low moisture biofuel.
  • Products range from industrial wood pellets for co-firing in power plants, requiring pulverized fuel compatibility, to premium grade pellets with low ash content fuel for residential biomass boiler systems featuring automated ash removal. Key standards include ENplus A1 certification and compliance with the renewable energy directive III.
  • The rise of torrefied wood pellets, also known as black pellets production, involves a thermal-chemical conversion to create a hydrophobic biomass fuel with high calorific value biomass and high-density biomass fuel characteristics. Advanced applications include biomass gasification technology to create syngas from wood pellets and bioenergy carbon capture storage, a negative emissions technology.
  • Sustainable sourcing infrastructure is critical, with an emphasis on sustainable forest management, geospatial feedstock tracking, and carbon intensity verification to meet EU deforestation regulation compliance. Diversification is occurring through agricultural residue pelletization, multi-feedstock processing, and energy crop cultivation to meet biomass co-firing mandates and evolving renewable energy certificate weighting.

What are the Key Data Covered in this Wood Pellets Market Research and Growth Report?

  • What is the expected growth of the Wood Pellets Market between 2026 and 2030?

    • USD 7.65 billion, at a CAGR of 8.9%

  • What segmentation does the market report cover?

    • The report is segmented by End-user (Residential, and Commercial and industrial), Application (Power generation, Combined heat and power, and Heating), Grade Type (Utility grade, Standard grade, and Premium grade) and Geography (Europe, North America, APAC, Middle East and Africa, South America)

  • Which regions are analyzed in the report?

    • Europe, North America, APAC, Middle East and Africa and South America

  • What are the key growth drivers and market challenges?

    • Decarbonization mandates and industrialization of utility-scale biomass conversion, Regulatory compliance and technical complexity of international deforestation standards

  • Who are the major players in the Wood Pellets Market?

    • AS Graanul Invest, Binderholz GmbH, Bio Eneco, BioPower Sustainable Energy, BrasPine Madeiras Ltda, CT Pellet, ECARE, Energy Pellets of America, Enviva Inc., Highland Pellets LLC, JP Green Fuels, Land Energy Girvan Ltd., Lignetics Inc., Pfeifer Holding GmbH, PREMIUM PELLETS sro, PRODESA, SNOW ENTITIES and VIRIDIS ENERGY INC.

Market Research Insights

  • Market dynamics are shaped by the strategic pursuit of decarbonization of power generation and the need for resilient energy infrastructure. The adoption of advanced biofuel development is accelerating, with combined heat and power (CHP) systems achieving operational efficiencies exceeding 80%, providing a significant incentive for industrial boiler retrofitting.
  • In the power sector, the shift toward a bio-based economy is evident as the demand for torrefied pellets for coal-to-biomass conversion grows, with adoption rates for these specialized fuels increasing by 9% in key industrial applications. This transition not only supports net-zero emissions targets but also enhances grid stability with biomass as a source of base-load renewable power.
  • These shifts reflect a broader sustainable energy transition, where biomass plays an integral role in achieving both environmental compliance and energy security.

We can help! Our analysts can customize this wood pellets market research report to meet your requirements.

Get in touch

1. Executive Summary

1.1 Market overview

Executive Summary - Chart on Market Overview
Executive Summary - Data Table on Market Overview
Executive Summary - Chart on Global Market Characteristics
Executive Summary - Chart on Market by Geography
Executive Summary - Chart on Market Segmentation by End-user
Executive Summary - Chart on Market Segmentation by Application
Executive Summary - Chart on Market Segmentation by Grade Type
Executive Summary - Chart on Incremental Growth
Executive Summary - Data Table on Incremental Growth
Executive Summary - Chart on Company Market Positioning

2. Technavio Analysis

2.1 Analysis of price sensitivity, lifecycle, customer purchase basket, adoption rates, and purchase criteria

2.2 Criticality of inputs and Factors of differentiation

Chart on Overview on criticality of inputs and factors of differentiation

2.3 Factors of disruption

Chart on Overview on factors of disruption

2.4 Impact of drivers and challenges

Chart on Impact of drivers and challenges in 2025 and 2030

3. Market Landscape

3.1 Market ecosystem

Chart on Parent Market
Data Table on - Parent Market

3.2 Market characteristics

Chart on Market characteristics analysis

3.3 Value chain analysis

Chart on Value chain analysis

4. Market Sizing

4.1 Market definition

Data Table on Offerings of companies included in the market definition

4.2 Market segment analysis

Market segments

4.3 Market size 2025

4.4 Market outlook: Forecast for 2025-2030

Chart on Global - Market size and forecast 2025-2030 ($ million)
Data Table on Global - Market size and forecast 2025-2030 ($ million)
Chart on Global Market: Year-over-year growth 2025-2030 (%)
Data Table on Global Market: Year-over-year growth 2025-2030 (%)

5. Historic Market Size

5.1 Global Wood Pellets Market 2020 - 2024

Historic Market Size - Data Table on Global Wood Pellets Market 2020 - 2024 ($ million)

5.2 End-user segment analysis 2020 - 2024

Historic Market Size - End-user Segment 2020 - 2024 ($ million)

5.3 Application segment analysis 2020 - 2024

Historic Market Size - Application Segment 2020 - 2024 ($ million)

5.4 Grade Type segment analysis 2020 - 2024

Historic Market Size - Grade Type Segment 2020 - 2024 ($ million)

5.5 Geography segment analysis 2020 - 2024

Historic Market Size - Geography Segment 2020 - 2024 ($ million)

5.6 Country segment analysis 2020 - 2024

Historic Market Size - Country Segment 2020 - 2024 ($ million)

6. Qualitative Analysis

6.1 Impact of AI in global wood pellets market

7. Five Forces Analysis

7.1 Five forces summary

Five forces analysis - Comparison between 2025 and 2030

7.2 Bargaining power of buyers

Bargaining power of buyers - Impact of key factors 2025 and 2030

7.3 Bargaining power of suppliers

Bargaining power of suppliers - Impact of key factors in 2025 and 2030

7.4 Threat of new entrants

Threat of new entrants - Impact of key factors in 2025 and 2030

7.5 Threat of substitutes

Threat of substitutes - Impact of key factors in 2025 and 2030

7.6 Threat of rivalry

Threat of rivalry - Impact of key factors in 2025 and 2030

7.7 Market condition

Chart on Market condition - Five forces 2025 and 2030

8. Market Segmentation by End-user

8.1 Market segments

Chart on End-user - Market share 2025-2030 (%)
Data Table on End-user - Market share 2025-2030 (%)

8.2 Comparison by End-user

Chart on Comparison by End-user
Data Table on Comparison by End-user

8.3 Residential - Market size and forecast 2025-2030

Chart on Residential - Market size and forecast 2025-2030 ($ million)
Data Table on Residential - Market size and forecast 2025-2030 ($ million)
Chart on Residential - Year-over-year growth 2025-2030 (%)
Data Table on Residential - Year-over-year growth 2025-2030 (%)

8.4 Commercial and industrial - Market size and forecast 2025-2030

Chart on Commercial and industrial - Market size and forecast 2025-2030 ($ million)
Data Table on Commercial and industrial - Market size and forecast 2025-2030 ($ million)
Chart on Commercial and industrial - Year-over-year growth 2025-2030 (%)
Data Table on Commercial and industrial - Year-over-year growth 2025-2030 (%)

8.5 Market opportunity by End-user

Market opportunity by End-user ($ million)
Data Table on Market opportunity by End-user ($ million)

9. Market Segmentation by Application

9.1 Market segments

Chart on Application - Market share 2025-2030 (%)
Data Table on Application - Market share 2025-2030 (%)

9.2 Comparison by Application

Chart on Comparison by Application
Data Table on Comparison by Application

9.3 Power generation - Market size and forecast 2025-2030

Chart on Power generation - Market size and forecast 2025-2030 ($ million)
Data Table on Power generation - Market size and forecast 2025-2030 ($ million)
Chart on Power generation - Year-over-year growth 2025-2030 (%)
Data Table on Power generation - Year-over-year growth 2025-2030 (%)

9.4 Combined heat and power - Market size and forecast 2025-2030

Chart on Combined heat and power - Market size and forecast 2025-2030 ($ million)
Data Table on Combined heat and power - Market size and forecast 2025-2030 ($ million)
Chart on Combined heat and power - Year-over-year growth 2025-2030 (%)
Data Table on Combined heat and power - Year-over-year growth 2025-2030 (%)

9.5 Heating - Market size and forecast 2025-2030

Chart on Heating - Market size and forecast 2025-2030 ($ million)
Data Table on Heating - Market size and forecast 2025-2030 ($ million)
Chart on Heating - Year-over-year growth 2025-2030 (%)
Data Table on Heating - Year-over-year growth 2025-2030 (%)

9.6 Market opportunity by Application

Market opportunity by Application ($ million)
Data Table on Market opportunity by Application ($ million)

10. Market Segmentation by Grade Type

10.1 Market segments

Chart on Grade Type - Market share 2025-2030 (%)
Data Table on Grade Type - Market share 2025-2030 (%)

10.2 Comparison by Grade Type

Chart on Comparison by Grade Type
Data Table on Comparison by Grade Type

10.3 Utility grade - Market size and forecast 2025-2030

Chart on Utility grade - Market size and forecast 2025-2030 ($ million)
Data Table on Utility grade - Market size and forecast 2025-2030 ($ million)
Chart on Utility grade - Year-over-year growth 2025-2030 (%)
Data Table on Utility grade - Year-over-year growth 2025-2030 (%)

10.4 Standard grade - Market size and forecast 2025-2030

Chart on Standard grade - Market size and forecast 2025-2030 ($ million)
Data Table on Standard grade - Market size and forecast 2025-2030 ($ million)
Chart on Standard grade - Year-over-year growth 2025-2030 (%)
Data Table on Standard grade - Year-over-year growth 2025-2030 (%)

10.5 Premium grade - Market size and forecast 2025-2030

Chart on Premium grade - Market size and forecast 2025-2030 ($ million)
Data Table on Premium grade - Market size and forecast 2025-2030 ($ million)
Chart on Premium grade - Year-over-year growth 2025-2030 (%)
Data Table on Premium grade - Year-over-year growth 2025-2030 (%)

10.6 Market opportunity by Grade Type

Market opportunity by Grade Type ($ million)
Data Table on Market opportunity by Grade Type ($ million)

11. Customer Landscape

11.1 Customer landscape overview

Analysis of price sensitivity, lifecycle, customer purchase basket, adoption rates, and purchase criteria

12. Geographic Landscape

12.1 Geographic segmentation

Chart on Market share by geography 2025-2030 (%)
Data Table on Market share by geography 2025-2030 (%)

12.2 Geographic comparison

Chart on Geographic comparison
Data Table on Geographic comparison

12.3 Europe - Market size and forecast 2025-2030

Chart on Europe - Market size and forecast 2025-2030 ($ million)
Data Table on Europe - Market size and forecast 2025-2030 ($ million)
Chart on Europe - Year-over-year growth 2025-2030 (%)
Data Table on Europe - Year-over-year growth 2025-2030 (%)
Chart on Regional Comparison - Europe
Data Table on Regional Comparison - Europe

12.3.1 UK - Market size and forecast 2025-2030

Chart on UK - Market size and forecast 2025-2030 ($ million)
Data Table on UK - Market size and forecast 2025-2030 ($ million)
Chart on UK - Year-over-year growth 2025-2030 (%)
Data Table on UK - Year-over-year growth 2025-2030 (%)

12.3.2 Germany - Market size and forecast 2025-2030

Chart on Germany - Market size and forecast 2025-2030 ($ million)
Data Table on Germany - Market size and forecast 2025-2030 ($ million)
Chart on Germany - Year-over-year growth 2025-2030 (%)
Data Table on Germany - Year-over-year growth 2025-2030 (%)

12.3.3 France - Market size and forecast 2025-2030

Chart on France - Market size and forecast 2025-2030 ($ million)
Data Table on France - Market size and forecast 2025-2030 ($ million)
Chart on France - Year-over-year growth 2025-2030 (%)
Data Table on France - Year-over-year growth 2025-2030 (%)

12.3.4 Italy - Market size and forecast 2025-2030

Chart on Italy - Market size and forecast 2025-2030 ($ million)
Data Table on Italy - Market size and forecast 2025-2030 ($ million)
Chart on Italy - Year-over-year growth 2025-2030 (%)
Data Table on Italy - Year-over-year growth 2025-2030 (%)

12.3.5 The Netherlands - Market size and forecast 2025-2030

Chart on The Netherlands - Market size and forecast 2025-2030 ($ million)
Data Table on The Netherlands - Market size and forecast 2025-2030 ($ million)
Chart on The Netherlands - Year-over-year growth 2025-2030 (%)
Data Table on The Netherlands - Year-over-year growth 2025-2030 (%)

12.3.6 Spain - Market size and forecast 2025-2030

Chart on Spain - Market size and forecast 2025-2030 ($ million)
Data Table on Spain - Market size and forecast 2025-2030 ($ million)
Chart on Spain - Year-over-year growth 2025-2030 (%)
Data Table on Spain - Year-over-year growth 2025-2030 (%)

12.4 North America - Market size and forecast 2025-2030

Chart on North America - Market size and forecast 2025-2030 ($ million)
Data Table on North America - Market size and forecast 2025-2030 ($ million)
Chart on North America - Year-over-year growth 2025-2030 (%)
Data Table on North America - Year-over-year growth 2025-2030 (%)
Chart on Regional Comparison - North America
Data Table on Regional Comparison - North America

12.4.1 US - Market size and forecast 2025-2030

Chart on US - Market size and forecast 2025-2030 ($ million)
Data Table on US - Market size and forecast 2025-2030 ($ million)
Chart on US - Year-over-year growth 2025-2030 (%)
Data Table on US - Year-over-year growth 2025-2030 (%)

12.4.2 Canada - Market size and forecast 2025-2030

Chart on Canada - Market size and forecast 2025-2030 ($ million)
Data Table on Canada - Market size and forecast 2025-2030 ($ million)
Chart on Canada - Year-over-year growth 2025-2030 (%)
Data Table on Canada - Year-over-year growth 2025-2030 (%)

12.4.3 Mexico - Market size and forecast 2025-2030

Chart on Mexico - Market size and forecast 2025-2030 ($ million)
Data Table on Mexico - Market size and forecast 2025-2030 ($ million)
Chart on Mexico - Year-over-year growth 2025-2030 (%)
Data Table on Mexico - Year-over-year growth 2025-2030 (%)

12.5 APAC - Market size and forecast 2025-2030

Chart on APAC - Market size and forecast 2025-2030 ($ million)
Data Table on APAC - Market size and forecast 2025-2030 ($ million)
Chart on APAC - Year-over-year growth 2025-2030 (%)
Data Table on APAC - Year-over-year growth 2025-2030 (%)
Chart on Regional Comparison - APAC
Data Table on Regional Comparison - APAC

12.5.1 Japan - Market size and forecast 2025-2030

Chart on Japan - Market size and forecast 2025-2030 ($ million)
Data Table on Japan - Market size and forecast 2025-2030 ($ million)
Chart on Japan - Year-over-year growth 2025-2030 (%)
Data Table on Japan - Year-over-year growth 2025-2030 (%)

12.5.2 China - Market size and forecast 2025-2030

Chart on China - Market size and forecast 2025-2030 ($ million)
Data Table on China - Market size and forecast 2025-2030 ($ million)
Chart on China - Year-over-year growth 2025-2030 (%)
Data Table on China - Year-over-year growth 2025-2030 (%)

12.5.3 South Korea - Market size and forecast 2025-2030

Chart on South Korea - Market size and forecast 2025-2030 ($ million)
Data Table on South Korea - Market size and forecast 2025-2030 ($ million)
Chart on South Korea - Year-over-year growth 2025-2030 (%)
Data Table on South Korea - Year-over-year growth 2025-2030 (%)

12.5.4 India - Market size and forecast 2025-2030

Chart on India - Market size and forecast 2025-2030 ($ million)
Data Table on India - Market size and forecast 2025-2030 ($ million)
Chart on India - Year-over-year growth 2025-2030 (%)
Data Table on India - Year-over-year growth 2025-2030 (%)

12.5.5 Indonesia - Market size and forecast 2025-2030

Chart on Indonesia - Market size and forecast 2025-2030 ($ million)
Data Table on Indonesia - Market size and forecast 2025-2030 ($ million)
Chart on Indonesia - Year-over-year growth 2025-2030 (%)
Data Table on Indonesia - Year-over-year growth 2025-2030 (%)

12.5.6 Australia - Market size and forecast 2025-2030

Chart on Australia - Market size and forecast 2025-2030 ($ million)
Data Table on Australia - Market size and forecast 2025-2030 ($ million)
Chart on Australia - Year-over-year growth 2025-2030 (%)
Data Table on Australia - Year-over-year growth 2025-2030 (%)

12.6 Middle East and Africa - Market size and forecast 2025-2030

Chart on Middle East and Africa - Market size and forecast 2025-2030 ($ million)
Data Table on Middle East and Africa - Market size and forecast 2025-2030 ($ million)
Chart on Middle East and Africa - Year-over-year growth 2025-2030 (%)
Data Table on Middle East and Africa - Year-over-year growth 2025-2030 (%)
Chart on Regional Comparison - Middle East and Africa
Data Table on Regional Comparison - Middle East and Africa

12.6.1 Turkey - Market size and forecast 2025-2030

Chart on Turkey - Market size and forecast 2025-2030 ($ million)
Data Table on Turkey - Market size and forecast 2025-2030 ($ million)
Chart on Turkey - Year-over-year growth 2025-2030 (%)
Data Table on Turkey - Year-over-year growth 2025-2030 (%)

12.6.2 South Africa - Market size and forecast 2025-2030

Chart on South Africa - Market size and forecast 2025-2030 ($ million)
Data Table on South Africa - Market size and forecast 2025-2030 ($ million)
Chart on South Africa - Year-over-year growth 2025-2030 (%)
Data Table on South Africa - Year-over-year growth 2025-2030 (%)

12.6.3 Saudi Arabia - Market size and forecast 2025-2030

Chart on Saudi Arabia - Market size and forecast 2025-2030 ($ million)
Data Table on Saudi Arabia - Market size and forecast 2025-2030 ($ million)
Chart on Saudi Arabia - Year-over-year growth 2025-2030 (%)
Data Table on Saudi Arabia - Year-over-year growth 2025-2030 (%)

12.6.4 UAE - Market size and forecast 2025-2030

Chart on UAE - Market size and forecast 2025-2030 ($ million)
Data Table on UAE - Market size and forecast 2025-2030 ($ million)
Chart on UAE - Year-over-year growth 2025-2030 (%)
Data Table on UAE - Year-over-year growth 2025-2030 (%)

12.6.5 Israel - Market size and forecast 2025-2030

Chart on Israel - Market size and forecast 2025-2030 ($ million)
Data Table on Israel - Market size and forecast 2025-2030 ($ million)
Chart on Israel - Year-over-year growth 2025-2030 (%)
Data Table on Israel - Year-over-year growth 2025-2030 (%)

12.7 South America - Market size and forecast 2025-2030

Chart on South America - Market size and forecast 2025-2030 ($ million)
Data Table on South America - Market size and forecast 2025-2030 ($ million)
Chart on South America - Year-over-year growth 2025-2030 (%)
Data Table on South America - Year-over-year growth 2025-2030 (%)
Chart on Regional Comparison - South America
Data Table on Regional Comparison - South America

12.7.1 Brazil - Market size and forecast 2025-2030

Chart on Brazil - Market size and forecast 2025-2030 ($ million)
Data Table on Brazil - Market size and forecast 2025-2030 ($ million)
Chart on Brazil - Year-over-year growth 2025-2030 (%)
Data Table on Brazil - Year-over-year growth 2025-2030 (%)

12.7.2 Argentina - Market size and forecast 2025-2030

Chart on Argentina - Market size and forecast 2025-2030 ($ million)
Data Table on Argentina - Market size and forecast 2025-2030 ($ million)
Chart on Argentina - Year-over-year growth 2025-2030 (%)
Data Table on Argentina - Year-over-year growth 2025-2030 (%)

12.7.3 Chile - Market size and forecast 2025-2030

Chart on Chile - Market size and forecast 2025-2030 ($ million)
Data Table on Chile - Market size and forecast 2025-2030 ($ million)
Chart on Chile - Year-over-year growth 2025-2030 (%)
Data Table on Chile - Year-over-year growth 2025-2030 (%)

12.8 Market opportunity by geography

Market opportunity by geography ($ million)
Data Tables on Market opportunity by geography ($ million)

13. Drivers, Challenges, and Opportunity

13.1 Market drivers

Decarbonization mandates and industrialization of utility-scale biomass conversion
Residential energy autonomy and expansion of automated biomass heating systems
Circular economy logistics and strategic diversification of feedstock sources

13.2 Market challenges

Regulatory compliance and technical complexity of international deforestation standards
Feedstock scarcity and intensifying competition for high-quality forest residues
Subsidy retraction and economic viability of biomass co-firing mandates

13.3 Impact of drivers and challenges

Impact of drivers and challenges in 2025 and 2030

13.4 Market opportunities

Institutionalization of torrefaction technology and rise of high-density black pellets
Multi-feedstock diversification and agricultural residue integration
Expansion of bioenergy with carbon capture and storage (BECCS) frameworks

14. Competitive Landscape

14.1 Overview

14.2

Overview on criticality of inputs and factors of differentiation

14.3 Landscape disruption

Overview on factors of disruption

14.4 Industry risks

Impact of key risks on business

15. Competitive Analysis

15.1 Companies profiled

Companies covered

15.2 Company ranking index

15.3 Market positioning of companies

Matrix on companies position and classification

15.4 AS Graanul Invest

AS Graanul Invest - Overview
AS Graanul Invest - Product / Service
AS Graanul Invest - Key offerings
SWOT

15.5 Binderholz GmbH

Binderholz GmbH - Overview
Binderholz GmbH - Product / Service
Binderholz GmbH - Key offerings
SWOT

15.6 Bio Eneco

Bio Eneco - Overview
Bio Eneco - Product / Service
Bio Eneco - Key offerings
SWOT

15.7 BioPower Sustainable Energy

BioPower Sustainable Energy - Overview
BioPower Sustainable Energy - Product / Service
BioPower Sustainable Energy - Key offerings
SWOT

15.8 BrasPine Madeiras Ltda

BrasPine Madeiras Ltda - Overview
BrasPine Madeiras Ltda - Product / Service
BrasPine Madeiras Ltda - Key offerings
SWOT

15.9 CT Pellet

CT Pellet - Overview
CT Pellet - Product / Service
CT Pellet - Key offerings
SWOT

15.10 ECARE

ECARE - Overview
ECARE - Product / Service
ECARE - Key offerings
SWOT

15.11 Energy Pellets of America

Energy Pellets of America - Overview
Energy Pellets of America - Product / Service
Energy Pellets of America - Key offerings
SWOT

15.12 Enviva Inc.

Enviva Inc. - Overview
Enviva Inc. - Product / Service
Enviva Inc. - Key offerings
SWOT

15.13 Highland Pellets LLC

Highland Pellets LLC - Overview
Highland Pellets LLC - Product / Service
Highland Pellets LLC - Key offerings
SWOT

15.14 JP Green Fuels

JP Green Fuels - Overview
JP Green Fuels - Product / Service
JP Green Fuels - Key offerings
SWOT

15.15 Land Energy Girvan Ltd.

Land Energy Girvan Ltd. - Overview
Land Energy Girvan Ltd. - Product / Service
Land Energy Girvan Ltd. - Key offerings
SWOT

15.16 Lignetics Inc.

Lignetics Inc. - Overview
Lignetics Inc. - Product / Service
Lignetics Inc. - Key offerings
SWOT

15.17 Pfeifer Holding GmbH

Pfeifer Holding GmbH - Overview
Pfeifer Holding GmbH - Product / Service
Pfeifer Holding GmbH - Key offerings
SWOT

15.18 PREMIUM PELLETS sro

PREMIUM PELLETS sro - Overview
PREMIUM PELLETS sro - Product / Service
PREMIUM PELLETS sro - Key offerings
SWOT

16. Appendix

16.1 Scope of the report

Market definition
Objectives
Notes and caveats

16.2 Inclusions and exclusions checklist

Inclusions checklist
Exclusions checklist

16.3 Currency conversion rates for US$

16.4 Research methodology

16.5 Data procurement

Information sources

16.6 Data validation

16.7 Validation techniques employed for market sizing

16.8 Data synthesis

16.9 360 degree market analysis

16.10 List of abbreviations

Research Methodology

Technavio presents a detailed picture of the market by way of study, synthesis, and summation of data from multiple sources. The analysts have presented the various facets of the market with a particular focus on identifying the key industry influencers. The data thus presented is comprehensive, reliable, and the result of extensive research, both primary and secondary.

INFORMATION SOURCES

Primary sources

  • Manufacturers and suppliers
  • Channel partners
  • Industry experts
  • Strategic decision makers

Secondary sources

  • Industry journals and periodicals
  • Government data
  • Financial reports of key industry players
  • Historical data
  • Press releases

DATA ANALYSIS

Data Synthesis

  • Collation of data
  • Estimation of key figures
  • Analysis of derived insights

Data Validation

  • Triangulation with data models
  • Reference against proprietary databases
  • Corroboration with industry experts

REPORT WRITING

Qualitative

  • Market drivers
  • Market challenges
  • Market trends
  • Five forces analysis

Quantitative

  • Market size and forecast
  • Market segmentation
  • Geographical insights
  • Competitive landscape

Interested in this report?

Get your sample now to see our research methodology and insights!

Download Now

Frequently Asked Questions

Wood Pellets market growth will increase by USD 7648.6 million during 2026-2030.

The Wood Pellets market is expected to grow at a CAGR of 8.9% during 2026-2030.

Wood Pellets market is segmented by End-user (Residential, Commercial and industrial) Application (Power generation, Combined heat and power, Heating) Grade type (Utility grade, Standard grade, Premium grade)

AS Graanul Invest, Binderholz GmbH, Bio Eneco, BioPower Sustainable Energy, BrasPine Madeiras Ltda, CT Pellet, ECARE, Energy Pellets of America, Enviva Inc., Highland Pellets LLC, JP Green Fuels, Land Energy Girvan Ltd., Lignetics Inc., Pfeifer Holding GmbH, PREMIUM PELLETS sro, PRODESA, SNOW ENTITIES, VIRIDIS ENERGY INC. are a few of the key vendors in the Wood Pellets market.

Europe will register the highest growth rate of 58.3% among the other regions. Therefore, the Wood Pellets market in Europe is expected to garner significant business opportunities for the vendors during the forecast period.

UK, Germany, France, Italy, The Netherlands, Spain, US, Canada, Mexico, Japan, China, South Korea, India, Indonesia, Australia, Turkey, South Africa, Saudi Arabia, UAE, Israel, Brazil, Argentina, Chile

  • Decarbonization mandates and industrialization of utility-scale biomass conversion is the driving factor this market.

The Wood Pellets market vendors should focus on grabbing business opportunities from the End-user segment as it accounted for the largest market share in the base year.
RIA - Research AI Assistant
Ask RIA