Ambulatory Surgical Centers Market Size and Forecast 2025-2029
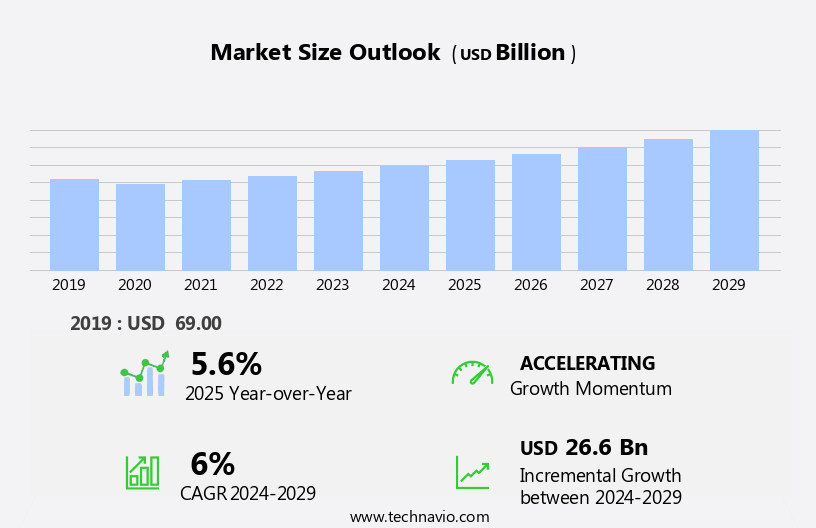
The ambulatory surgical centers market size estimates the market to reach by USD 26.6 billion, at a CAGR of 6% between 2024 and 2029.North America is expected to account for 51% of the growth contribution to the global market during this period. In 2019 the single-specialty centers segment was valued at USD 44.40 billion and has demonstrated steady growth since then.
- The Ambulatory Surgical Centers (ASC) market is experiencing significant growth, driven by the increasing number of cataract surgeries performed in these facilities. This trend is attributed to the convenience and cost-effectiveness of ASCs compared to traditional hospitals. Furthermore, the market is witnessing an uptick in partnerships and collaborations between various stakeholders, including insurers, hospitals, and ASCs, to expand their reach and offer more comprehensive healthcare services. However, financial constraints pose a considerable challenge for ASCs. Reimbursement policies and payer mix continue to evolve, putting pressure on ASCs to maintain profitability.
- Additionally, the growing complexity of surgical procedures and the need for advanced AI technology and investments can strain ASCs' resources. To navigate these challenges, ASCs must focus on operational efficiency, strategic partnerships, and innovative business models to remain competitive and capitalize on the market's growth opportunities.
What will be the Size of the Ambulatory Surgical Centers Market during the forecast period?
The ambulatory surgical centers (ASC) market continues to evolve, driven by advancements in surgical technology and a growing emphasis on patient-centered care. Patient monitoring systems play a crucial role in ambulatory surgery recovery, enabling real-time assessment of vital signs and early detection of complications. Outpatient surgery protocols are becoming more standardized, with infection control and patient satisfaction metrics being key areas of focus. Emergency response protocols and facility accreditation are essential components of ASC operations, ensuring prompt and effective response to emergencies and maintaining high-quality care. Surgical technology advancements, such as minimally invasive surgery and surgical team coordination, are transforming the landscape of ASCs.
Data analytics and performance benchmarking are increasingly important tools for ASCs, enabling facility administrators to optimize operations, improve patient flow management, and enhance overall performance. ASC billing practices are also undergoing changes, with a shift towards more transparent and patient-friendly billing. ASCs are investing in staff credentialing, risk management, quality assurance, sterilization techniques, and surgical scheduling software to ensure compliance with regulations and maintain a high level of patient safety. Anesthesia protocols and post-operative care are also critical areas of focus, with a growing emphasis on patient-centered care and minimizing surgical site infections. For instance, a leading ASC in the US reported a 20% increase in patient satisfaction scores following the implementation of a new patient flow management system.
How is this Ambulatory Surgical Centers Industry segmented?
The ambulatory surgical centers industry research report provides comprehensive data (region-wise segment analysis), with forecasts and estimates in "USD billion" for the period 2025-2029, as well as historical data from 2019-2023 for the following segments.
- Type
- Single-specialty centers
- Multi-specialty centers
- Modality
- Hospital-affiliated ASCs
- Freestanding ASCs
- Service Type
- Otolaryngology
- Endoscopy
- Obstetrics or gynecology
- Dental
- Others
- Service Mode
- Surgical
- Diagnostic
- End-User
- Adults
- Pediatrics
- Geography
- North America
- US
- Canada
- Europe
- France
- Germany
- Italy
- UK
- APAC
- China
- India
- Japan
- South America
- Brazil
- Rest of World (ROW)
- North America
By Type Insights
The single-specialty centers segment is estimated to witness significant growth during the forecast period.
The market is characterized by the integration of advanced technologies and stringent protocols to enhance patient care and safety. Patient monitoring systems facilitate real-time surveillance during ambulatory surgery recovery, ensuring optimal patient outcomes. Outpatient surgery protocols adhere to strict infection control measures, as asc, to prevent post-surgical complications. Emergency response protocols are in place to address any unforeseen situations, while facility accreditation, asc, ensures adherence to regulatory standards. Surgical technology advancements, including minimally invasive surgery and surgical team coordination, streamline procedures and improve patient satisfaction metrics. Performance benchmarking, asc, enables continuous improvement through data analytics, asc.
Asc billing practices are streamlined to ensure efficient revenue cycle management. Patient flow management optimizes resource utilization and reduces wait times. Preoperative assessment, asc, surgical supply inventory, and staff credentialing, asc, are crucial components of risk management, asc. Quality assurance, asc, is maintained through adherence to sterilization techniques, asc, surgical scheduling software, surgical procedure scheduling, aseptic techniques, asc, and staff training, asc. Compliance regulations, asc, are strictly enforced to maintain a safe and effective surgical environment. Anesthesia protocols, asc, and post-operative care, asc, are tailored to individual patient needs to ensure a smooth surgical experience.
Surgical waste disposal and surgical site preparation are essential aspects of maintaining a clean and hygienic environment. The market is expected to continue evolving, with ongoing advancements in surgical technology and a focus on enhancing patient care and safety.
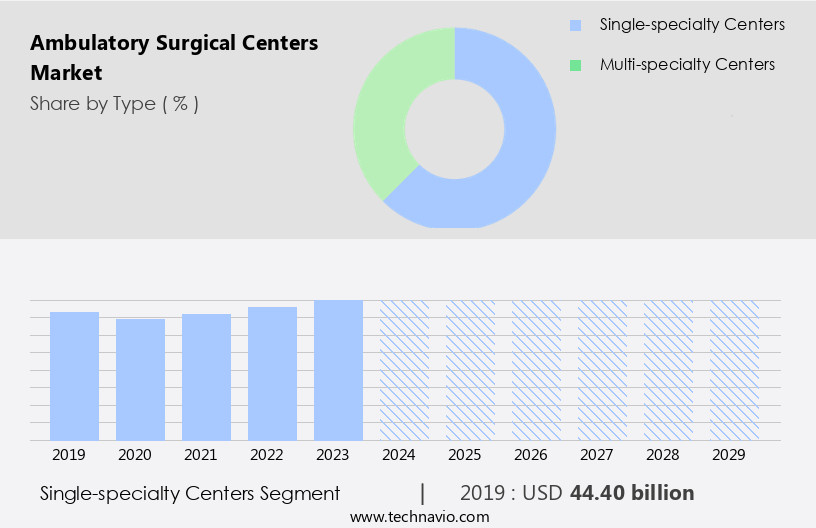
As of 2019 the Single-specialty centers segment estimated at USD 44.40 billion, and it is forecast to see a moderate upward trend through the forecast period.
Regional Analysis
During the forecast period, North America is projected to contribute 51% to the overall growth of the global market. Technavio's analysts have elaborately explained the regional trends and drivers that shape the market during the forecast period.

The Ambulatory Surgical Centers (ASC) market in North America is experiencing significant growth due to several factors. The region's dominance in 2024 is attributed to the increasing number of ASCs, the presence of key industry players, and stringent regulations enforced by government organizations. The geriatric population and the rising prevalence of chronic diseases, such as diabetes, are major contributors to this growth. For instance, the Centers for Disease Control and Prevention (CDC) estimates that the number of people with diabetic retinopathy in the US will reach 14.6 million by 2050. With the risk of diabetic retinopathy increasing with age, the expanding geriatric population is expected to fuel the demand for ophthalmology diagnoses, leading to the growth of ophthalmic ASCs.
Infection control and patient safety remain top priorities in ASCs. Patient monitoring systems are crucial for continuous patient care during and after surgery. Minimally invasive surgical procedures and advanced surgical technology enable faster recovery times. Staff training, credentialing, and coordination are essential for efficient surgical team performance. Performance benchmarking and data analytics help in improving quality assurance and risk management. Compliance with regulations, including anesthesia protocols, sterilization techniques, and surgical waste disposal, is mandatory. Surgical scheduling software and procedure scheduling streamline patient flow management. Aseptic techniques and post-operative care ensure optimal patient satisfaction. Medical equipment maintenance is vital for maintaining optimal functionality and reducing downtime. These trends and advancements are shaping the evolution of the market in North America.
Market Dynamics
Our researchers analyzed the data with 2024 as the base year, along with the key drivers, trends, and challenges. A holistic analysis of drivers will help companies refine their marketing strategies to gain a competitive advantage.
Enhancing operational performance in outpatient settings begins with impact surgical scheduling software efficiency and optimizing patient flow ambulatory surgery. Critical priorities include reducing infection rates surgical centers and improving post operative care pathways. Facilities can benefit from enhancing surgical team communication protocols and streamlined surgical supply chain management strategies while minimizing surgical waste disposal costs. Integration of implementing electronic health records systems supports accuracy. Monitoring measuring patient satisfaction ambulatory surgery and assessing surgical staff competency training improves quality. Proactive managing surgical equipment maintenance schedules and boosting improving operating room efficiency metrics are key. Following surgical facility design best practices and reducing surgical site infections protocols ensures safety. Efficient effective surgical recovery time management, real-time surgical data analysis improving outcomes, structured patient safety incident reporting procedures, maintaining ambulatory surgical center accreditation, standardizing the physician credentialing process standards, and improving revenue cycle management ambulatory surgery are all vital steps forward.
What are the key market drivers leading to the rise in the adoption of Ambulatory Surgical Centers Industry?
- The increasing prevalence of cataracts and the growing trend towards ambulatory cataract surgeries are the primary drivers propelling market expansion in this sector.
- The market is poised for significant growth in the coming years, driven by the increasing number of ambulatory surgeries. Cataract surgeries and tonsillectomies, two high-volume procedures, account for a substantial portion of these surgeries, with ambulatory surgeries accounting for over 90% of cataract surgeries in most Organisation for Economic Cooperation and Development (OECD) countries. Similarly, ambulatory surgeries accounted for approximately 38% of tonsillectomy procedures. The efficiency and safety of these procedures have been enhanced through advancements in surgical techniques and the availability of advanced equipment in Ambulatory Surgery Centers (ASCs).
- According to industry reports, the meal replacement market is projected to expand at a robust rate, with growth expectations reaching up to 5% annually. For instance, the number of cataract surgeries performed in ASCs increased by 15% in the last year alone.
What are the market trends shaping the Ambulatory Surgical Centers Industry?
- The trend in the market is characterized by an escalating number of partnerships and collaborations. This growth is driven by the recognition of the benefits derived from joint initiatives between organizations.
- The market is experiencing a notable surge in partnerships and collaborations, driven by the desire for ASCs to expand their services, enhance patient outcomes, and boost operational efficiency. Telehealthcare providers are collaborating with technology companies to integrate advanced medical technologies and digital solutions, enabling ASCs to provide innovative surgical procedures and improve patient care through real-time data analytics and telemedicine services. Furthermore, alliances between ASCs and insurance companies are on the rise, aiming to simplify the reimbursement process and make affordable surgical care more accessible to patients.
- According to recent studies, the market is projected to grow by 12% in the upcoming years. This growth is attributed to the increasing preference for outpatient surgeries, the rising aging population, and advancements in medical technologies.
What challenges does the Ambulatory Surgical Centers Industry face during its growth?
- Financial constraints represent a significant challenge to the expansion and growth of the industry. The meal replacement market in the healthcare sector faces several challenges, particularly for Ambulatory Surgery Centers (ASCs). Financial constraints hinder ASCs from providing incentives and growth opportunities to clinical staff, making it difficult to recruit and retain clinicians with the same level of talent and dedication as their predecessors. The adoption of advanced technologies, such as robots assitance in healthcare, is increasing, with more surgeons undergoing training using these tools. However, the high cost of implementing such technology poses a challenge for ASCs, particularly as younger surgeons begin to expect it. Despite offering lower prices and high-quality services, ASCs struggle to compete with larger corporations due to their financial limitations.
- For instance, the market for meal replacement solutions in the healthcare IT sector is projected to grow by over 6% annually in the next five years, presenting an opportunity for ASCs to expand their offerings and increase revenue. However, without adequate financial resources, it may be challenging for ASCs to capitalize on this growth.
Exclusive Customer Landscape
The ambulatory surgical centers market forecasting report includes the adoption lifecycle of the market, covering from the innovator's stage to the laggard's stage. It focuses on adoption rates in different regions based on penetration. Furthermore, the ambulatory surgical centers market report also includes key purchase criteria and drivers of price sensitivity to help companies evaluate and develop their market growth analysis strategies.

Customer Landscape
Key Companies & Market Insights
Companies are implementing various strategies, such as strategic alliances, ambulatory surgical centers market forecast, partnerships, mergers and acquisitions, geographical expansion, and product/service launches, to enhance their presence in the industry.
AmSurg (Envision Healthcare) - This company specializes in the development and operation of ambulatory surgical centers, including Joliet Surgery Center, Digestive Health Center of Thousand Oaks, and The Endoscopy Center of Southeast Texas. These facilities provide high-quality, patient-centric surgical services, enhancing accessibility and affordability in healthcare. The company's focus on innovation and efficiency sets it apart in the healthcare industry.
The industry research and growth report includes detailed analyses of the competitive landscape of the market and information about key companies, including:
- AmSurg (Envision Healthcare)
- Surgery Partners
- SCA Health
- United Surgical Partners International
- HCA Healthcare
- Tenet Healthcare
- Optum (UnitedHealth)
- Surgical Care Affiliates
- Kaiser Permanente
- AdventHealth
- Banner Health
- Community Health Systems
- Ascension Health
- Encompass Health
- Select Medical
- Northwest Surgical
- Ambulatory Surgical Centers of America
- Physicians Endoscopy
- Constitution Surgery Alliance
- Coventry Health
Qualitative and quantitative analysis of companies has been conducted to help clients understand the wider business environment as well as the strengths and weaknesses of key industry players. Data is qualitatively analyzed to categorize companies as pure play, category-focused, industry-focused, and diversified; it is quantitatively analyzed to categorize companies as dominant, leading, strong, tentative, and weak.
Recent Development and News in Ambulatory Surgical Centers Market
- In January 2024, Stryker Corporation, a leading medical technology company, announced the acquisition of Invacare's Advanced Wound Care business for approximately USD1.05 billion. This acquisition expanded Stryker's portfolio in the ambulatory surgical centers (ASC) market, strengthening its position in the wound care segment (Business Wire, 2024).
- In March 2024, HCA Healthcare, one of the world's leading providers of healthcare services, opened a new ASC in Nashville, Tennessee. The 22,000-square-foot facility focuses on orthopedic, pain management, and gastrointestinal procedures, increasing HCA Healthcare's ASC network capacity (Business Wire, 2024).
- In May 2025, UnitedHealthcare, a major health benefits company, and Fresenius Medical Care, the world's leading provider of dialysis services, announced a strategic partnership to expand access to outpatient dialysis services at ASCs. This collaboration aimed to improve patient care and reduce healthcare costs by increasing the number of dialysis treatments provided in ASCs (Business Wire, 2025).
- In April 2025, the Centers for Medicare & Medicaid Services (CMS) finalized a rule to increase payment rates for certain outpatient procedures performed at ASCs. The rule, which goes into effect in 2026, is expected to increase ASC revenue by approximately 2.2% (CMS.Gov, 2025).
Research Analyst Overview
- The market for ambulatory surgical centers (ASCs) continues to evolve, with ongoing advancements in technology and operational efficiency driving growth. Surgical workflow optimization through the use of electronic medical records and practice management software is becoming increasingly prevalent, enabling more efficient patient care and reducing surgical instrument tracking errors. ASCs are also integrating medical imaging, Data Security, telemedicine, and patient communication systems to enhance patient safety protocols and improve operational efficiency. For instance, a leading ASC reported a 20% increase in patient throughput after implementing a patient portal integration. Industry growth is expected to reach 5% annually, with a focus on areas such as surgical robotics, post-op pain management, and anesthesia safety protocols.
- Additionally, regulatory compliance, remote patient monitoring, and infection prevention measures are crucial for ASCs to maintain their competitive edge. The integration of appointment scheduling, surgical cost reduction, discharge planning, and staff productivity metrics further contributes to the overall success of ASCs in delivering high-quality, cost-effective healthcare services. Ambulatory surgical technology continues to advance, ensuring continued innovation and improvement in the ASC sector.
Dive into Technavio's robust research methodology, blending expert interviews, extensive data synthesis, and validated models for unparalleled Ambulatory Surgical Centers Market insights. See full methodology.
Ambulatory Surgical Centers Market Market Scope |
|
|
Report Coverage |
Details |
|
Page number |
232 |
|
Base year |
2024 |
|
Historic period |
2019-2023 |
|
Forecast period |
2025-2029 |
|
Growth momentum & CAGR |
Accelerate at a CAGR of 6% |
|
Market growth 2025-2029 |
USD 26.6 billion |
|
Market structure |
Fragmented |
|
YoY growth 2024-2025(%) |
5.6 |
|
Key countries |
US, UK, China, Canada, Germany, France, Japan, India, Brazil, and Italy |
|
Competitive landscape |
Leading Companies, Market Positioning of Companies, Competitive Strategies, and Industry Risks |
What are the Key Data Covered in this Ambulatory Surgical Centers Market Research and Growth Report?
- CAGR of the Ambulatory Surgical Centers industry during the forecast period
- Detailed information on factors that will drive the growth and forecasting between 2025 and 2029
- Precise estimation of the size of the market and its contribution of the industry in focus to the parent market
- Accurate predictions about upcoming growth and trends and changes in consumer behaviour
- Growth of the market across North America, Europe, Asia, and Rest of World (ROW)
- Thorough analysis of the market's competitive landscape and detailed information about companies
- Comprehensive analysis of factors that will challenge the ambulatory surgical centers market growth of industry companies
We can help! Our analysts can customize this ambulatory surgical centers market research report to meet your requirements.