
Medical Technologies Market Size 2025-2029
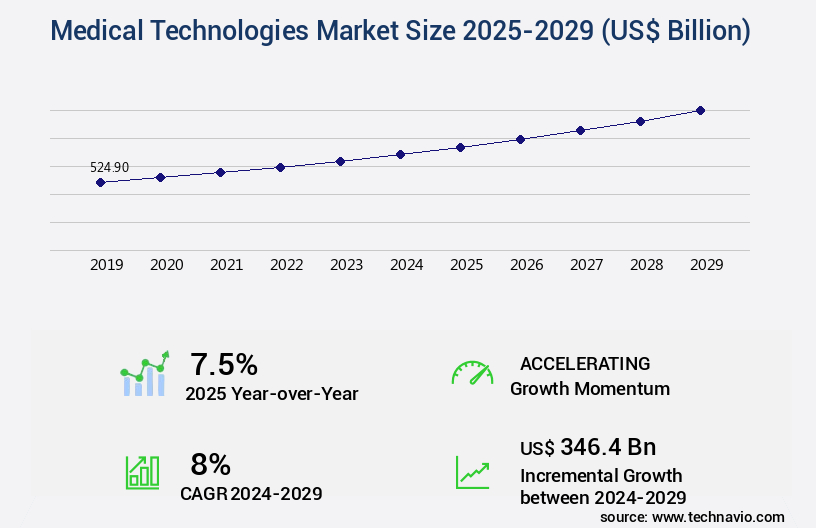
The medical technologies market size is valued to increase USD 346.4 billion, at a CAGR of 8% from 2024 to 2029. Increasing prevalence of diseases will drive the medical technologies market.
Major Market Trends & Insights
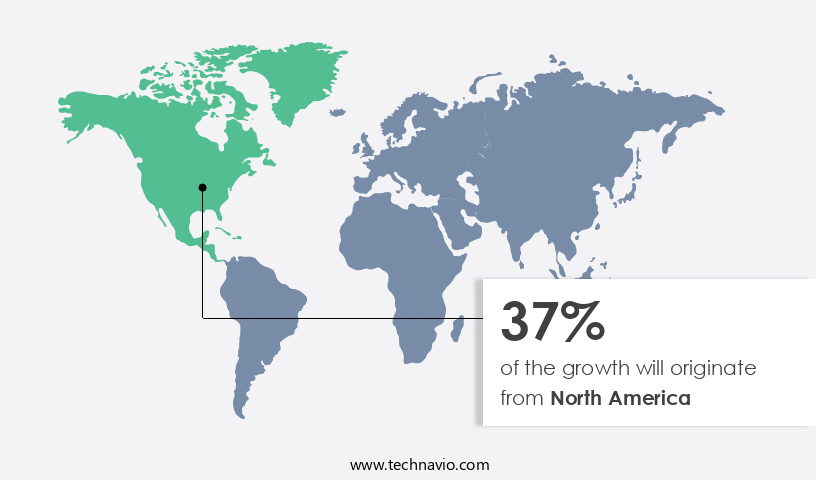
- North America dominated the market and accounted for a 37% growth during the forecast period.
- By Application - Medical devices segment was valued at USD 432.80 billion in 2023
- By End-user - Hospitals segment accounted for the largest market revenue share in 2023
Market Size & Forecast
- Market Opportunities: USD 106.19 billion
- Market Future Opportunities: USD 346.40 billion
- CAGR : 8%
- North America: Largest market in 2023
Market Summary
- The market encompasses a dynamic and continually evolving landscape, driven by advancements in core technologies and applications. Key technologies, such as artificial intelligence, robotics, and nanotechnology, are revolutionizing healthcare delivery and diagnosis. Applications, including telemedicine, remote patient monitoring, and electronic health records, are increasingly adopted for their convenience and efficiency. Service types, such as medical device outsourcing and managed services, are gaining traction due to their cost-effective solutions. However, the market faces challenges, including declining reimbursement and cost containment measures, as well as regulatory complexities. For instance, the US Food and Drug Administration (FDA) mandates rigorous testing and approval processes for medical devices.
- Despite these challenges, the market is expected to witness significant growth, with the increasing prevalence of diseases and the growing use of connected devices and technologies fueling demand.
What will be the Size of the Medical Technologies Market during the forecast period?
Get Key Insights on Market Forecast (PDF) Request Free Sample
How is the Medical Technologies Market Segmented and what are the key trends of market segmentation?
The medical technologies industry research report provides comprehensive data (region-wise segment analysis), with forecasts and estimates in "USD billion" for the period 2025-2029, as well as historical data from 2019-2023 for the following segments.
- Application
- Medical devices
- In-vitro diagnostics
- End-user
- Hospitals
- Clinics
- Others
- Component
- Hardware
- Services
- Software
- Geography
- North America
- US
- Canada
- Mexico
- Europe
- France
- Germany
- Italy
- UK
- APAC
- China
- India
- Japan
- Rest of World (ROW)
- North America
By Application Insights
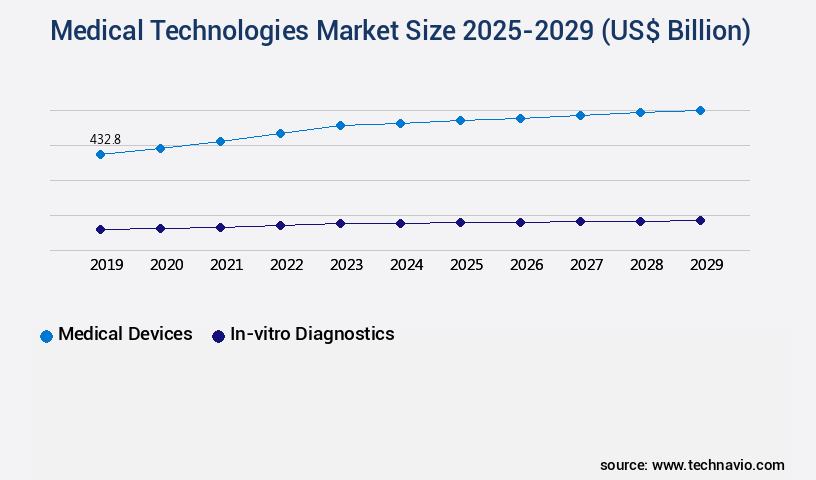
The medical devices segment is estimated to witness significant growth during the forecast period.
Medical technologies encompass a diverse range of innovations transforming healthcare delivery. Key segments include medical imaging techniques, remote patient monitoring, prosthetic limb technology, minimally invasive surgery, lab-on-a-chip devices, augmented reality surgery, nanotechnology in medicine, 3D-printed medical implants, therapeutic antibodies, gene therapy vectors, personalized medicine, pharmaceutical manufacturing, clinical trial management, bioprinting technology, medical data analytics, genomic sequencing methods, artificial intelligence diagnostics, cardiovascular devices, virtual reality therapy, stem cell therapies, telemedicine platforms, cancer diagnostics, medical device regulation, biosensor technology, drug delivery systems, point-of-care diagnostics, diagnostic imaging software, regenerative medicine, surgical robotics systems, health informatics systems, precision medicine approaches, neurological implants, and biomaterial development.
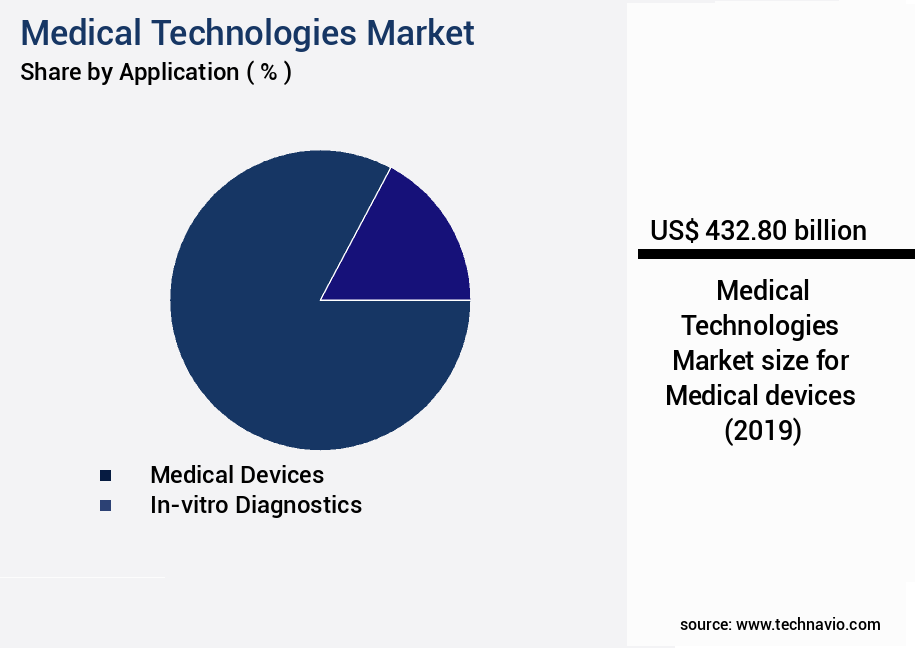
The Medical devices segment was valued at USD 432.80 billion in 2019 and showed a gradual increase during the forecast period.
Therapeutic and surgical devices, such as prosthetics and surgical robots, are expected to witness substantial growth due to advancements in technology and rising demand for minimally invasive procedures. Remote patient monitoring, driven by the aging population and increasing chronic disease prevalence, is projected to grow by 25.1% over the next five years. Furthermore, the adoption of artificial intelligence diagnostics and precision medicine approaches is poised to revolutionize disease detection and treatment, contributing to the market's expansion.
Regional Analysis
North America is estimated to contribute 37% to the growth of the global market during the forecast period. Technavio's analysts have elaborately explained the regional trends and drivers that shape the market during the forecast period.
See How Medical Technologies Market Demand is Rising in North America Request Free Sample
The market is experiencing significant growth and evolution, with North America leading the way due to increasing healthcare costs, disease prevalence, and advanced technology adoption. Smartphone penetration is driving the adoption of mHealth technologies, enabling healthcare providers and patients to access innovative digital solutions. Public and private investments in the industry are on the rise, fueled by the potential to deliver improved patient care and innovative healthcare solutions. According to recent studies, the number of mHealth app downloads reached 3.2 billion in 2020, representing a 20% increase from the previous year.
Furthermore, the telehealth market is projected to reach USD 185.6 billion by 2026, growing at a compound annual growth rate of 16.4%. The market's continuous unfolding is shaped by technological advancements, regulatory frameworks, and consumer preferences, making it an exciting and dynamic space for businesses to explore.
Market Dynamics
Our researchers analyzed the data with 2024 as the base year, along with the key drivers, trends, and challenges. A holistic analysis of drivers will help companies refine their marketing strategies to gain a competitive advantage.
The market encompasses the development and implementation of advanced innovations aimed at enhancing healthcare delivery and patient outcomes. Key areas of focus include the integration of artificial intelligence (AI) in medical imaging for improved diagnostic accuracy, the application of AI in medical diagnostics to expedite disease detection, and the use of machine learning in predictive modeling to anticipate health trends. In surgical advancements, the development of next-generation advanced surgical robots and minimally invasive tools is transforming procedures, offering greater precision and reduced recovery times. Furthermore, the implementation of remote patient monitoring systems and advanced drug delivery nanoparticulate systems is revolutionizing patient care, enabling real-time health monitoring and targeted therapeutic interventions.
The market also witnesses significant growth in next-generation genomic sequencing technology, high throughput genomic screening methods, and clinical trial data management systems, driving the personalization of healthcare and pharmaceutical process optimization strategies. The therapeutic potential of stem cell transplantation and the use of virtual reality (VR) in neurological rehabilitation are further expanding the market's scope. Notably, 3D bioprinting techniques for tissue regeneration and the design and testing of biocompatible polymeric implants are gaining traction, paving the way for advanced medical applications. Nanotechnology applications, such as targeted drug delivery, advanced biosensors for continuous glucose monitoring, and the development of personalized cancer therapies, are also making a substantial impact.
Adoption rates for these advanced medical technologies vary significantly across regions and applications. For instance, more than 70% of new product developments in the pharmaceutical sector focus on the North American market, while the Asian market accounts for a substantial share of the global demand for minimally invasive surgical tools. These trends reflect the evolving dynamics of the market and the growing importance of technology-driven innovation in healthcare.
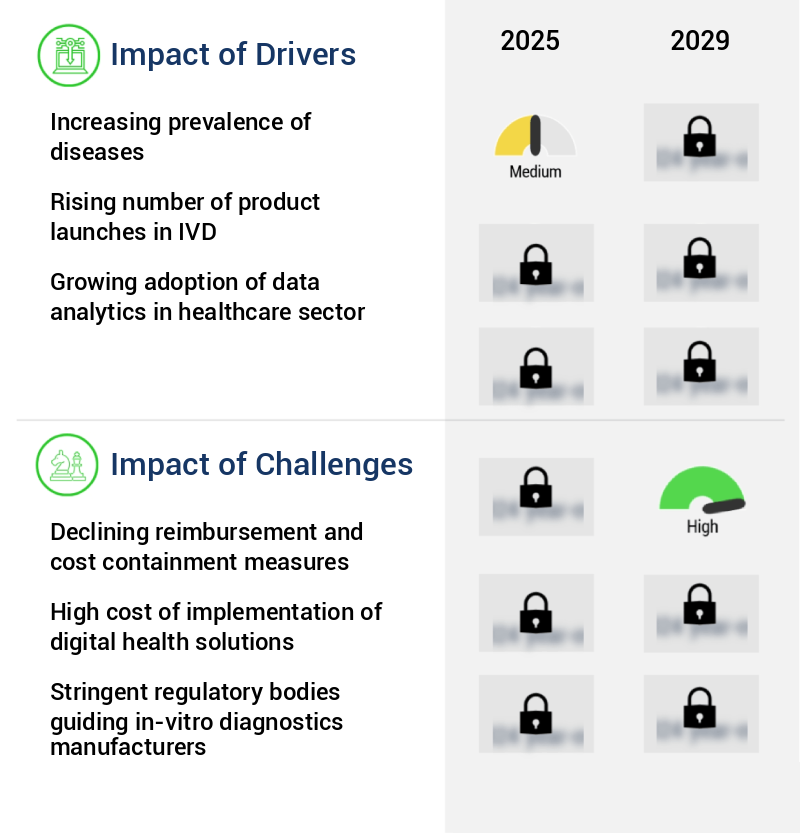
What are the key market drivers leading to the rise in the adoption of Medical Technologies Industry?
- The prevalence of diseases is the primary factor fueling market growth, as an increasing number of individuals are diagnosed with various health conditions.
- The market is experiencing a significant shift towards addressing the escalating burden of diseases. Innovative advancements in medical technologies, including artificial intelligence (AI), machine learning, and big data analytics, are revolutionizing diagnostic tools, personalized treatments, and preventive measures to combat the growing incidence of various diseases worldwide. Notable developments include AI-driven diagnostic tools capable of detecting diseases like cancer and Alzheimer's at earlier stages, enhancing patient outcomes. Furthermore, machine learning algorithms are expediting the discovery of targeted therapies for complex and rare diseases. This trend underscores the continuous evolution of medical technologies and their applications across various sectors.
What are the market trends shaping the Medical Technologies Industry?
- The increasing prevalence of connected devices and technologies represents a significant market trend. This trend is shaped by the growing adoption of advanced technologies and the increasing demand for seamless integration between various digital platforms.
- The IoT's integration into healthcare is a significant trend driving the expansion of the market. In this sector, the IoT bridges the divide between physical and digital data sources by providing real-time patient monitoring. Connected hospital infrastructure, enabled by IoT technology, enhances access to healthcare services, lessens the operational burden on facilities, and fosters the creation of digital healthcare ecosystems. The IoT's applications in healthcare span beyond hospital settings, with the potential for further growth. Healthcare organizations are increasingly adopting connected infrastructure to deliver efficient and timely care.
- IoT technology's impact on healthcare is substantial, offering numerous benefits and applications. For instance, it enables remote patient monitoring, facilitates early diagnosis, and supports telemedicine services. The IoT's influence on healthcare is transformative, and its role in enhancing patient care and operational efficiency is undeniable.
What challenges does the Medical Technologies Industry face during its growth?
- The implementation of cost containment measures and declining reimbursements pose a significant challenge to the industry's growth trajectory. These financial pressures are a key concern for industry professionals, requiring strategic responses to maintain profitability and deliver quality services.
- The US healthcare market is undergoing a significant transformation as cost-containment measures become increasingly prevalent. Government entities, including Medicare and Medicaid, are implementing strategies to reduce spending on medical procedures and treatments. These measures encompass limiting reimbursements, outcome-based payments, population health management (PHM), and new regulations. For example, the Sunshine Act, now known as Open Payments, requires manufacturers to report their annual spending on physicians and educational activities to the Centers for Medicare and Medical Services (CMS).
- This legislation impacts medical communications and clinical data collection, which are essential for robust sales. These evolving market dynamics underscore the importance of staying informed about regulatory changes and adapting to the shifting healthcare landscape.
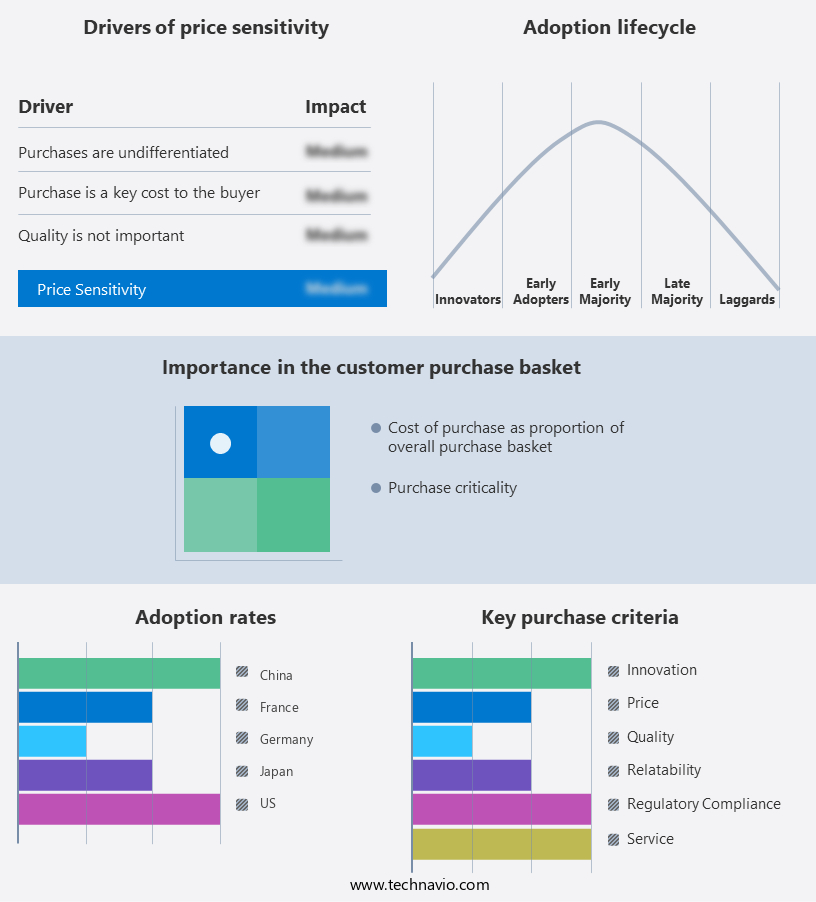
Exclusive Customer Landscape
The medical technologies market forecasting report includes the adoption lifecycle of the market, covering from the innovator's stage to the laggard's stage. It focuses on adoption rates in different regions based on penetration. Furthermore, the medical technologies market report also includes key purchase criteria and drivers of price sensitivity to help companies evaluate and develop their market growth analysis strategies.
Customer Landscape of Medical Technologies Industry
Competitive Landscape & Market Insights
Companies are implementing various strategies, such as strategic alliances, medical technologies market forecast, partnerships, mergers and acquisitions, geographical expansion, and product/service launches, to enhance their presence in the industry.
Abbott Laboratories - This company specializes in advanced medical technology, focusing on electron beam sterilization for medical devices.
The industry research and growth report includes detailed analyses of the competitive landscape of the market and information about key companies, including:
- Abbott Laboratories
- B.Braun SE
- Baxter International Inc.
- Becton Dickinson and Co.
- Boston Scientific Corp.
- Canon Inc.
- Cordis Corp.
- F. Hoffmann La Roche Ltd.
- Fresenius SE and Co. KGaA
- General Electric Co.
- Johnson and Johnson Services Inc.
- Koninklijke Philips NV
- Medtronic Plc
- Nihon Kohden Corp.
- Olympus Corp.
- OMRON Corp.
- Siemens AG
- Smith and Nephew plc
- Stryker Corp.
- Zimmer Biomet Holdings Inc.
Qualitative and quantitative analysis of companies has been conducted to help clients understand the wider business environment as well as the strengths and weaknesses of key industry players. Data is qualitatively analyzed to categorize companies as pure play, category-focused, industry-focused, and diversified; it is quantitatively analyzed to categorize companies as dominant, leading, strong, tentative, and weak.
Recent Development and News in Medical Technologies Market
- In January 2024, Medtronic, a leading medical technology company, announced the FDA approval of its new insulin pump system, MiniMed™ 780G, which features advanced hybrid closed-loop technology. This approval marks a significant advancement in diabetes care technology (Medtronic Press Release, 2024).
- In March 2024, Siemens Healthineers and IBM Watson Health entered into a strategic partnership to integrate IBM Watson's AI capabilities into Siemens Healthineers' medical imaging systems. This collaboration aims to enhance diagnostic accuracy and improve patient care (IBM Watson Health Press Release, 2024).
- In May 2024, Philips secured a USD 1.2 billion investment from the Abu Dhabi Investment Authority to expand its presence in the Middle East and Africa. This investment will support the growth of Philips' health technology business in these regions (Philips Press Release, 2024).
- In February 2025, the European Commission approved the acquisition of Ethicon Endo-Surgery, a Johnson & Johnson company, by Edwards Lifesciences. This acquisition will strengthen Edwards Lifesciences' position in the surgical device market (European Commission Press Release, 2025).
Dive into Technavio's robust research methodology, blending expert interviews, extensive data synthesis, and validated models for unparalleled Medical Technologies Market insights. See full methodology.
|
Market Scope |
|
|
Report Coverage |
Details |
|
Page number |
231 |
|
Base year |
2024 |
|
Historic period |
2019-2023 |
|
Forecast period |
2025-2029 |
|
Growth momentum & CAGR |
Accelerate at a CAGR of 8% |
|
Market growth 2025-2029 |
USD 346.4 billion |
|
Market structure |
Fragmented |
|
YoY growth 2024-2025(%) |
7.5 |
|
Key countries |
US, Canada, China, Germany, UK, France, Japan, Italy, Mexico, and India |
|
Competitive landscape |
Leading Companies, Market Positioning of Companies, Competitive Strategies, and Industry Risks |
Research Analyst Overview
- In the dynamic and innovative landscape of medical technologies, various sectors continue to evolve, driving advancements that redefine healthcare delivery. Medical imaging techniques, such as magnetic resonance imaging (MRI) and computed tomography (CT), revolutionize diagnosis and treatment planning. Remote patient monitoring enables real-time health data collection, fostering proactive care and improved patient outcomes. Prosthetic limb technology, fueled by advancements in materials science and engineering, offers enhanced functionality and user experience. Minimally invasive surgery and laparoscopic procedures reduce recovery time and complications. Lab-on-a-chip devices and point-of-care diagnostics bring testing capabilities closer to patients, enabling faster results and more personalized care.
- Augmented reality surgery and virtual reality therapy revolutionize training and treatment, while nanotechnology in medicine and 3D-printed medical implants offer targeted interventions and customized solutions. Therapeutic antibodies and gene therapy vectors pave the way for precision medicine, addressing the root causes of diseases. Biopharmaceutical manufacturing and clinical trial management employ advanced technologies to streamline processes and ensure product safety and efficacy. Bioprinting technology and regenerative medicine offer promising solutions for tissue repair and organ replacement. Medical data analytics, genomic sequencing methods, and artificial intelligence diagnostics enable more informed decision-making and personalized treatment plans. Cardiovascular devices, from pacemakers to stents, continue to evolve, improving patient outcomes and quality of life.
- Cancer diagnostics and surgical robotics systems offer more accurate and precise interventions. Neurological implants and health informatics systems revolutionize the treatment of neurological disorders and facilitate efficient healthcare management. Biosensor technology, drug delivery systems, and precision medicine approaches further expand the horizon of medical technologies, addressing diverse healthcare needs and driving continuous innovation.
What are the Key Data Covered in this Medical Technologies Market Research and Growth Report?
-
What is the expected growth of the Medical Technologies Market between 2025 and 2029?
-
USD 346.4 billion, at a CAGR of 8%
-
-
What segmentation does the market report cover?
-
The report segmented by Application (Medical devices and In-vitro diagnostics), End-user (Hospitals, Clinics, and Others), Component (Hardware, Services, and Software), and Geography (North America, Europe, Asia, and Rest of World (ROW))
-
-
Which regions are analyzed in the report?
-
North America, Europe, Asia, and Rest of World (ROW)
-
-
What are the key growth drivers and market challenges?
-
Increasing prevalence of diseases, Declining reimbursement and cost containment measures
-
-
Who are the major players in the Medical Technologies Market?
-
Key Companies Abbott Laboratories, B.Braun SE, Baxter International Inc., Becton Dickinson and Co., Boston Scientific Corp., Canon Inc., Cordis Corp., F. Hoffmann La Roche Ltd., Fresenius SE and Co. KGaA, General Electric Co., Johnson and Johnson Services Inc., Koninklijke Philips NV, Medtronic Plc, Nihon Kohden Corp., Olympus Corp., OMRON Corp., Siemens AG, Smith and Nephew plc, Stryker Corp., and Zimmer Biomet Holdings Inc.
-
Market Research Insights
- The market encompasses a diverse range of innovations, including medical device sterilization, pharmacokinetic modeling, clinical trial design, biomedical engineering, medical image processing, biomarker discovery, radiation therapy planning, surgical simulation, predictive modeling, clinical research protocols, pharmaceutical research, neurological rehabilitation, medical device testing, data mining healthcare, healthcare IT infrastructure, healthcare analytics, disease diagnostics, imaging contrast agents, therapeutic efficacy, patient data security, medical device design, tissue engineering, drug metabolism studies, precision oncology, drug efficacy assessment, biocompatible materials, and drug discovery. According to recent estimates, this sector is projected to reach USD650 billion by 2025, growing at a compound annual growth rate of 5.5%.
- In comparison, the biotechnology applications segment within medical technologies is anticipated to expand at a faster pace, with a CAGR of 7.2%, reaching USD350 billion by 2025. These figures underscore the continuous evolution and expanding scope of the market.
We can help! Our analysts can customize this medical technologies market research report to meet your requirements.
 RIA -
RIA - 
