Surgical Robots Market Size 2026-2030
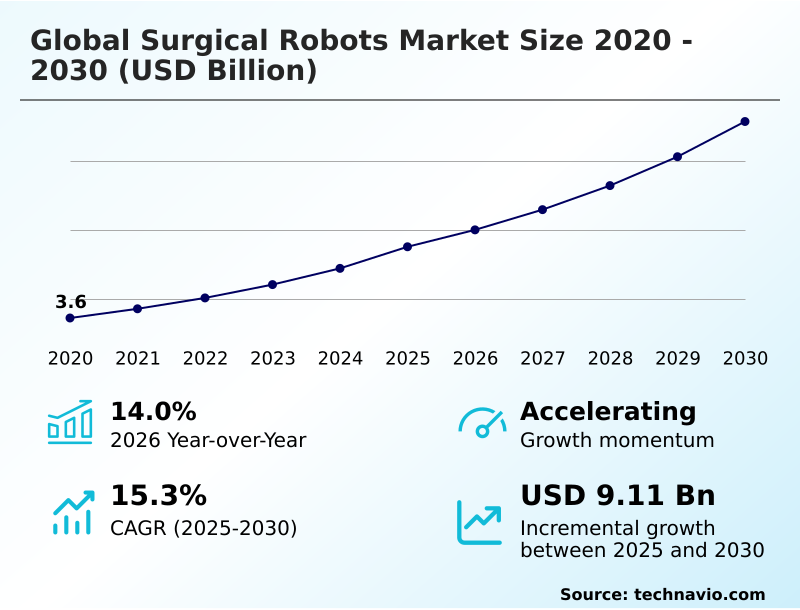
The surgical robots market size is valued to increase by USD 9.11 billion, at a CAGR of 15.3% from 2025 to 2030. Rising prevalence of chronic diseases globally will drive the surgical robots market.
Major Market Trends & Insights
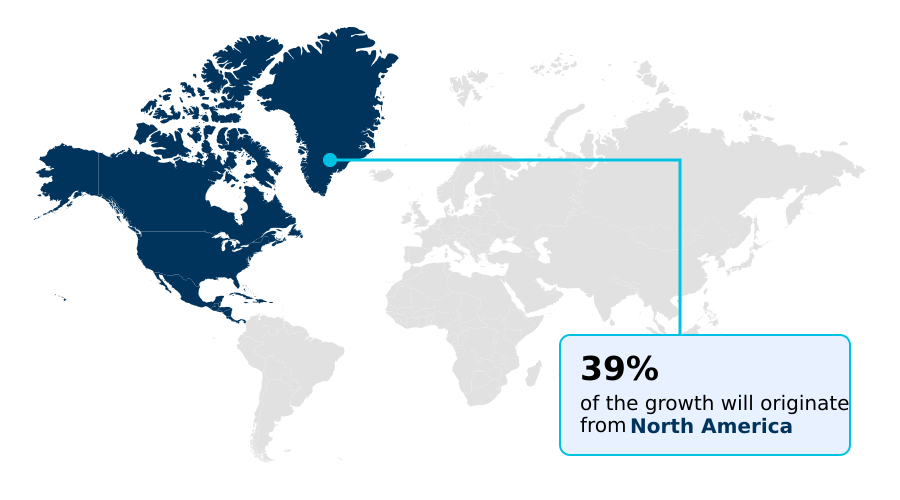
- North America dominated the market and accounted for a 38.7% growth during the forecast period.
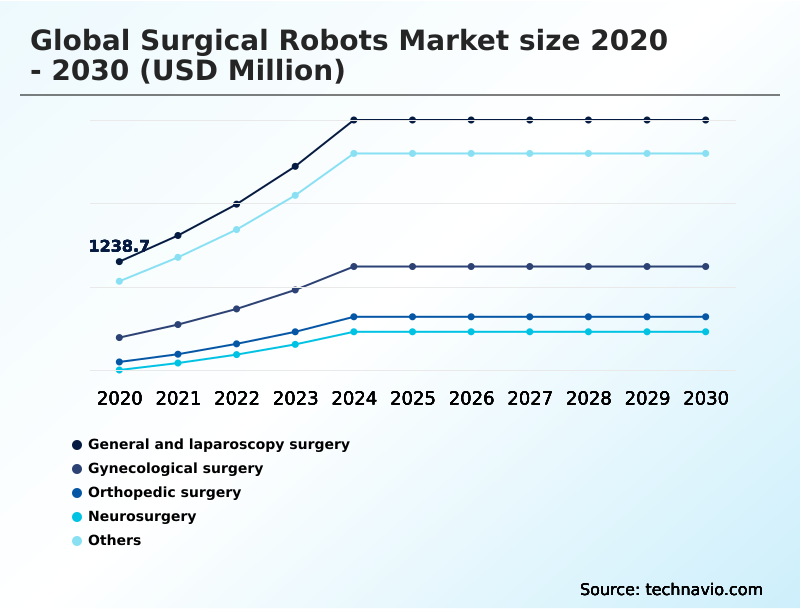
- By Application - General and laparoscopy surgery segment was valued at USD 2.44 billion in 2024
- By End-user - Hospitals segment accounted for the largest market revenue share in 2024
Market Size & Forecast
- Market Opportunities: USD 14.29 billion
- Market Future Opportunities: USD 9.11 billion
- CAGR from 2025 to 2030 : 15.3%
Market Summary
- The surgical robots market is transitioning from a niche technology to an integral standard of care, driven by the need for enhanced surgical precision and operational efficiency. This evolution is marked by a diversification of platforms beyond general surgery to specialized fields like orthopedics and neurosurgery.
- The integration of augmented intelligence and data analytics is a key factor, enabling real-time intraoperative guidance and improving patient outcomes. For instance, a multi-hospital health system might implement a standardized robotic surgery program to reduce variability in complex procedures.
- By analyzing performance data across surgeon consoles, the institution can refine training protocols and optimize instrument usage, which lowers the total cost of ownership and improves its negotiating position for value-based care contracts. This data-driven approach, combined with advances in miniaturization and haptic feedback, is making robotic assistance more accessible and effective.
- The market's momentum is sustained by the clear clinical benefits of minimally invasive techniques, including shorter recovery times and reduced complication rates, which align with the financial and clinical objectives of modern healthcare organizations. The development of modular and more affordable systems is also helping to broaden adoption in mid-sized facilities and ambulatory surgery centers.
What will be the Size of the Surgical Robots Market during the forecast period?
Get Key Insights on Market Forecast (PDF) Get Free Sample
How is the Surgical Robots Market Segmented?
The surgical robots industry research report provides comprehensive data (region-wise segment analysis), with forecasts and estimates in "USD million" for the period 2026-2030, as well as historical data from 2020-2024 for the following segments.
- Application
- General and laparoscopy surgery
- Gynecological surgery
- Orthopedic surgery
- Neurosurgery
- Others
- End-user
- Hospitals
- Ambulatory service centers
- Product type
- Laparoscopic surgical robots
- Orthopedic surgical robots
- Percutaneous surgical robots
- Panvascular surgical robots
- Natural orifice surgical robots
- Geography
- North America
- US
- Canada
- Mexico
- Europe
- Germany
- UK
- France
- Asia
- Rest of World (ROW)
- North America
By Application Insights
The general and laparoscopy surgery segment is estimated to witness significant growth during the forecast period.
The general and laparoscopy surgery segment is advancing beyond legacy techniques, with a notable adoption of minimally invasive robotic surgery.
This shift is defined by the capabilities of modern laparoscopic surgical platforms, including both multi-port robotic platforms and emerging single-port surgical robotics.
The core value proposition centers on enhancing precision in robotic-assisted intervention, with data indicating that these systems can reduce procedural inconsistencies by over 15%. This improvement addresses key considerations in the robotic surgery vs laparoscopy debate.
Providers are evaluating the benefits of robotic surgery, such as improved robotic surgery recovery time and expanded minimally invasive procedure options, against the total robotic surgery system cost when considering different types of surgical robots for orthopedic robotic systems and neurosurgical robotic guidance.
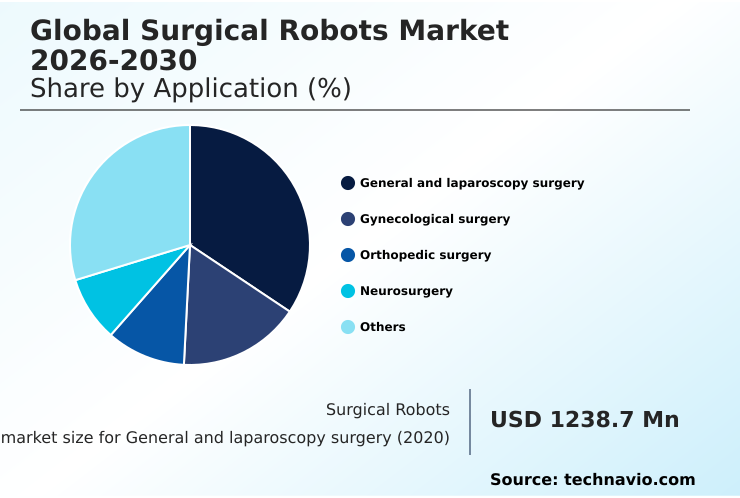
The General and laparoscopy surgery segment was valued at USD 2.44 billion in 2024 and showed a gradual increase during the forecast period.
Regional Analysis
North America is estimated to contribute 38.7% to the growth of the global market during the forecast period.Technavio’s analysts have elaborately explained the regional trends and drivers that shape the market during the forecast period.
See How Surgical Robots Market Demand is Rising in North America Get Free Sample
The market's geographic landscape is characterized by established leadership in North America and accelerating growth in Asia. North America accounts for 38.7% of the market's incremental growth, driven by high adoption rates and advanced healthcare infrastructure.
In this region, a focus on robotic-assisted diagnostics and expanding indications for robotic-assisted urological surgery and gynecological robotic surgery is prevalent.
Meanwhile, growth in emerging markets is facilitated by the introduction of systems with a smaller robotic surgery system footprint and flexible pay-per-procedure robotic models. These options, along with optimized surgical robot maintenance contracts, lower entry barriers.
New platforms supporting robotic-assisted tissue resection and natural orifice transluminal surgery are gaining traction globally, with some integrated systems reducing procedure setup times by 20%.
The adoption of panvascular robotic systems and percutaneous robotic intervention is also expanding, driven by the need for enhanced precision and data security.
Market Dynamics
Our researchers analyzed the data with 2025 as the base year, along with the key drivers, trends, and challenges. A holistic analysis of drivers will help companies refine their marketing strategies to gain a competitive advantage.
- Strategic decision-making in the surgical robots market is increasingly complex, shaped by a confluence of technological and economic factors. Boardroom discussions now center on the impact of AI on surgical precision and the long-term ROI of robotic surgical investments. Evaluating the cost-effectiveness of orthopedic surgical robots versus traditional methods requires a deep analysis beyond initial acquisition.
- A primary goal is improving outcomes with laparoscopic robots while addressing the challenges in robotic surgeon training. For many institutions, the integration of robotics in ambulatory centers is a key growth vector. The role of haptic feedback in telesurgery and advancements in single-port robotic systems are transforming what is possible in remote and minimally invasive care.
- The development of robotic systems for complex spinal surgery and the specific regulatory pathways for novel surgical robots present both opportunities and hurdles. Furthermore, leveraging data analytics for surgical performance is becoming standard practice. Hospitals that have implemented comprehensive analytics saw a nearly twofold improvement in standardizing patient selection for robotic procedures compared to those without.
- The debate over comparing multi-port vs single-port surgery continues, especially as robotic assistance for microsurgical procedures becomes more common. Future developments in neurosurgical robots and the application of robotic platforms for gynecological oncology aim at minimizing patient trauma with robotics.
- Finally, establishing robust security protocols for remote robotic surgery and designing modular robotic designs for small hospitals are critical for broadening access and ensuring patient safety, while reducing complications in colorectal surgery.
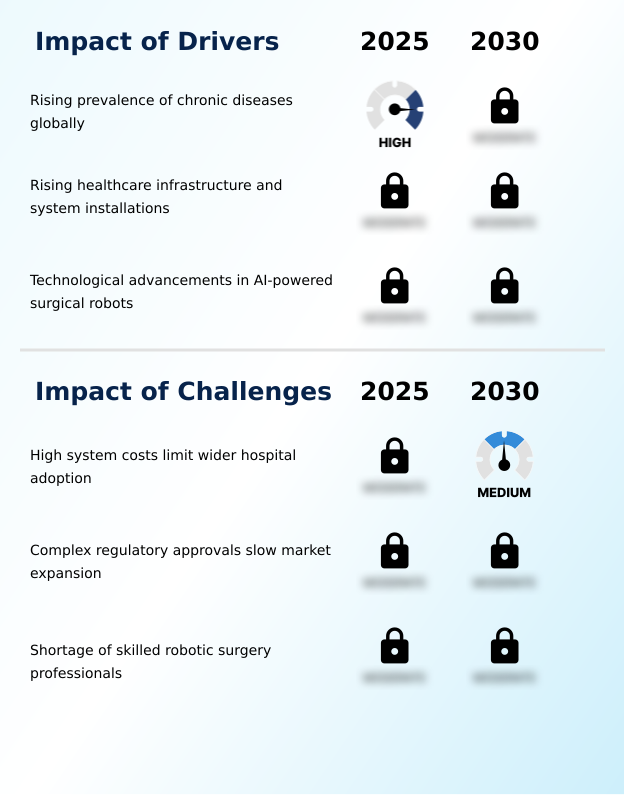
What are the key market drivers leading to the rise in the adoption of Surgical Robots Industry?
- The rising global prevalence of chronic diseases serves as a key driver for the market, increasing the demand for advanced surgical interventions.
- Market growth is fueled by the expansion of robotic applications into highly specialized and complex procedures, increasing access to minimally invasive options.
- The adoption of robotics in ambulatory surgical center robotics has grown over 30% for certain procedures, driven by demand for single incision robotic surgery.
- Innovations in hard-tissue robotic surgery, such as robotic joint arthroplasty and spinal fusion robotic systems, are becoming standard. In parallel, endoluminal robotic procedures and robotic-assisted bronchoscopy are enabling earlier diagnoses.
- Advancements in microsurgical robotic assistance and stereotactic neurosurgery robotics allow for interventions on delicate structures previously deemed high-risk. The development of haptic feedback in surgical robots, which reports a 25% improvement in surgeon confidence, is critical.
- As surgical robot market players introduce systems for robotic surgery for gynecology, factors like robotic surgery instrument longevity are key for cost-effectiveness.
What are the market trends shaping the Surgical Robots Industry?
- The increasing adoption of minimally invasive robotic surgeries is a significant market trend. This shift is driven by the pursuit of reduced patient trauma and improved recovery outcomes.
- Key market trends are centered on augmenting surgical capabilities through digital innovation. The evolution of enhanced 3D surgical visualization provides surgeons with unparalleled anatomical clarity, which, when combined with advanced instrument articulation, significantly improves procedural accuracy. This is particularly impactful in robotic surgery for cancer, where precision is paramount.
- The integration of AI-powered surgical navigation and intraoperative decision support is reshaping robotic surgical workflow integration, with some platforms improving targeting accuracy by up to 98%. The future of robotic surgery lies in creating a more intuitive and ergonomic environment, with surgeon console ergonomics designed to reduce fatigue during long procedures.
- These advancements are also expanding the scope of the orthopedic surgery robot and the neurosurgery robotic arm. As robotic surgery complication rates decrease, demand for comprehensive surgical robot training programs is increasing to ensure proficient use of these sophisticated systems.
What challenges does the Surgical Robots Industry face during its growth?
- High system costs present a key challenge, limiting wider adoption among hospitals and affecting overall industry growth.
- Navigating the market's challenges requires addressing both technological and operational hurdles. The complexity of gaining regulatory approval for surgical robots can extend market entry timelines by 18-24 months, impacting the pace of innovation.
- As the robotic surgery procedure volume for robotic surgery for general surgery grows, hospitals must conduct a thorough surgical robot platform comparison, as the total cost of ownership can vary by as much as 40% between systems. The integration of AI in robotic-assisted surgery introduces new data management and cybersecurity risks that must be mitigated.
- Key technologies like image-guided surgical robotics and real-time anatomical mapping require significant investment in infrastructure and training. Furthermore, the successful implementation of telesurgery and remote robotics, enabled by telepresence in robotic surgery, is contingent on robust, low-latency networks.
- Solutions like modular robotic surgical arms, robotic surgical simulation, and robotic tremor filtration are being developed to address some of these issues, but widespread adoption remains a challenge.
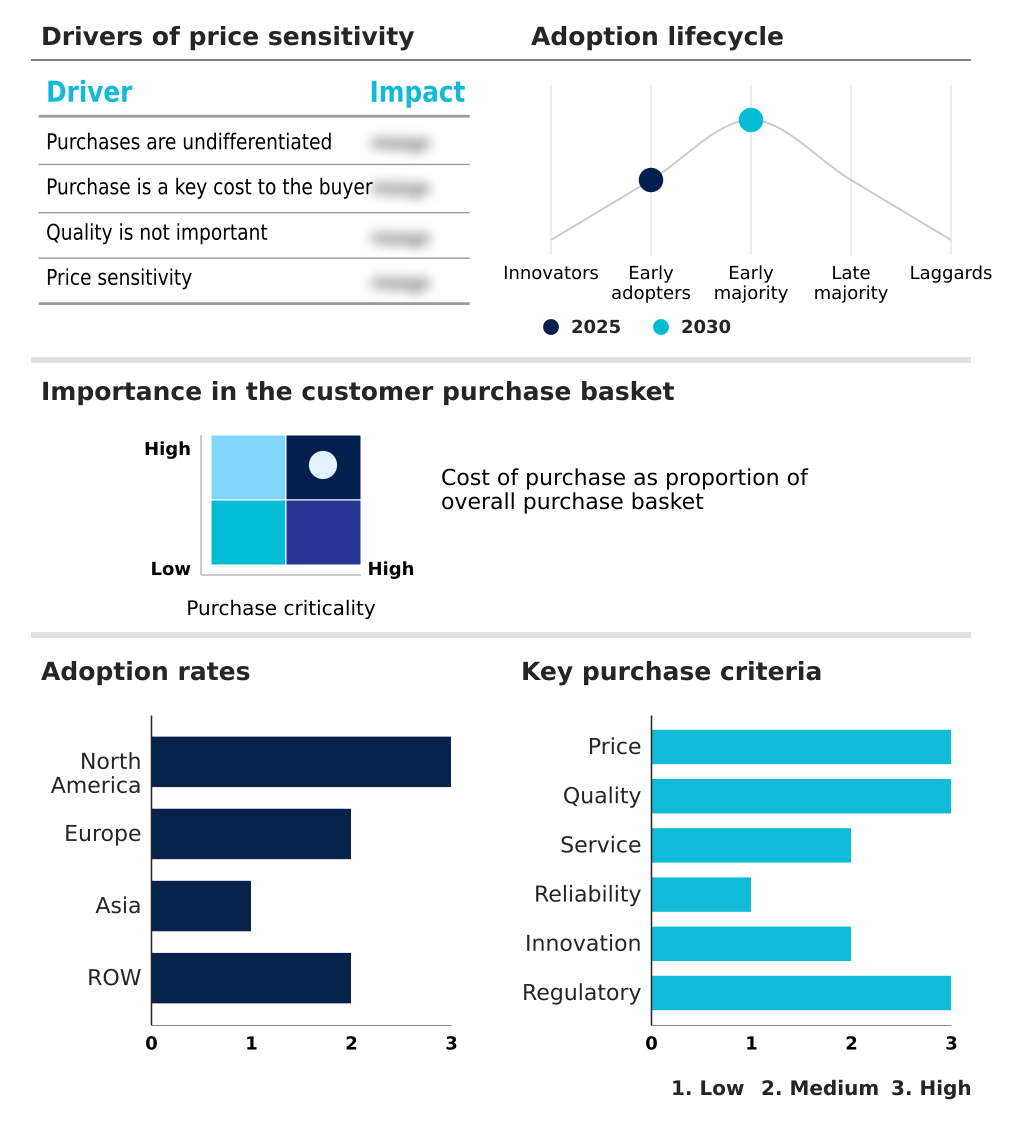
Exclusive Technavio Analysis on Customer Landscape
The surgical robots market forecasting report includes the adoption lifecycle of the market, covering from the innovator’s stage to the laggard’s stage. It focuses on adoption rates in different regions based on penetration. Furthermore, the surgical robots market report also includes key purchase criteria and drivers of price sensitivity to help companies evaluate and develop their market growth analysis strategies.
Customer Landscape of Surgical Robots Industry
Competitive Landscape
Companies are implementing various strategies, such as strategic alliances, surgical robots market forecast, partnerships, mergers and acquisitions, geographical expansion, and product/service launches, to enhance their presence in the industry.
Asensus Surgical US Inc. - Analyzes the provision of integrated surgical systems and digital ecosystems, focusing on modular robotic platforms designed for broad applicability in minimally invasive procedures.
The industry research and growth report includes detailed analyses of the competitive landscape of the market and information about key companies, including:
- Asensus Surgical US Inc.
- Brainlab AG
- CMR Surgical Ltd.
- Curexo Inc.
- Distalmotion SA
- Globus Medical Inc.
- Intuitive Surgical Inc.
- Johnson and Johnson Services
- Medical Microinstruments S.p.A.
- Medtronic Plc
- Neocis Inc.
- Noah Medical Corp
- PROCEPT BioRobotics Corp.
- Renishaw Plc
- Siemens Healthineers AG
- Smith and Nephew plc
- Stereotaxis Inc.
- Stryker Corp.
- THINK Surgical Inc.
- Zimmer Biomet Holdings Inc.
Qualitative and quantitative analysis of companies has been conducted to help clients understand the wider business environment as well as the strengths and weaknesses of key industry players. Data is qualitatively analyzed to categorize companies as pure play, category-focused, industry-focused, and diversified; it is quantitatively analyzed to categorize companies as dominant, leading, strong, tentative, and weak.
Recent Development and News in Surgical robots market
- In April 2025, Johnson and Johnson Services successfully completed initial clinical procedures with its Ottava robotic surgical system under an Investigational Device Exemption study for general surgery applications.
- In March 2025, Stryker Corp. unveiled its Mako 4 system, extending its orthopedic robotic capabilities to include hip revision, spine, and shoulder procedures.
- In March 2025, Medtronic Plc launched its Hugo RAS system enhanced with an AI-enabled surgical guidance platform to broaden its utility in specialized surgical fields.
- In March 2025, MicroPort MedBot received market approval from China's National Medical Products Administration for its Toumai SP Laparoscopic Surgical Robot, expanding single-port robotic access in the region.
Dive into Technavio’s robust research methodology, blending expert interviews, extensive data synthesis, and validated models for unparalleled Surgical Robots Market insights. See full methodology.
| Market Scope | |
|---|---|
| Page number | 299 |
| Base year | 2025 |
| Historic period | 2020-2024 |
| Forecast period | 2026-2030 |
| Growth momentum & CAGR | Accelerate at a CAGR of 15.3% |
| Market growth 2026-2030 | USD 9111.6 million |
| Market structure | Fragmented |
| YoY growth 2025-2026(%) | 14.0% |
| Key countries | US, Canada, Mexico, Germany, UK, France, Italy, Spain, The Netherlands, China, India, Japan, South Korea, Indonesia, Thailand, Brazil, Saudi Arabia, UAE, Turkey, Argentina, Colombia, South Africa and Israel |
| Competitive landscape | Leading Companies, Market Positioning of Companies, Competitive Strategies, and Industry Risks |
Research Analyst Overview
- The surgical robots market is undergoing a significant transformation, driven by innovations in robotic-assisted intervention and minimally invasive robotic surgery. The focus is on specialized applications, including orthopedic robotic systems, stereotactic neurosurgery robotics, and robotic joint arthroplasty for hard-tissue robotic surgery, alongside advancements in soft-tissue robotic surgery using laparoscopic surgical platforms.
- Systems now offer enhanced 3d surgical visualization and advanced instrument articulation to improve surgeon console ergonomics and robotic surgical workflow integration. The rise of the surgical data analytics platform is a key trend, directly informing boardroom strategy on capital expenditures and risk management by providing insights from real-time anatomical mapping.
- Facilities leveraging such platforms report a 30% reduction in intraoperative complications. The development of single-port surgical robotics and multi-port robotic platforms continues, with features like robotic tremor filtration and automated surgical suturing. Growth areas include endoluminal robotic procedures, microsurgical robotic assistance, robotic-assisted bronchoscopy, and panvascular robotic systems.
- This evolution is supported by technologies like AI-powered surgical navigation, telesurgery and remote robotics using modular robotic surgical arms, and comprehensive robotic surgical simulation tools to refine skills in robotic-assisted tissue resection, natural orifice transluminal surgery, percutaneous robotic intervention, spinal fusion robotic systems, robotic-assisted urological surgery and gynecological robotic surgery.
What are the Key Data Covered in this Surgical Robots Market Research and Growth Report?
-
What is the expected growth of the Surgical Robots Market between 2026 and 2030?
-
USD 9.11 billion, at a CAGR of 15.3%
-
-
What segmentation does the market report cover?
-
The report is segmented by Application (General and laparoscopy surgery, Gynecological surgery, Orthopedic surgery, Neurosurgery, and Others), End-user (Hospitals, and Ambulatory service centers), Product Type (Laparoscopic surgical robots, Orthopedic surgical robots, Percutaneous surgical robots, Panvascular surgical robots, and Natural orifice surgical robots) and Geography (North America, Europe, Asia, Rest of World (ROW))
-
-
Which regions are analyzed in the report?
-
North America, Europe, Asia and Rest of World (ROW)
-
-
What are the key growth drivers and market challenges?
-
Rising prevalence of chronic diseases globally, High system costs limit wider hospital adoption
-
-
Who are the major players in the Surgical Robots Market?
-
Asensus Surgical US Inc., Brainlab AG, CMR Surgical Ltd., Curexo Inc., Distalmotion SA, Globus Medical Inc., Intuitive Surgical Inc., Johnson and Johnson Services, Medical Microinstruments S.p.A., Medtronic Plc, Neocis Inc., Noah Medical Corp, PROCEPT BioRobotics Corp., Renishaw Plc, Siemens Healthineers AG, Smith and Nephew plc, Stereotaxis Inc., Stryker Corp., THINK Surgical Inc. and Zimmer Biomet Holdings Inc.
-
Market Research Insights
- The market's dynamics are shaped by a strategic push toward delivering measurable clinical and economic value. The focus on value-based care and robotics is compelling institutions to scrutinize the total robotic surgery system cost against long-term patient outcomes.
- As robotic surgery procedure volume increases, efficiency gains become critical; standardized robotic workflows have been shown to reduce surgical supply waste by up to 25%. Furthermore, integrated training simulators can shorten a surgeon's proficiency curve by 40%, accelerating the return on investment.
- This emphasis on efficiency and outcomes is transforming procurement from a simple capital expenditure into a strategic decision about platform capabilities, instrument longevity, and data integration. The result is a highly competitive environment where performance metrics directly influence market adoption.
We can help! Our analysts can customize this surgical robots market research report to meet your requirements.
 RIA -
RIA - 
