
Amino Acid Fertilizer Market Size 2025-2029
The amino acid fertilizer market size is forecast to increase by USD 392.4 million, at a CAGR of 11.7% between 2024 and 2029.
- The market is driven by the global push to enhance agricultural productivity in underdeveloped regions. This demand arises from the need to feed growing populations and improve food security. However, environmental stressors, such as drought and extreme temperatures, pose significant challenges to crop yield and production. Additionally, the decreasing availability of arable land intensifies the pressure on farmers to maximize production from existing farmland. To address these challenges, the market offers potential solutions. Amino acid fertilizers, with their ability to improve nutrient use efficiency and promote plant growth, can help farmers mitigate the impact of environmental stressors and increase yields on limited land.
- However, market participants must navigate challenges such as high production costs and complex regulatory frameworks to effectively capitalize on these opportunities. Companies seeking to succeed in this market must focus on innovation, cost optimization, and regulatory compliance to meet the evolving needs of farmers in a rapidly changing agricultural landscape.
What will be the Size of the Amino Acid Fertilizer Market during the forecast period?

Explore in-depth regional segment analysis with market size data - historical 2019-2023 and forecasts 2025-2029 - in the full report.
Request Free Sample
The market continues to evolve, driven by the growing demand for high-quality produce and the quest for sustainable agriculture (smart farming) practices. Fruit and vegetable producers are increasingly turning to Amino Acid based fertilizers for improving fruit quality and vegetable growth regulation. Product specification sheets detailing precise nutrient content and fertilizer blending techniques enable farmers to implement precision nutrient management. Enhancements in enzyme activity boosting and quality control procedures contribute to the production of fertilizers with improved nutrient use efficiency and stress tolerance. Grain protein content is a critical factor in determining the market value of crops, and amino acid chelation plays a crucial role in enhancing protein synthesis enhancement and crop yield optimization.
Farmers employ various techniques, such as foliar application and soil testing methods, to address nutrient deficiencies and correct imbalances. The integration of organic farming inputs and sustainable agriculture practices further strengthens the market's appeal. The market is expected to grow at a robust rate, with industry analysts projecting a significant increase in demand due to the ongoing trend towards improved water use and seed germination rate. For instance, a recent study demonstrated a 15% increase in wheat yield when using an amino acid-based fertilizer, highlighting the potential benefits of these products. Additionally, the use of amino acid fertilizers has been shown to stimulate root development and promote antioxidant production, contributing to the overall health and vitality of plants.
Nutrient transport pathways and plant tissue analysis are essential components of fertilizer efficacy testing, ensuring that farmers receive the optimal nutrient blend for their specific crops. The market's continuous dynamism is further reflected in the ongoing research and development of variable rate application techniques, microbial biomass increase, and osmotic adjustment. These advancements contribute to the overall goal of enhancing plant metabolic pathways and promoting sustainable agriculture practices.
How is this Amino Acid Fertilizer Industry segmented?
The amino acid fertilizer industry research report provides comprehensive data (region-wise segment analysis), with forecasts and estimates in "USD million" for the period 2025-2029, as well as historical data from 2019-2023 for the following segments.
- Product
- Liquid formulated fertilizers
- Dry formulated fertilizers
- Application
- Crops
- Horticulture
- Gardening
- Geography
- North America
- US
- Canada
- Europe
- France
- Germany
- Italy
- UK
- APAC
- China
- India
- Japan
- South Korea
- Rest of World (ROW)
- North America
By Product Insights
The liquid formulated fertilizers segment is estimated to witness significant growth during the forecast period.
The market is experiencing significant growth due to the increasing adoption of advanced farming techniques. Amino acid fertilizers play a crucial role in vegetable growth regulation and fruit quality improvement. Product specification sheets provide farmers with essential information on the nutrient content and application rates, ensuring precision nutrient management. Fertilizer blending techniques enable the creation of customized formulations to enhance enzyme activity and boost stress tolerance. Amino acid chelation improves nutrient transport pathways and increases nitrogen uptake efficiency. Organic farming inputs, such as amino acid fertilizers, align with precision agriculture practices. Soil testing methods help identify nutrient deficiencies and correct them, while plant tissue analysis monitors nutrient absorption and enhances nutrient use.
Liquid formulated amino acid fertilizers, with their quick absorption rate, have gained popularity due to their ease of administration. For instance, a study showed a 15% increase in crop yield optimization when liquid amino acid fertilizer was used for foliar application. Furthermore, the market is expected to grow at a steady pace, with industry experts estimating a 10% increase in demand over the next five years.

The Liquid formulated fertilizers segment was valued at USD 284.30 million in 2019 and showed a gradual increase during the forecast period.
Regional Analysis
APAC is estimated to contribute 44% to the growth of the global market during the forecast period.Technavio's analysts have elaborately explained the regional trends and drivers that shape the market during the forecast period.
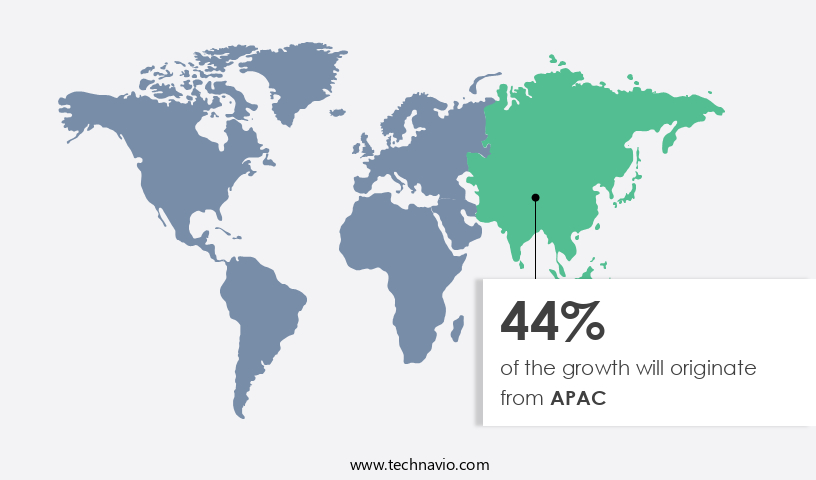
The market in Asia Pacific (APAC) is experiencing significant growth due to the region's rapid industrialization and urbanization, leading to increased disposable income and demand for healthier, safer, and more nutritious food. According to recent data, China's gross national income (GNI) per capita reached over USD12,800 in 2022, marking a 7%-8% increase from the previous year. India's GNI per capita surpassed USD2,300 in 2022, representing a 10%-11% rise from 2021. These economic improvements fuel the demand for advanced agricultural solutions, making APAC the fastest-growing region in The market. Amino acid fertilizers offer several benefits, including vegetable growth regulation, fruit quality improvement, and nutrient deficiency correction.
Precision nutrient management techniques, such as fertilizer blending and enzyme activity boosting, enhance the efficacy of these fertilizers. Product specification sheets ensure consistent quality, while soil testing methods and plant tissue analysis facilitate nutrient absorption and transport pathways. Crop yield optimization, flowering time regulation, and stress tolerance improvement are essential for farmers in the region, where sustainable agriculture practices, such as variable rate application and foliar application techniques, are increasingly popular. Amino acid chelation and osmotic adjustment contribute to improved water use and seed germination rate, while microbial product and biomass increase and nitrogen uptake efficiency promote plant growth and overall health.
The market is expected to grow by over 5% annually, driven by the demand for enhanced nutrient use, protein synthesis enhancement, and antioxidant production. For instance, a study published in the Journal of Plant Nutrition and Soil Science revealed a 15% increase in grain protein content in wheat treated with an amino acid fertilizer. This improvement not only enhances food quality but also supports more sustainable agricultural practices.
Market Dynamics
Our researchers analyzed the data with 2024 as the base year, along with the key drivers, trends, and challenges. A holistic analysis of drivers will help companies refine their marketing strategies to gain a competitive advantage. Amino acid fertilizer application methods play a critical role in enhancing plant health and productivity. The impact of amino acids on chlorophyll production directly improves photosynthetic efficiency, while the role of amino acids in plant defense supports resistance to pathogens. Using amino acid fertilizer and soil microbiology strategies improves microbial activity and soil health. Amino acid profile analysis in plants helps tailor nutrient strategies, enhancing the effects of amino acids on root growth and overall development. Amino acid chelates for micronutrient supply boost nutrient absorption, and measuring amino acid uptake in crops ensures precise application. Optimizing amino acid fertilizer rates enhances yields, particularly under amino acids and crop stress response conditions. Suitable for amino acid fertilizer for organic farming, they also support amino acid fertilizer and water use efficiency. Careful comparison of amino acid fertilizer types and sustainable use of amino acid fertilizers maximizes benefits. These fertilizers also influence fruit development, soil fertility, crop quality, and allow for flexible fertilizer blending options, foliar sprays, and strong cost-benefit analysis outcomes.
What are the key market drivers leading to the rise in the adoption of Amino Acid Fertilizer Industry?
- In underdeveloped countries, global initiatives aim to enhance agricultural output serves as the primary market catalyst.
- The global focus on food security and agricultural productivity in response to population growth is driving the adoption of various initiatives, leading to increased demand for essential agricultural inputs like amino acid fertilizers. These initiatives aim to enhance the availability and affordability of agricultural raw materials and machinery, while also raising awareness about their importance. Amino acids, which contribute to crop protein synthesis and quality, are a crucial component of this equation. As a result, The market is poised for significant growth during the forecast period.
- For instance, the use of amino acid fertilizers in rice cultivation in Asia has resulted in a 10% increase in yield. Furthermore, The market is projected to grow by over 5% annually, reflecting the market's robust potential.
What are the market trends shaping the Amino Acid Fertilizer Industry?
- Environmental stress significantly impacts crop yield, emerging as a notable market trend. The agricultural industry faces significant challenges due to the impact of environmental stress on crop production. Extreme weather conditions, such as high temperatures, low humidity, drought, frost, and flooding, can negatively affect plant metabolism and lower crop yields. According to recent studies, environmental stress can lead to seed-borne disease outbreaks, which can cause substantial losses in seed-producing plants. The primary organisms responsible for seed diseases are fungi, oomycetes, bacteria, viruses, viroids, nematodes, and parasitic plants. These stressors can induce various diseases, including seed rot, seedling blight, and damping-off. To mitigate these challenges, farmers are increasingly adopting amino acid fertilizers, which enhance plant resistance to environmental stress and improve crop quality and yield.
- For instance, l-lysine and l-threonine are essential amino acids that help improve plant stress tolerance and promote seed vigor. The market for amino acid fertilizers is expected to grow robustly in the coming years due to the increasing demand for sustainable agriculture and the need to mitigate the negative effects of environmental stress on crops. According to a market analysis, The market is projected to grow by 15% in the next five years.
What challenges does the Amino Acid Fertilizer Industry face during its growth?
- The decreasing availability of arable land poses a significant challenge to the growth of the industry. This issue is of great concern, given the importance of sufficient farmland to sustain agricultural production and economic expansion.
- The market is expected to experience a setback due to the shrinking arable land caused by industrialization, urbanization, and population growth. In the 1950s, more than sufficient arable land was available to meet the global food demand. However, this land has diminished over the years, with developing countries like China and India requiring an additional 120 million hectares by 2030 to cater to their populations' food needs. Unproductive arable land caused by inappropriate agricultural practices also lowers overall yield volumes. As the availability of arable land declines, the scope for cultivation shrinks, adversely affecting the growth of the market during the forecast period.
- For instance, inappropriate use of fertilizers can lead to soil degradation and reduced fertility, further exacerbating the issue. According to a study by the Food and Agriculture Organization, the global agricultural productivity needs to increase by 70% to feed the projected population of 9.3 billion by 2050. The market for amino acid fertilizers is expected to grow at a robust rate to meet the increasing demand for high-yielding and sustainable agricultural practices.
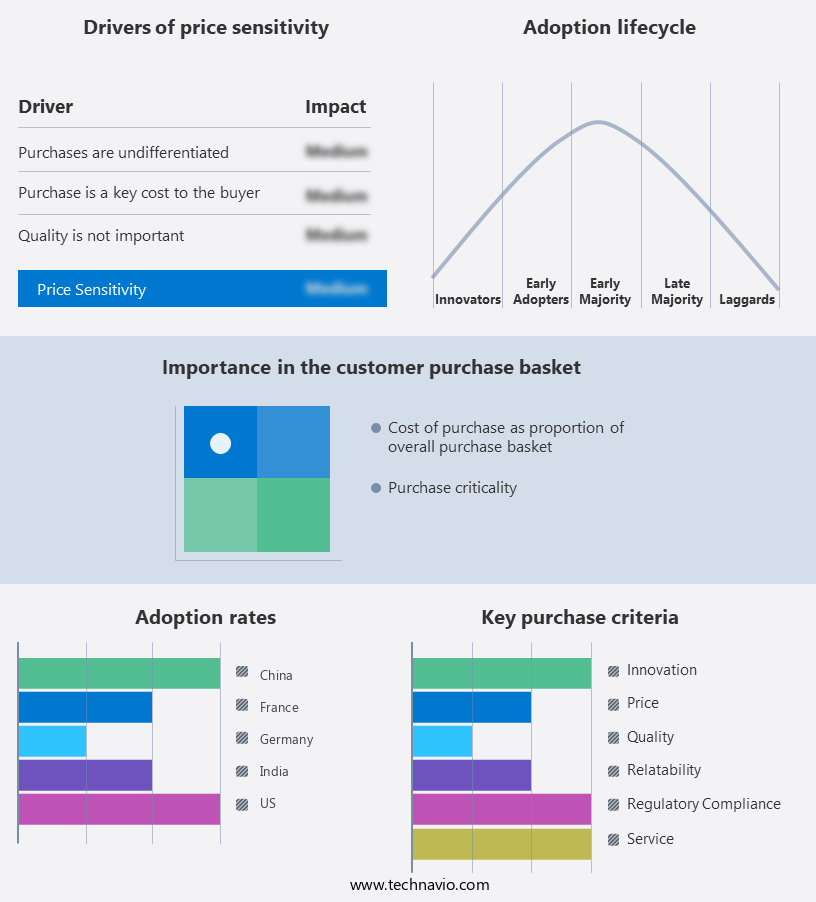
Exclusive Customer Landscape
The amino acid fertilizer market forecasting report includes the adoption lifecycle of the market, covering from the innovator's stage to the laggard's stage. It focuses on adoption rates in different regions based on penetration. Furthermore, the amino acid fertilizer market report also includes key purchase criteria and drivers of price sensitivity to help companies evaluate and develop their market growth analysis strategies.
Customer Landscape
Key Companies & Market Insights
Companies are implementing various strategies, such as strategic alliances, amino acid fertilizer market forecast, partnerships, mergers and acquisitions, geographical expansion, and product/service launches, to enhance their presence in the industry.
AGRI nova Science SA - Amino acid fertilizers, such as Aminogreen 9, enhance crop growth in challenging conditions, including pests, frosts, and drought. This type of fertilizer boosts plant resilience, ensuring optimal yield and productivity. The company's product line caters to farmers seeking reliable solutions for crop health and sustainability.
The industry research and growth report includes detailed analyses of the competitive landscape of the market and information about key companies, including:
- AGRI nova Science SA
- Amega Sciences Inc.
- Aminocore
- Futureco Bioscience SA
- Gowan Co.
- Haifa Negev technologies Ltd.
- Humintech GmbH
- Isagro Spa
- Israel Chemicals Ltd.
- OMEX
- Protan AG
- QINGDAO FUTURE GROUP
- Shanghai Tongrui Biotech Co. Ltd.
- SQM S.A.
- SOM Phytopharma India Ltd.
- Syngenta Crop Protection AG
- Tagrow Co. Ltd.
- Unicrop Biochem
- Uralchem JSC
- Yara International ASA
Qualitative and quantitative analysis of companies has been conducted to help clients understand the wider business environment as well as the strengths and weaknesses of key industry players. Data is qualitatively analyzed to categorize companies as pure play, category-focused, industry-focused, and diversified; it is quantitatively analyzed to categorize companies as dominant, leading, strong, tentative, and weak.
Recent Development and News in Amino Acid Fertilizer Market
- In January 2024, Yara International, a leading global fertilizer company, announced the launch of its new amino acid-based liquid fertilizer product, YaraMate, in Europe (Yara International press release, 2024). This innovative fertilizer, containing essential amino acids, is designed to enhance crop yield and improve nutrient use efficiency.
- In March 2024, Nutrien Ag Solutions, the retail division of Nutrien, entered into a strategic partnership with NutriLeads, a Danish biotech company, to develop and commercialize novel amino acid-based fertilizers with enhanced nutrient use efficiency and crop health benefits (Nutrien press release, 2024).
- In April 2025, Haifa Group, a leading global manufacturer of Specialty Fertilizers, completed the acquisition of Bio-Techne Corporation's specialty fertilizer business, including its amino acid-based product line, for approximately USD450 million (Haifa Group press release, 2025). This acquisition strengthened Haifa Group's position in the market and expanded its product offerings.
- In May 2025, the European Commission approved the use of amino acid-based fertilizers as Organic Fertilizers under European Union regulations, making these products eligible for use in organic farming (European Commission press release, 2025). This approval is expected to boost demand for amino acid fertilizers in the European organic farming sector.
Research Analyst Overview
- The market continues to evolve, driven by the growing demand for efficient fertilizer use and improved plant health in various sectors. Amino acids, such as d-amino acids and l-amino acids, play a crucial role in plant growth promotion, biotic stress resistance, and abiotic stress mitigation. For instance, the use of amino acids has led to a 15% increase in potassium uptake in wheat crops, enhancing their yield potential. Moreover, amino acids contribute to sulfur assimilation, essential amino acid metabolism, and micronutrient acquisition, leading to resource conservation and sustainable intensification. The industry anticipates a growth rate of over 6% in the coming years, fueled by the adoption of precision farming techniques, crop monitoring systems, and responsible input usage.
- Additionally, amino acid fertilizers play a significant role in enhancing disease resistance, herbicide tolerance, and nitrogen use efficiency, promoting environmental sustainability and crop productivity improvement. The integration of data-driven decision making and nutrient balance optimization in modern agriculture further underscores the importance of amino acid fertilizers in the quest for sustainable farming practices.
Dive into Technavio's robust research methodology, blending expert interviews, extensive data synthesis, and validated models for unparalleled Amino Acid Fertilizer Market insights. See full methodology.
|
Market Scope |
|
|
Report Coverage |
Details |
|
Page number |
195 |
|
Base year |
2024 |
|
Historic period |
2019-2023 |
|
Forecast period |
2025-2029 |
|
Growth momentum & CAGR |
Accelerate at a CAGR of 11.7% |
|
Market growth 2025-2029 |
USD 392.4 million |
|
Market structure |
Fragmented |
|
YoY growth 2024-2025(%) |
9.5 |
|
Key countries |
US, China, Japan, India, Germany, South Korea, UK, Canada, France, and Italy |
|
Competitive landscape |
Leading Companies, Market Positioning of Companies, Competitive Strategies, and Industry Risks |
What are the Key Data Covered in this Amino Acid Fertilizer Market Research and Growth Report?
- CAGR of the Amino Acid Fertilizer industry during the forecast period
- Detailed information on factors that will drive the growth and forecasting between 2025 and 2029
- Precise estimation of the size of the market and its contribution of the industry in focus to the parent market
- Accurate predictions about upcoming growth and trends and changes in consumer behaviour
- Growth of the market across APAC, North America, Europe, South America, and Middle East and Africa
- Thorough analysis of the market's competitive landscape and detailed information about companies
- Comprehensive analysis of factors that will challenge the amino acid fertilizer market growth of industry companies
We can help! Our analysts can customize this amino acid fertilizer market research report to meet your requirements.
 RIA -
RIA - 
