Edtech Market Analysis, Size, and Forecast 2026-2030: North America (US, Canada, and Mexico), Europe (Germany, UK, and France), APAC (China, Japan, and India), South America (Brazil and Argentina), Middle East and Africa (Saudi Arabia, UAE, and South Africa), and Rest of World (ROW)

Edtech Market Analysis, Size, and Forecast 2026-2030:
North America (US, Canada, and Mexico), Europe (Germany, UK, and France), APAC (China, Japan, and India), South America (Brazil and Argentina), Middle East and Africa (Saudi Arabia, UAE, and South Africa), and Rest of World (ROW)

Published: Mar 2026 297 Pages SKU: IRTNTR71093

Market Overview at a Glance

$201.06 B
Market Opportunity
16.2%
CAGR 2025 - 2030
37.5%
North America Growth
$64.67 B
Hardware segment 2024

Edtech Market Size 2026-2030

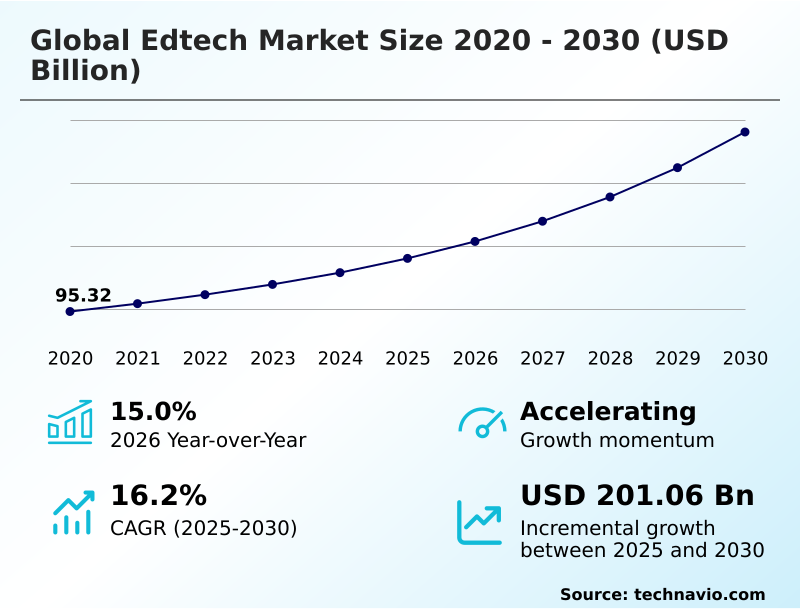
The edtech market size is valued to increase by USD 201.06 billion, at a CAGR of 16.2% from 2025 to 2030. Integration of ML language in technical educational systems will drive the edtech market.

Major Market Trends & Insights

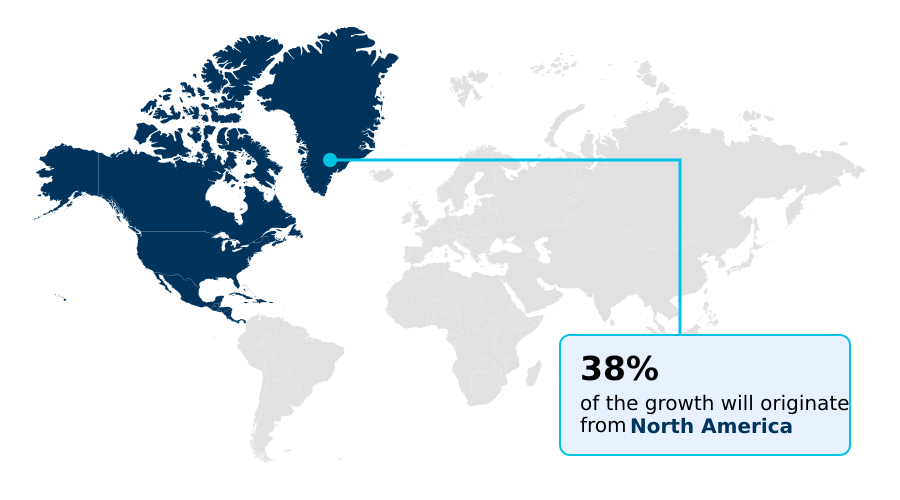
  • North America dominated the market and accounted for a 37.5% growth during the forecast period.
  • By Type - Hardware segment was valued at USD 64.67 billion in 2024
  • By Sector - K-12 segment accounted for the largest market revenue share in 2024

Market Size & Forecast

  • Market Opportunities: USD 285.58 billion
  • Market Future Opportunities: USD 201.06 billion
  • CAGR from 2025 to 2030 : 16.2%

Market Summary

  • The edtech market is fundamentally transforming how knowledge is delivered and acquired, moving beyond traditional classroom structures to create more accessible, personalized, and efficient learning ecosystems. This evolution is propelled by the integration of technologies like machine learning and cloud computing, which enable adaptive learning platforms to tailor content to individual student needs.
  • The rising demand for continuous vocational training and professional upskilling is a major driver, as the modern workforce requires constant skill enhancement. Consequently, professional upskilling platforms are proliferating. Key trends include the adoption of generative AI for hyper-personalized learning and AI-driven content creation, alongside the use of extended reality for immersive simulations in technical fields.
  • For instance, a global manufacturing firm can deploy a corporate e-learning platform using virtual reality in education to train technicians on complex machinery, reducing equipment downtime and improving safety compliance by over 20%. However, the industry faces challenges related to data privacy and the digital divide, which can limit equitable access to these advanced tools.
  • The shift toward skills-based assessment and micro-credentials, often verified using blockchain technology, reflects a move toward more flexible and employment-focused educational pathways.

What will be the Size of the Edtech Market during the forecast period?

Get Key Insights on Market Forecast (PDF) Request Free Sample

How is the Edtech Market Segmented?

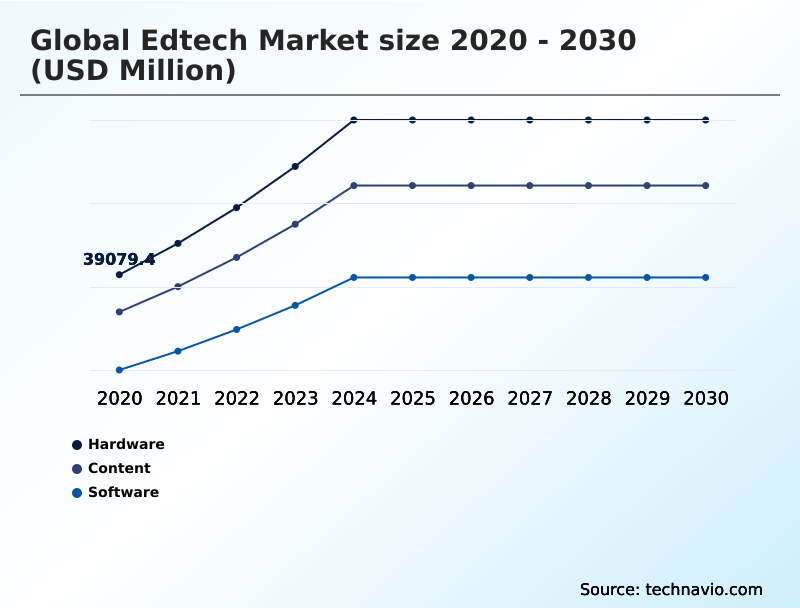
The edtech industry research report provides comprehensive data (region-wise segment analysis), with forecasts and estimates in "USD million" for the period 2026-2030, as well as historical data from 2020-2024 for the following segments.

  • Type
    • Hardware
    • Content
    • Software
  • Sector
    • K-12
    • Higher education
    • Others
  • Deployment
    • Cloud
    • On-premises
  • Geography
    • North America
      • US
      • Canada
      • Mexico
    • Europe
      • Germany
      • UK
      • France
    • APAC
      • China
      • Japan
      • India
    • South America
      • Brazil
      • Argentina
    • Middle East and Africa
      • Saudi Arabia
      • UAE
      • South Africa
    • Rest of World (ROW)

By Type Insights

The hardware segment is estimated to witness significant growth during the forecast period.

The hardware segment provides the physical foundation for the edtech market, encompassing everything from personal devices to interactive displays that facilitate collaborative learning. The growth of smart classroom technology and corporate e-learning platforms is driving demand for specialized hardware.

This includes devices optimized for virtual reality in education, enabling virtual reality training in technical fields.

The expansion of digital infrastructure is critical for supporting mobile learning applications, which now represent over 60% of digital content access points in some emerging markets.

Effective hardware selection and deployment are essential for institutions to deliver high-quality digital experiences and capitalize on software advancements.

Request Free Sample

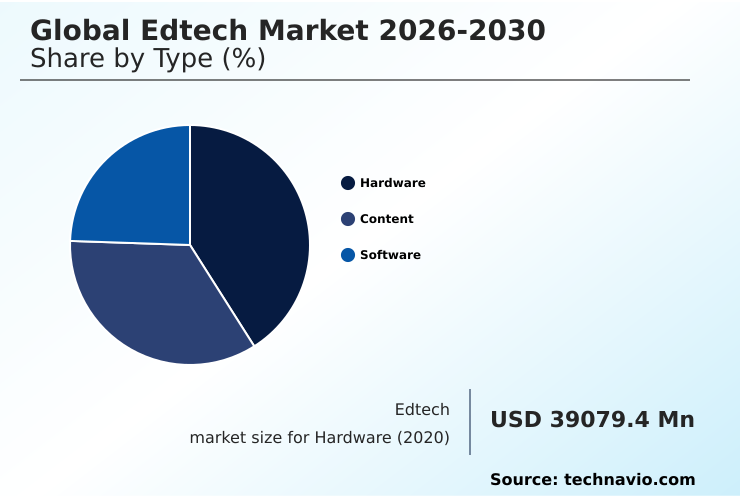
The Hardware segment was valued at USD 64.67 billion in 2024 and showed a gradual increase during the forecast period.

Request Free Sample

Regional Analysis

North America is estimated to contribute 37.5% to the growth of the global market during the forecast period.Technavio’s analysts have elaborately explained the regional trends and drivers that shape the market during the forecast period.

See How Edtech Market Demand is Rising in North America Request Free Sample

The geographic landscape of the edtech market is characterized by varied adoption rates and investment priorities. North America remains a dominant market, with a mature ecosystem focused on advanced applications like predictive analytics to improve student outcomes.

In contrast, the APAC region is the fastest-growing market, driven by mobile-first adoption and government initiatives supporting K-12 digital curriculum solutions.

The implementation of online assessment tools and student performance dashboards is becoming standard in European universities to support online degree program management.

Across all regions, the use of adaptive learning and generative AI is a key focus, though deployment is often limited by infrastructure readiness.

North America contributes over 37% of the incremental growth, while APAC's market is expanding at a CAGR of 17.7%.

Market Dynamics

Our researchers analyzed the data with 2025 as the base year, along with the key drivers, trends, and challenges. A holistic analysis of drivers will help companies refine their marketing strategies to gain a competitive advantage.

  • The future of the edtech market is being defined by the sophisticated application of technology to solve specific educational challenges. The use of generative AI for personalized learning paths is revolutionizing instruction by creating truly individualized curricula, with platforms using AI-powered adaptive learning software for math showing the potential to improve student scores by up to two grade levels.
  • However, this increased reliance on data-driven systems amplifies cybersecurity risks in K-12 school districts, making robust protocols for integrating LMS with student information systems non-negotiable. In the professional realm, there is a clear shift toward recognizing granular skills, highlighting the benefits of micro-credentials in corporate training.
  • The integrity of these credentials is paramount, which is where blockchain for verifying academic credentials provides a tamper-proof solution. Simultaneously, the impact of extended reality on medical education is profound, allowing for risk-free surgical practice in virtual environments.
  • This demand for high-fidelity simulations forces a critical decision between the scalability of cloud computing vs on-premise edtech solutions, as institutions balance performance needs with the total cost of ownership for educational technology.
  • Furthermore, using AI to bridge the student skills gap and addressing the challenges of the digital divide in remote learning remain central to ensuring equitable access and opportunity for all learners.

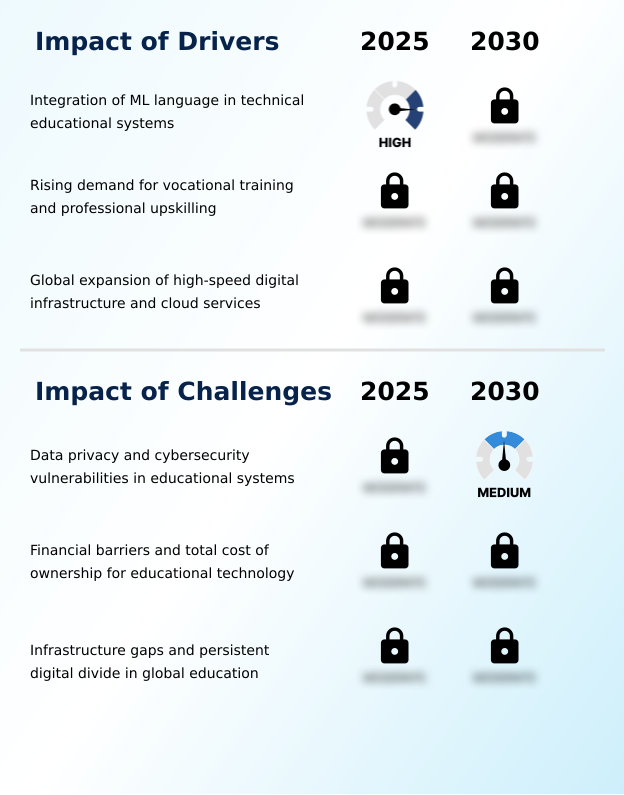
What are the key market drivers leading to the rise in the adoption of Edtech Industry?

  • The integration of machine learning language within technical educational systems serves as a key driver for market growth.

  • Key drivers are reshaping how educational content is delivered and consumed, with machine learning at the forefront of this transformation.
  • The demand for industry-aligned skills fuels the growth of professional upskilling platforms that offer specialized vocational training, with some platforms reporting a 30% faster time-to-competency for learners.
  • This is enabled by cloud-based learning management systems that provide scalable and flexible access to resources. Cloud computing also supports the deployment of AI-powered tutoring systems and AI-driven content creation, which helps in developing personalized learning path software.
  • Furthermore, the integration of gamification elements has proven to increase learner engagement by as much as 50%, making learning more interactive and effective.

What are the market trends shaping the Edtech Industry?

  • The integration of generative AI represents an emerging market trend. This technology enables the delivery of hyper-personalized learning experiences.

  • Market trends are shifting toward more individualized and verifiable learning pathways. The adoption of extended reality is creating new opportunities for immersive simulations, particularly in hands-on training where it can reduce errors by up to 40%. Concurrently, AI in education platforms are enabling hyper-personalized learning at scale, moving beyond one-size-fits-all instruction.
  • This is complemented by a growing focus on competency-based learning models and the use of micro-credentials for targeted skill development. To ensure the integrity of these achievements, blockchain technology is being implemented for digital credential verification, providing a secure and transparent record. These trends are reshaping blended learning environments and defining the future of education delivery.

What challenges does the Edtech Industry face during its growth?

  • Data privacy concerns and cybersecurity vulnerabilities within educational systems present a key challenge to industry growth.

  • The rapid digitalization of education introduces significant operational challenges, primarily centered on data privacy and cybersecurity vulnerabilities. Institutions must implement robust student data protection policies as they manage vast amounts of sensitive information across the learning management system and student information system. The increasing reliance on remote learning technologies expands the potential attack surface, making security a paramount concern.
  • Integrating education data analytics with higher education ERP systems requires careful management to prevent data breaches. Failure to secure these systems can undermine trust and lead to regulatory non-compliance, with some institutions dedicating over 15% of their IT budgets to mitigating these risks.

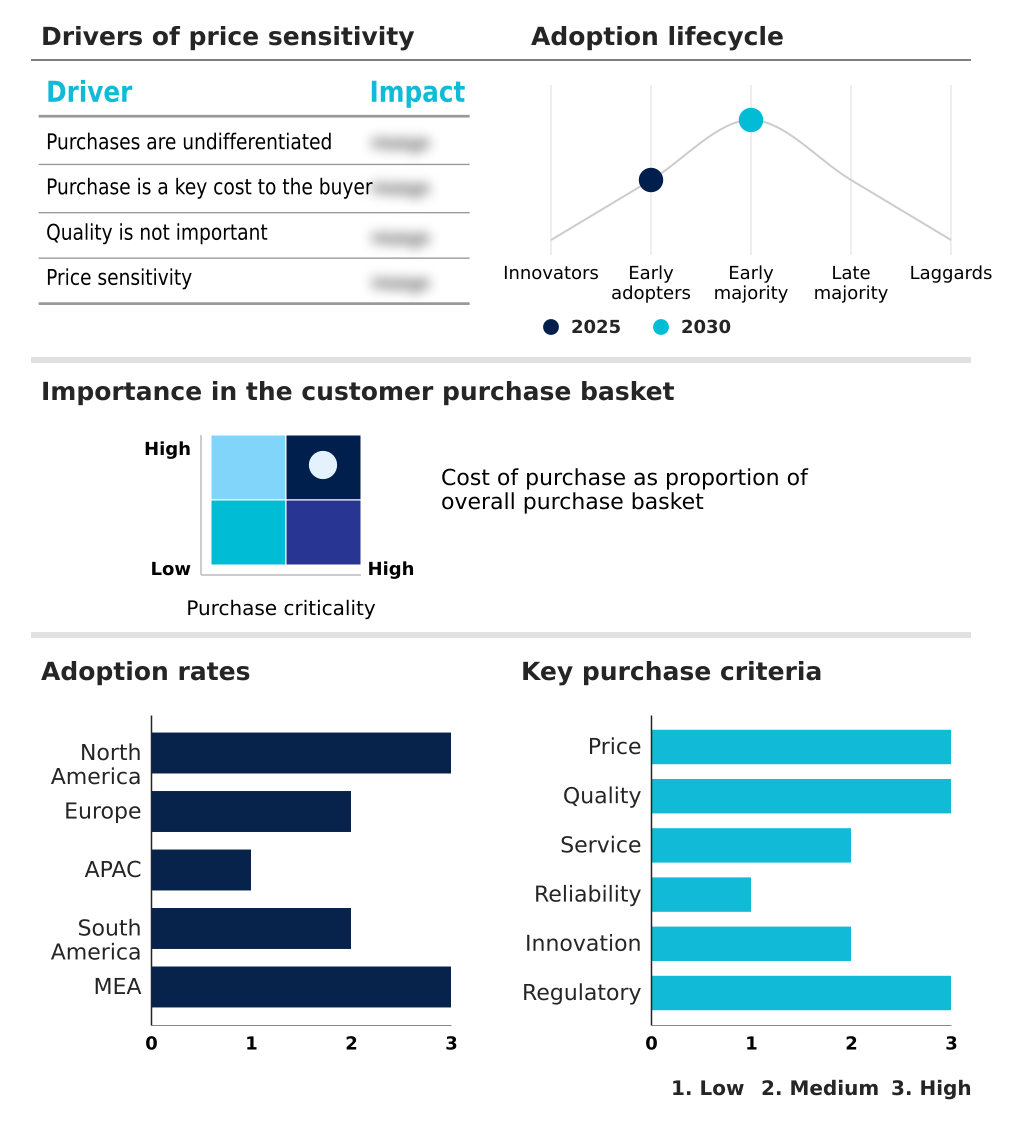
Exclusive Technavio Analysis on Customer Landscape

The edtech market forecasting report includes the adoption lifecycle of the market, covering from the innovator’s stage to the laggard’s stage. It focuses on adoption rates in different regions based on penetration. Furthermore, the edtech market report also includes key purchase criteria and drivers of price sensitivity to help companies evaluate and develop their market growth analysis strategies.

Customer Landscape of Edtech Industry

Competitive Landscape

Companies are implementing various strategies, such as strategic alliances, edtech market forecast, partnerships, mergers and acquisitions, geographical expansion, and product/service launches, to enhance their presence in the industry.

2U Inc. - Delivering integrated digital platforms and software that manage and enhance education across academic, corporate, and lifelong learning environments.

The industry research and growth report includes detailed analyses of the competitive landscape of the market and information about key companies, including:

  • 2U Inc.
  • Anthology Inc.
  • Chegg Inc.
  • Cornerstone OnDemand Inc.
  • Coursera Inc.
  • D2L Corp.
  • Discovery Education Inc.
  • edX LLC
  • Ellucian Co.
  • Google LLC
  • Instructure Holdings Inc.
  • Microsoft Corp.
  • Oracle Corp.
  • PleIQ Smart Toys Spa
  • Promethean World Ltd.
  • Think and Learn Pvt. Ltd.
  • Udacity Inc.
  • UOL EdTech
  • upGrad Education Pvt. Ltd.
  • Workday Inc.

Qualitative and quantitative analysis of companies has been conducted to help clients understand the wider business environment as well as the strengths and weaknesses of key industry players. Data is qualitatively analyzed to categorize companies as pure play, category-focused, industry-focused, and diversified; it is quantitatively analyzed to categorize companies as dominant, leading, strong, tentative, and weak.

Recent Development and News in Edtech market

  • In August 2024, Skillsoft introduced a new platform for leadership training that uses interactive simulations to teach management skills to employees in the corporate sector.
  • In October 2024, Udacity launched a specialized program for automotive software engineering to address the shortage of skilled workers in the electric vehicle industry.
  • In March 2025, OpenAI launched a dedicated educational initiative that provides large language model access to universities for the purpose of developing personalized tutoring bots.
  • In May 2025, Meta Platforms announced a partnership with educational institutions in Europe to deploy thousands of quest headsets for use in science and history classes.

Dive into Technavio’s robust research methodology, blending expert interviews, extensive data synthesis, and validated models for unparalleled Edtech Market insights. See full methodology.

Market Scope
Page number 297
Base year 2025
Historic period 2020-2024
Forecast period 2026-2030
Growth momentum & CAGR Accelerate at a CAGR of 16.2%
Market growth 2026-2030 USD 201057.4 million
Market structure Fragmented
YoY growth 2025-2026(%) 15.0%
Key countries US, Canada, Mexico, Germany, UK, France, Italy, Spain, The Netherlands, China, Japan, India, South Korea, Australia, Indonesia, Brazil, Argentina, Chile, Saudi Arabia, UAE, South Africa, Israel and Turkey
Competitive landscape Leading Companies, Market Positioning of Companies, Competitive Strategies, and Industry Risks

Request Free Sample

Research Analyst Overview

  • From an analyst perspective, the edtech market is undergoing a strategic pivot from simple content digitization to the creation of intelligent learning ecosystems. The integration of machine learning and generative AI is no longer a niche feature but a core component of competitive platforms, enabling hyper-personalized learning and adaptive learning at an unprecedented scale.
  • Boardroom decisions are now centered on leveraging data analytics from the learning management system and student information system to drive retention and operational efficiency. The adoption of extended reality for immersive simulations and virtual reality training offers a clear return on investment, particularly in vocational training.
  • Platforms that incorporate gamification elements are demonstrating a 40% increase in user completion rates, validating their effectiveness. The market is also moving toward verifiable outcomes through skills-based assessment and micro-credentials, with blockchain technology ensuring the integrity of this digital curriculum.
  • Looking ahead, success will depend on addressing cybersecurity vulnerabilities and ensuring robust digital infrastructure to support these advanced mobile learning applications and AI-powered tutoring systems.

What are the Key Data Covered in this Edtech Market Research and Growth Report?

  • What is the expected growth of the Edtech Market between 2026 and 2030?

    • USD 201.06 billion, at a CAGR of 16.2%

  • What segmentation does the market report cover?

    • The report is segmented by Type (Hardware, Content, and Software), Sector (K-12, Higher education, and Others), Deployment (Cloud, and On-premises) and Geography (North America, Europe, APAC, South America, Middle East and Africa)

  • Which regions are analyzed in the report?

    • North America, Europe, APAC, South America and Middle East and Africa

  • What are the key growth drivers and market challenges?

    • Integration of ML language in technical educational systems, Data privacy and cybersecurity vulnerabilities in educational systems

  • Who are the major players in the Edtech Market?

    • 2U Inc., Anthology Inc., Chegg Inc., Cornerstone OnDemand Inc., Coursera Inc., D2L Corp., Discovery Education Inc., edX LLC, Ellucian Co., Google LLC, Instructure Holdings Inc., Microsoft Corp., Oracle Corp., PleIQ Smart Toys Spa, Promethean World Ltd., Think and Learn Pvt. Ltd., Udacity Inc., UOL EdTech, upGrad Education Pvt. Ltd. and Workday Inc.

Market Research Insights

  • The edtech market's dynamics are increasingly shaped by the demand for data-driven, skill-focused educational outcomes. AI in education platforms are at the core of this shift, with institutions using student performance dashboards reporting up to a 15% improvement in student retention rates.
  • The move toward competency-based learning models is supported by online assessment tools that offer more flexible and accurate evaluations of learner skills. In the corporate sector, the adoption of corporate e-learning platforms has been shown to reduce employee onboarding time by over 30% compared to traditional methods.
  • Blended learning environments are becoming standard, combining the best of in-person and digital instruction. The focus is on creating integrated ecosystems where cloud-based learning management and higher education ERP systems work seamlessly to provide a holistic view of the learner's journey.

We can help! Our analysts can customize this edtech market research report to meet your requirements.

Get in touch

1. Executive Summary

1.1 Market overview

Executive Summary - Chart on Market Overview
Executive Summary - Data Table on Market Overview
Executive Summary - Chart on Global Market Characteristics
Executive Summary - Chart on Market by Geography
Executive Summary - Chart on Market Segmentation by Type
Executive Summary - Chart on Market Segmentation by Sector
Executive Summary - Chart on Market Segmentation by Deployment
Executive Summary - Chart on Incremental Growth
Executive Summary - Data Table on Incremental Growth
Executive Summary - Chart on Company Market Positioning

2. Technavio Analysis

2.1 Analysis of price sensitivity, lifecycle, customer purchase basket, adoption rates, and purchase criteria

2.2 Criticality of inputs and Factors of differentiation

Chart on Overview on criticality of inputs and factors of differentiation

2.3 Factors of disruption

Chart on Overview on factors of disruption

2.4 Impact of drivers and challenges

Chart on Impact of drivers and challenges in 2025 and 2030

3. Market Landscape

3.1 Market ecosystem

Chart on Parent Market
Data Table on - Parent Market

3.2 Market characteristics

Chart on Market characteristics analysis

3.3 Value chain analysis

Chart on Value chain analysis

4. Market Sizing

4.1 Market definition

Data Table on Offerings of companies included in the market definition

4.2 Market segment analysis

Market segments

4.3 Market size 2025

4.4 Market outlook: Forecast for 2025-2030

Chart on Global - Market size and forecast 2025-2030 ($ million)
Data Table on Global - Market size and forecast 2025-2030 ($ million)
Chart on Global Market: Year-over-year growth 2025-2030 (%)
Data Table on Global Market: Year-over-year growth 2025-2030 (%)

5. Historic Market Size

5.1 Global Edtech Market 2020 - 2024

Historic Market Size - Data Table on Global Edtech Market 2020 - 2024 ($ million)

5.2 Type segment analysis 2020 - 2024

Historic Market Size - Type Segment 2020 - 2024 ($ million)

5.3 Sector segment analysis 2020 - 2024

Historic Market Size - Sector Segment 2020 - 2024 ($ million)

5.4 Deployment segment analysis 2020 - 2024

Historic Market Size - Deployment Segment 2020 - 2024 ($ million)

5.5 Geography segment analysis 2020 - 2024

Historic Market Size - Geography Segment 2020 - 2024 ($ million)

5.6 Country segment analysis 2020 - 2024

Historic Market Size - Country Segment 2020 - 2024 ($ million)

6. Qualitative Analysis

6.1 Impact of AI on Global Edtech Market

7. Five Forces Analysis

7.1 Five forces summary

Five forces analysis - Comparison between 2025 and 2030

7.2 Bargaining power of buyers

Bargaining power of buyers - Impact of key factors 2025 and 2030

7.3 Bargaining power of suppliers

Bargaining power of suppliers - Impact of key factors in 2025 and 2030

7.4 Threat of new entrants

Threat of new entrants - Impact of key factors in 2025 and 2030

7.5 Threat of substitutes

Threat of substitutes - Impact of key factors in 2025 and 2030

7.6 Threat of rivalry

Threat of rivalry - Impact of key factors in 2025 and 2030

7.7 Market condition

Chart on Market condition - Five forces 2025 and 2030

8. Market Segmentation by Type

8.1 Market segments

Chart on Type - Market share 2025-2030 (%)
Data Table on Type - Market share 2025-2030 (%)

8.2 Comparison by Type

Chart on Comparison by Type
Data Table on Comparison by Type

8.3 Hardware - Market size and forecast 2025-2030

Chart on Hardware - Market size and forecast 2025-2030 ($ million)
Data Table on Hardware - Market size and forecast 2025-2030 ($ million)
Chart on Hardware - Year-over-year growth 2025-2030 (%)
Data Table on Hardware - Year-over-year growth 2025-2030 (%)

8.4 Content - Market size and forecast 2025-2030

Chart on Content - Market size and forecast 2025-2030 ($ million)
Data Table on Content - Market size and forecast 2025-2030 ($ million)
Chart on Content - Year-over-year growth 2025-2030 (%)
Data Table on Content - Year-over-year growth 2025-2030 (%)

8.5 Software - Market size and forecast 2025-2030

Chart on Software - Market size and forecast 2025-2030 ($ million)
Data Table on Software - Market size and forecast 2025-2030 ($ million)
Chart on Software - Year-over-year growth 2025-2030 (%)
Data Table on Software - Year-over-year growth 2025-2030 (%)

8.6 Market opportunity by Type

Market opportunity by Type ($ million)
Data Table on Market opportunity by Type ($ million)

9. Market Segmentation by Sector

9.1 Market segments

Chart on Sector - Market share 2025-2030 (%)
Data Table on Sector - Market share 2025-2030 (%)

9.2 Comparison by Sector

Chart on Comparison by Sector
Data Table on Comparison by Sector

9.3 K-12 - Market size and forecast 2025-2030

Chart on K-12 - Market size and forecast 2025-2030 ($ million)
Data Table on K-12 - Market size and forecast 2025-2030 ($ million)
Chart on K-12 - Year-over-year growth 2025-2030 (%)
Data Table on K-12 - Year-over-year growth 2025-2030 (%)

9.4 Higher education - Market size and forecast 2025-2030

Chart on Higher education - Market size and forecast 2025-2030 ($ million)
Data Table on Higher education - Market size and forecast 2025-2030 ($ million)
Chart on Higher education - Year-over-year growth 2025-2030 (%)
Data Table on Higher education - Year-over-year growth 2025-2030 (%)

9.5 Others - Market size and forecast 2025-2030

Chart on Others - Market size and forecast 2025-2030 ($ million)
Data Table on Others - Market size and forecast 2025-2030 ($ million)
Chart on Others - Year-over-year growth 2025-2030 (%)
Data Table on Others - Year-over-year growth 2025-2030 (%)

9.6 Market opportunity by Sector

Market opportunity by Sector ($ million)
Data Table on Market opportunity by Sector ($ million)

10. Market Segmentation by Deployment

10.1 Market segments

Chart on Deployment - Market share 2025-2030 (%)
Data Table on Deployment - Market share 2025-2030 (%)

10.2 Comparison by Deployment

Chart on Comparison by Deployment
Data Table on Comparison by Deployment

10.3 Cloud - Market size and forecast 2025-2030

Chart on Cloud - Market size and forecast 2025-2030 ($ million)
Data Table on Cloud - Market size and forecast 2025-2030 ($ million)
Chart on Cloud - Year-over-year growth 2025-2030 (%)
Data Table on Cloud - Year-over-year growth 2025-2030 (%)

10.4 On-premises - Market size and forecast 2025-2030

Chart on On-premises - Market size and forecast 2025-2030 ($ million)
Data Table on On-premises - Market size and forecast 2025-2030 ($ million)
Chart on On-premises - Year-over-year growth 2025-2030 (%)
Data Table on On-premises - Year-over-year growth 2025-2030 (%)

10.5 Market opportunity by Deployment

Market opportunity by Deployment ($ million)
Data Table on Market opportunity by Deployment ($ million)

11. Customer Landscape

11.1 Customer landscape overview

Analysis of price sensitivity, lifecycle, customer purchase basket, adoption rates, and purchase criteria

12. Geographic Landscape

12.1 Geographic segmentation

Chart on Market share by geography 2025-2030 (%)
Data Table on Market share by geography 2025-2030 (%)

12.2 Geographic comparison

Chart on Geographic comparison
Data Table on Geographic comparison

12.3 North America - Market size and forecast 2025-2030

Chart on North America - Market size and forecast 2025-2030 ($ million)
Data Table on North America - Market size and forecast 2025-2030 ($ million)
Chart on North America - Year-over-year growth 2025-2030 (%)
Data Table on North America - Year-over-year growth 2025-2030 (%)
Chart on Regional Comparison - North America
Data Table on Regional Comparison - North America

12.3.1 US - Market size and forecast 2025-2030

Chart on US - Market size and forecast 2025-2030 ($ million)
Data Table on US - Market size and forecast 2025-2030 ($ million)
Chart on US - Year-over-year growth 2025-2030 (%)
Data Table on US - Year-over-year growth 2025-2030 (%)

12.3.2 Canada - Market size and forecast 2025-2030

Chart on Canada - Market size and forecast 2025-2030 ($ million)
Data Table on Canada - Market size and forecast 2025-2030 ($ million)
Chart on Canada - Year-over-year growth 2025-2030 (%)
Data Table on Canada - Year-over-year growth 2025-2030 (%)

12.3.3 Mexico - Market size and forecast 2025-2030

Chart on Mexico - Market size and forecast 2025-2030 ($ million)
Data Table on Mexico - Market size and forecast 2025-2030 ($ million)
Chart on Mexico - Year-over-year growth 2025-2030 (%)
Data Table on Mexico - Year-over-year growth 2025-2030 (%)

12.4 Europe - Market size and forecast 2025-2030

Chart on Europe - Market size and forecast 2025-2030 ($ million)
Data Table on Europe - Market size and forecast 2025-2030 ($ million)
Chart on Europe - Year-over-year growth 2025-2030 (%)
Data Table on Europe - Year-over-year growth 2025-2030 (%)
Chart on Regional Comparison - Europe
Data Table on Regional Comparison - Europe

12.4.1 Germany - Market size and forecast 2025-2030

Chart on Germany - Market size and forecast 2025-2030 ($ million)
Data Table on Germany - Market size and forecast 2025-2030 ($ million)
Chart on Germany - Year-over-year growth 2025-2030 (%)
Data Table on Germany - Year-over-year growth 2025-2030 (%)

12.4.2 UK - Market size and forecast 2025-2030

Chart on UK - Market size and forecast 2025-2030 ($ million)
Data Table on UK - Market size and forecast 2025-2030 ($ million)
Chart on UK - Year-over-year growth 2025-2030 (%)
Data Table on UK - Year-over-year growth 2025-2030 (%)

12.4.3 France - Market size and forecast 2025-2030

Chart on France - Market size and forecast 2025-2030 ($ million)
Data Table on France - Market size and forecast 2025-2030 ($ million)
Chart on France - Year-over-year growth 2025-2030 (%)
Data Table on France - Year-over-year growth 2025-2030 (%)

12.4.4 Italy - Market size and forecast 2025-2030

Chart on Italy - Market size and forecast 2025-2030 ($ million)
Data Table on Italy - Market size and forecast 2025-2030 ($ million)
Chart on Italy - Year-over-year growth 2025-2030 (%)
Data Table on Italy - Year-over-year growth 2025-2030 (%)

12.4.5 Spain - Market size and forecast 2025-2030

Chart on Spain - Market size and forecast 2025-2030 ($ million)
Data Table on Spain - Market size and forecast 2025-2030 ($ million)
Chart on Spain - Year-over-year growth 2025-2030 (%)
Data Table on Spain - Year-over-year growth 2025-2030 (%)

12.4.6 The Netherlands - Market size and forecast 2025-2030

Chart on The Netherlands - Market size and forecast 2025-2030 ($ million)
Data Table on The Netherlands - Market size and forecast 2025-2030 ($ million)
Chart on The Netherlands - Year-over-year growth 2025-2030 (%)
Data Table on The Netherlands - Year-over-year growth 2025-2030 (%)

12.5 APAC - Market size and forecast 2025-2030

Chart on APAC - Market size and forecast 2025-2030 ($ million)
Data Table on APAC - Market size and forecast 2025-2030 ($ million)
Chart on APAC - Year-over-year growth 2025-2030 (%)
Data Table on APAC - Year-over-year growth 2025-2030 (%)
Chart on Regional Comparison - APAC
Data Table on Regional Comparison - APAC

12.5.1 China - Market size and forecast 2025-2030

Chart on China - Market size and forecast 2025-2030 ($ million)
Data Table on China - Market size and forecast 2025-2030 ($ million)
Chart on China - Year-over-year growth 2025-2030 (%)
Data Table on China - Year-over-year growth 2025-2030 (%)

12.5.2 Japan - Market size and forecast 2025-2030

Chart on Japan - Market size and forecast 2025-2030 ($ million)
Data Table on Japan - Market size and forecast 2025-2030 ($ million)
Chart on Japan - Year-over-year growth 2025-2030 (%)
Data Table on Japan - Year-over-year growth 2025-2030 (%)

12.5.3 India - Market size and forecast 2025-2030

Chart on India - Market size and forecast 2025-2030 ($ million)
Data Table on India - Market size and forecast 2025-2030 ($ million)
Chart on India - Year-over-year growth 2025-2030 (%)
Data Table on India - Year-over-year growth 2025-2030 (%)

12.5.4 South Korea - Market size and forecast 2025-2030

Chart on South Korea - Market size and forecast 2025-2030 ($ million)
Data Table on South Korea - Market size and forecast 2025-2030 ($ million)
Chart on South Korea - Year-over-year growth 2025-2030 (%)
Data Table on South Korea - Year-over-year growth 2025-2030 (%)

12.5.5 Australia - Market size and forecast 2025-2030

Chart on Australia - Market size and forecast 2025-2030 ($ million)
Data Table on Australia - Market size and forecast 2025-2030 ($ million)
Chart on Australia - Year-over-year growth 2025-2030 (%)
Data Table on Australia - Year-over-year growth 2025-2030 (%)

12.5.6 Indonesia - Market size and forecast 2025-2030

Chart on Indonesia - Market size and forecast 2025-2030 ($ million)
Data Table on Indonesia - Market size and forecast 2025-2030 ($ million)
Chart on Indonesia - Year-over-year growth 2025-2030 (%)
Data Table on Indonesia - Year-over-year growth 2025-2030 (%)

12.6 South America - Market size and forecast 2025-2030

Chart on South America - Market size and forecast 2025-2030 ($ million)
Data Table on South America - Market size and forecast 2025-2030 ($ million)
Chart on South America - Year-over-year growth 2025-2030 (%)
Data Table on South America - Year-over-year growth 2025-2030 (%)
Chart on Regional Comparison - South America
Data Table on Regional Comparison - South America

12.6.1 Brazil - Market size and forecast 2025-2030

Chart on Brazil - Market size and forecast 2025-2030 ($ million)
Data Table on Brazil - Market size and forecast 2025-2030 ($ million)
Chart on Brazil - Year-over-year growth 2025-2030 (%)
Data Table on Brazil - Year-over-year growth 2025-2030 (%)

12.6.2 Argentina - Market size and forecast 2025-2030

Chart on Argentina - Market size and forecast 2025-2030 ($ million)
Data Table on Argentina - Market size and forecast 2025-2030 ($ million)
Chart on Argentina - Year-over-year growth 2025-2030 (%)
Data Table on Argentina - Year-over-year growth 2025-2030 (%)

12.6.3 Chile - Market size and forecast 2025-2030

Chart on Chile - Market size and forecast 2025-2030 ($ million)
Data Table on Chile - Market size and forecast 2025-2030 ($ million)
Chart on Chile - Year-over-year growth 2025-2030 (%)
Data Table on Chile - Year-over-year growth 2025-2030 (%)

12.7 Middle East and Africa - Market size and forecast 2025-2030

Chart on Middle East and Africa - Market size and forecast 2025-2030 ($ million)
Data Table on Middle East and Africa - Market size and forecast 2025-2030 ($ million)
Chart on Middle East and Africa - Year-over-year growth 2025-2030 (%)
Data Table on Middle East and Africa - Year-over-year growth 2025-2030 (%)
Chart on Regional Comparison - Middle East and Africa
Data Table on Regional Comparison - Middle East and Africa

12.7.1 Saudi Arabia - Market size and forecast 2025-2030

Chart on Saudi Arabia - Market size and forecast 2025-2030 ($ million)
Data Table on Saudi Arabia - Market size and forecast 2025-2030 ($ million)
Chart on Saudi Arabia - Year-over-year growth 2025-2030 (%)
Data Table on Saudi Arabia - Year-over-year growth 2025-2030 (%)

12.7.2 UAE - Market size and forecast 2025-2030

Chart on UAE - Market size and forecast 2025-2030 ($ million)
Data Table on UAE - Market size and forecast 2025-2030 ($ million)
Chart on UAE - Year-over-year growth 2025-2030 (%)
Data Table on UAE - Year-over-year growth 2025-2030 (%)

12.7.3 South Africa - Market size and forecast 2025-2030

Chart on South Africa - Market size and forecast 2025-2030 ($ million)
Data Table on South Africa - Market size and forecast 2025-2030 ($ million)
Chart on South Africa - Year-over-year growth 2025-2030 (%)
Data Table on South Africa - Year-over-year growth 2025-2030 (%)

12.7.4 Israel - Market size and forecast 2025-2030

Chart on Israel - Market size and forecast 2025-2030 ($ million)
Data Table on Israel - Market size and forecast 2025-2030 ($ million)
Chart on Israel - Year-over-year growth 2025-2030 (%)
Data Table on Israel - Year-over-year growth 2025-2030 (%)

12.7.5 Turkey - Market size and forecast 2025-2030

Chart on Turkey - Market size and forecast 2025-2030 ($ million)
Data Table on Turkey - Market size and forecast 2025-2030 ($ million)
Chart on Turkey - Year-over-year growth 2025-2030 (%)
Data Table on Turkey - Year-over-year growth 2025-2030 (%)

12.8 Market opportunity by geography

Market opportunity by geography ($ million)
Data Tables on Market opportunity by geography ($ million)

13. Drivers, Challenges, and Opportunity

13.1 Market drivers

Integration of ML language in technical educational systems
Rising demand for vocational training and professional upskilling
Global expansion of high-speed digital infrastructure and cloud services

13.2 Market challenges

Data privacy and cybersecurity vulnerabilities in educational systems
Financial barriers and total cost of ownership for educational technology
Infrastructure gaps and persistent digital divide in global education

13.3 Impact of drivers and challenges

Impact of drivers and challenges in 2025 and 2030

13.4 Market opportunities

Integration of generative AI for hyper personalized learning
Growing extended reality and immersive simulations in technical education
Shift toward micro credentials and skills-based assessment

14. Competitive Landscape

14.1 Overview

14.2

Overview on criticality of inputs and factors of differentiation

14.3 Landscape disruption

Overview on factors of disruption

14.4 Industry risks

Impact of key risks on business

15. Competitive Analysis

15.1 Companies profiled

Companies covered

15.2 Company ranking index

15.3 Market positioning of companies

Matrix on companies position and classification

15.4 2U Inc.

2U Inc. - Overview
2U Inc. - Product / Service
2U Inc. - Key offerings
SWOT

15.5 Anthology Inc.

Anthology Inc. - Overview
Anthology Inc. - Product / Service
Anthology Inc. - Key news
Anthology Inc. - Key offerings
SWOT

15.6 Chegg Inc.

Chegg Inc. - Overview
Chegg Inc. - Product / Service
Chegg Inc. - Key news
Chegg Inc. - Key offerings
SWOT

15.7 Cornerstone OnDemand Inc.

Cornerstone OnDemand Inc. - Overview
Cornerstone OnDemand Inc. - Product / Service
Cornerstone OnDemand Inc. - Key news
Cornerstone OnDemand Inc. - Key offerings
SWOT

15.8 Coursera Inc.

Coursera Inc. - Overview
Coursera Inc. - Business segments
Coursera Inc. - Key news
Coursera Inc. - Key offerings
Coursera Inc. - Segment focus
SWOT

15.9 D2L Corp.

D2L Corp. - Overview
D2L Corp. - Product / Service
D2L Corp. - Key news
D2L Corp. - Key offerings
SWOT

15.10 Discovery Education Inc.

Discovery Education Inc. - Overview
Discovery Education Inc. - Product / Service
Discovery Education Inc. - Key offerings
SWOT

15.11 edX LLC

edX LLC - Overview
edX LLC - Product / Service
edX LLC - Key offerings
SWOT

15.12 Ellucian Co.

Ellucian Co. - Overview
Ellucian Co. - Product / Service
Ellucian Co. - Key offerings
SWOT

15.13 Google LLC

Google LLC - Overview
Google LLC - Product / Service
Google LLC - Key offerings
SWOT

15.14 Microsoft Corp.

Microsoft Corp. - Overview
Microsoft Corp. - Business segments
Microsoft Corp. - Key news
Microsoft Corp. - Key offerings
Microsoft Corp. - Segment focus
SWOT

15.15 Oracle Corp.

Oracle Corp. - Overview
Oracle Corp. - Business segments
Oracle Corp. - Key news
Oracle Corp. - Key offerings
Oracle Corp. - Segment focus
SWOT

15.16 Think and Learn Pvt. Ltd.

Think and Learn Pvt. Ltd. - Overview
Think and Learn Pvt. Ltd. - Product / Service
Think and Learn Pvt. Ltd. - Key offerings
SWOT

15.17 upGrad Education Pvt. Ltd.

upGrad Education Pvt. Ltd. - Overview
upGrad Education Pvt. Ltd. - Product / Service
upGrad Education Pvt. Ltd. - Key offerings
SWOT

15.18 Workday Inc.

Workday Inc. - Overview
Workday Inc. - Product / Service
Workday Inc. - Key news
Workday Inc. - Key offerings
SWOT

16. Appendix

16.1 Scope of the report

Market definition
Objectives
Notes and caveats

16.2 Inclusions and exclusions checklist

Inclusions checklist
Exclusions checklist

16.3 Currency conversion rates for US$

16.4 Research methodology

16.5 Data procurement

Information sources

16.6 Data validation

16.7 Validation techniques employed for market sizing

16.8 Data synthesis

16.9 360 degree market analysis

16.10 List of abbreviations

Research Methodology

Technavio presents a detailed picture of the market by way of study, synthesis, and summation of data from multiple sources. The analysts have presented the various facets of the market with a particular focus on identifying the key industry influencers. The data thus presented is comprehensive, reliable, and the result of extensive research, both primary and secondary.

INFORMATION SOURCES

Primary sources

  • Manufacturers and suppliers
  • Channel partners
  • Industry experts
  • Strategic decision makers

Secondary sources

  • Industry journals and periodicals
  • Government data
  • Financial reports of key industry players
  • Historical data
  • Press releases

DATA ANALYSIS

Data Synthesis

  • Collation of data
  • Estimation of key figures
  • Analysis of derived insights

Data Validation

  • Triangulation with data models
  • Reference against proprietary databases
  • Corroboration with industry experts

REPORT WRITING

Qualitative

  • Market drivers
  • Market challenges
  • Market trends
  • Five forces analysis

Quantitative

  • Market size and forecast
  • Market segmentation
  • Geographical insights
  • Competitive landscape

Interested in this report?

Get your sample now to see our research methodology and insights!

Download Now

Frequently Asked Questions

Edtech market growth will increase by USD 201057.4 million during 2026-2030.

The Edtech market is expected to grow at a CAGR of 16.2% during 2026-2030.

Edtech market is segmented by Type (Hardware, Content, Software) Sector (K-12, Higher education, Others) Deployment (Cloud, On-premises)

2U Inc., Anthology Inc., Chegg Inc., Cornerstone OnDemand Inc., Coursera Inc., D2L Corp., Discovery Education Inc., edX LLC, Ellucian Co., Google LLC, Instructure Holdings Inc., Microsoft Corp., Oracle Corp., PleIQ Smart Toys Spa, Promethean World Ltd., Think and Learn Pvt. Ltd., Udacity Inc., UOL EdTech, upGrad Education Pvt. Ltd., Workday Inc. are a few of the key vendors in the Edtech market.

North America will register the highest growth rate of 37.5% among the other regions. Therefore, the Edtech market in North America is expected to garner significant business opportunities for the vendors during the forecast period.

US, Canada, Mexico, Germany, UK, France, Italy, Spain, The Netherlands, China, Japan, India, South Korea, Australia, Indonesia, Brazil, Argentina, Chile, Saudi Arabia, UAE, South Africa, Israel, Turkey

  • Integration of ML language in technical educational systems is the driving factor this market.

The Edtech market vendors should focus on grabbing business opportunities from the Type segment as it accounted for the largest market share in the base year.
RIA - Research AI Assistant
Ask RIA