
Smart Classroom Market Size 2025-2029
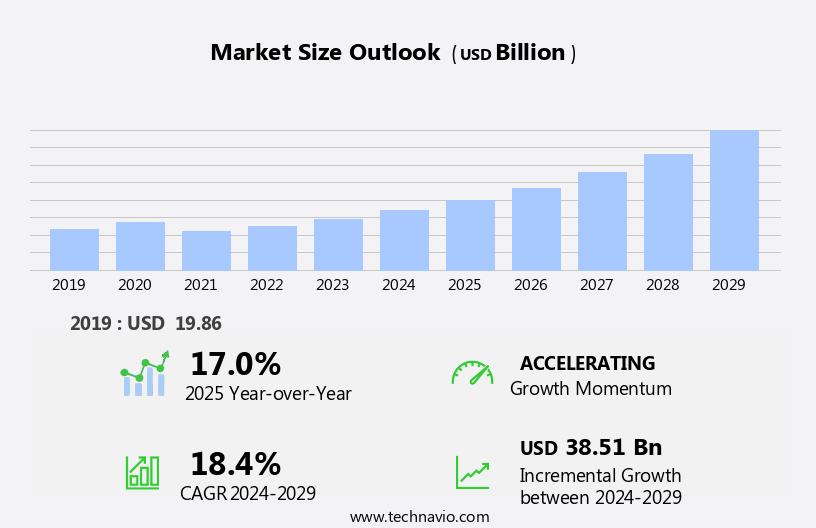
The smart classroom market size is forecast to increase by USD 38.51 billion, at a CAGR of 18.4% between 2024 and 2029.
- The market is experiencing significant growth, driven by the increasing adoption of technology in education and the proliferation of product launches. The trend towards integrating advanced technologies such as artificial intelligence, virtual reality, and augmented reality in education is gaining momentum. Schools and universities worldwide are investing in smart classroom solutions to enhance learning experiences, improve efficiency, and promote interactive and personalized education. Financial constraints, however, pose a challenge for some institutions, limiting their ability to implement these technologies at scale. Despite this hurdle, the market's potential remains vast, as the benefits of smart classrooms â such as real-time student assessment, collaborative learning, and remote education â continue to resonate with educators and administrators.
- To capitalize on this opportunity, companies must address affordability concerns and offer flexible financing options, while also focusing on developing user-friendly and cost-effective solutions. By doing so, they can help institutions overcome financial barriers and unlock the full potential of smart classrooms.
What will be the Size of the Smart Classroom Market during the forecast period?
Explore in-depth regional segment analysis with market size data - historical 2019-2023 and forecasts 2025-2029 - in the full report.
Request Free Sample
The market continues to evolve, integrating various technologies to enhance teaching and learning experiences. Teacher training and curriculum design adapt to the latest educational trends, with remote learning support ensuring accessibility for all students. Interactive projection systems and digital signage engage students, while sustainability in education and innovation in education promote a greener and more dynamic learning environment. Student response systems, assessment tools, and classroom management software streamline administrative tasks and provide valuable data analytics for personalized learning. Accessibility features, such as closed captioning and text-to-speech, ensure equal opportunities for all students. Data security and software compatibility are essential considerations, with user experience (UX) and professional development prioritized for teacher empowerment.
Educational technology standards, wireless connectivity, and high-definition displays facilitate seamless integration of hardware and collaboration skills. Adaptive learning and digital content creation enable customized instruction, while deployment strategies and multi-user collaboration foster a more interactive and engaging learning experience. User interface (UI) design and security and privacy are crucial elements of effective educational technology implementation. Universal design and future educational technology trends, including collaborative learning platforms, maintenance and support, and environmental impact, continue to shape the evolving smart classroom landscape. Problem-solving skills, critical thinking skills, and communication skills are essential outcomes of smart classroom technology integration.
How is this Smart Classroom Industry segmented?
The smart classroom industry research report provides comprehensive data (region-wise segment analysis), with forecasts and estimates in "USD billion" for the period 2025-2029, as well as historical data from 2019-2023 for the following segments.
- Product Type
- Hardware
- Software
- Services
- End-user
- K-12 schools
- Higher education institutions
- Corporate training centers
- Vocational and technical training centers
- Geography
- North America
- US
- Canada
- Europe
- France
- Germany
- Spain
- UK
- APAC
- China
- India
- Japan
- South America
- Brazil
- Rest of World (ROW)
- North America
.
By Product Type Insights
The hardware segment is estimated to witness significant growth during the forecast period.
The market is experiencing significant growth, driven by the integration of various technologies that transform traditional learning environments. Hardware solutions, a crucial segment, includes interactive projection systems, touchscreen displays, and digital whiteboards, which promote immersive and harmonious learning experiences. LG Business Solutions recently introduced the LG CreateBoard (TR3DK), a hardware innovation showcased at the 2023 Future of Education Technology Conference (FETC). This solution caters to diverse educational settings, supporting in-person, remote, and blended learning. Moreover, software components, such as classroom management software, student response systems, assessment tools, and data analytics, enable personalized learning, digital literacy, and data security.
Accessibility features and universal design ensure educational opportunities for all students. Collaborative learning platforms, cloud-based solutions, and multi-user collaboration tools foster problem-solving skills, critical thinking, and communication among students. Educational technology standards, wireless connectivity, and network infrastructure ensure seamless integration of hardware and software components. User experience, user interface, and adaptive learning technologies contribute to increased student engagement and improved learning outcomes. Sustainability in education and environmental impact are essential considerations in the market. The future of education lies in the continuous integration of innovative technologies, empowering teachers and enhancing the overall educational experience.
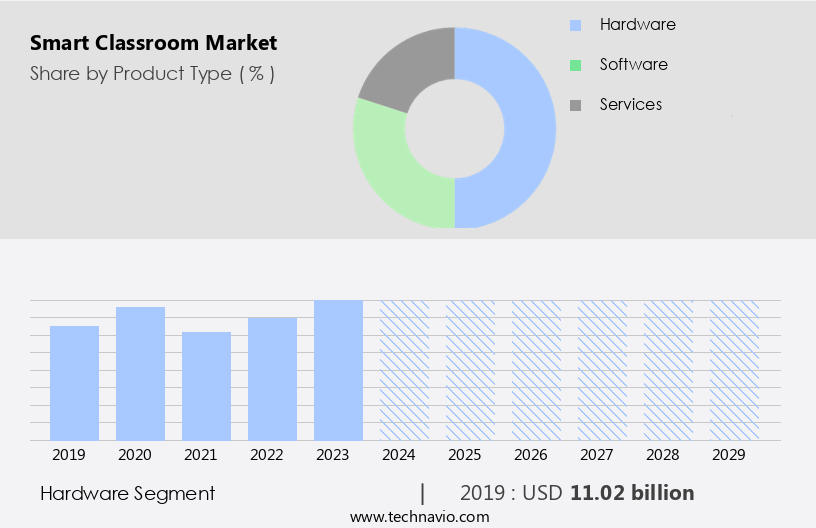
The Hardware segment was valued at USD 11.02 billion in 2019 and showed a gradual increase during the forecast period.
Regional Analysis
North America is estimated to contribute 41% to the growth of the global market during the forecast period. Technavio's analysts have elaborately explained the regional trends and drivers that shape the market during the forecast period.
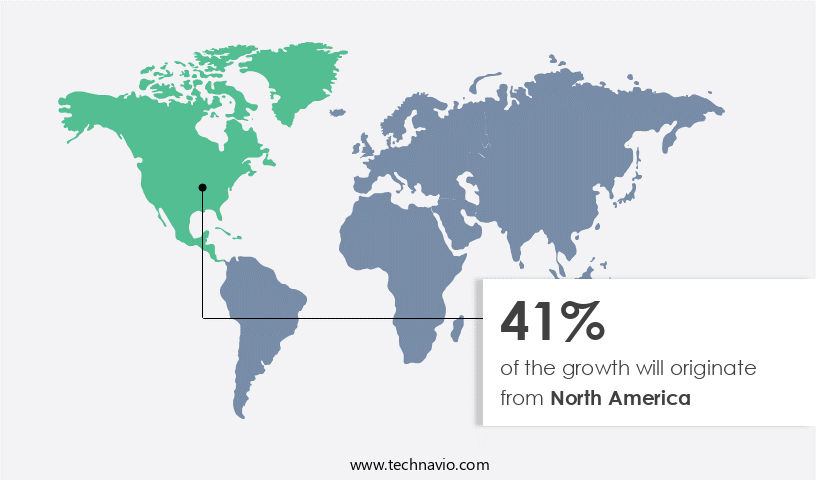
The North American the market is witnessing significant growth, fueled by continuous technological innovations and escalating educational technology investments. In March 2023, ViewSonic Corp. Showcased the latest iteration of its virtual learning platform, UNIVERSE by ViewSonic, at the BETT Show. This platform's newest features include immersive 3D environments, themed classrooms for specific subjects, and performance metrics for educators, underscoring the region's dedication to improving digital learning experiences. Immersive 3D learning environments are a prominent trend in the North American the market. These environments offer students a more captivating and interactive learning experience, enabling them to explore intricate subjects within a virtual realm.
Furthermore, this market is also prioritizing sustainability, accessibility, and collaboration, with a focus on user experience, personalized learning, and network infrastructure. Technological fluency, digital literacy, and data analytics are essential components of the smart classroom landscape. Classroom management software, assessment tools, and student response systems facilitate efficient teaching and learning processes. Interactive projection systems, digital signage, and cloud-based solutions enhance communication and collaboration among students and educators. Security and privacy, universal design, and maintenance and support are crucial considerations in the market. Adaptive learning, problem-solving skills, critical thinking skills, and communication skills are essential learning outcomes that educational technology trends aim to address.
Hardware integration and deployment strategies are essential for seamless implementation and long-term success.
Market Dynamics
Our researchers analyzed the data with 2024 as the base year, along with the key drivers, trends, and challenges. A holistic analysis of drivers will help companies refine their marketing strategies to gain a competitive advantage.
What are the key market drivers leading to the rise in the adoption of Smart Classroom Industry?
- The implementation of increasingly more smart classroom projects serves as the primary market growth catalyst.
- The market is experiencing substantial growth due to the increasing adoption of technology in education. This trend is driven by the universal design of smart classrooms, which prioritizes accessibility and inclusivity for all students. The future of education is being shaped by collaborative learning platforms that enable students to work together in real-time, enhancing problem-solving, critical thinking, and communication skills. Security and privacy are essential considerations in the market, ensuring student data is protected. Maintenance and support services are also crucial for the successful implementation and operation of these advanced learning environments.
- Furthermore, the environmental impact of smart classrooms is a significant concern, with a focus on energy efficiency and sustainable hardware integration. Educational technology trends continue to evolve, with smart classrooms at the forefront of innovation. Learning outcomes are improved through the use of immersive and harmonious educational technologies, emphasizing a student-centered approach. The market dynamics are propelled by the integration of hardware and software solutions that cater to the diverse needs of educators and learners alike.
What are the market trends shaping the Smart Classroom Industry?
- Product launches are currently the most significant market trend. It is essential for businesses to stay informed and prepared for upcoming product launches to remain competitive.
- The market is experiencing substantial growth due to the integration of advanced technologies and innovative solutions. In 2024, Huawei, a leading technology company, introduced the Smart Classroom 3.0 Solution, featuring AI teaching analysis capabilities. This solution empowers educators to adopt modern teaching methodologies, enhancing student engagement and interaction. The implementation of AI in education is a significant trend, aimed at improving educational standards and learning outcomes. The market is driven by continuous product innovations, including curriculum design tools, remote learning support, interactive projection systems, student response systems, classroom management software, assessment tools, accessibility features, and sustainability in education.
- These solutions provide teachers with the resources to create immersive and harmonious learning environments, emphasizing student engagement and accessibility for all. The commitment of industry leaders to innovation in education is evident in the launch of such advanced offerings, positioning the market for continued growth.
What challenges does the Smart Classroom Industry face during its growth?
- Financial constraints represent a significant challenge to the expansion and growth of the industry.
- The market is experiencing significant growth due to the increasing emphasis on data analytics, digital literacy, and personalized learning. High-quality data analytics tools enable educators to gain valuable insights into student performance, facilitating more effective instruction. Digital literacy is crucial in today's workforce, making digital classrooms an essential investment for educational institutions. Data security is a critical concern in smart classrooms, with network infrastructure and software compatibility playing significant roles. Ensuring technological fluency and professional development for teachers is essential for successful implementation. User experience (UX) is another vital factor, as immersive, harmonious, and thematic designs can enhance student engagement and learning.
- Personalized learning is a key benefit of smart classrooms, as they enable teachers to tailor instruction to individual students' needs. Wireless connectivity and educational technology standards are essential for seamless integration of various devices and applications. Ensuring data security and software compatibility are essential to maintain a productive and safe learning environment. In conclusion, the market offers numerous benefits, including data analytics, digital literacy, personalized learning, and teacher empowerment. However, financial constraints remain a significant challenge, with high-priced components such as interactive whiteboards and devices adding to the overall investment. Despite these challenges, the potential benefits make smart classrooms a worthwhile investment for educational institutions.
Exclusive Customer Landscape
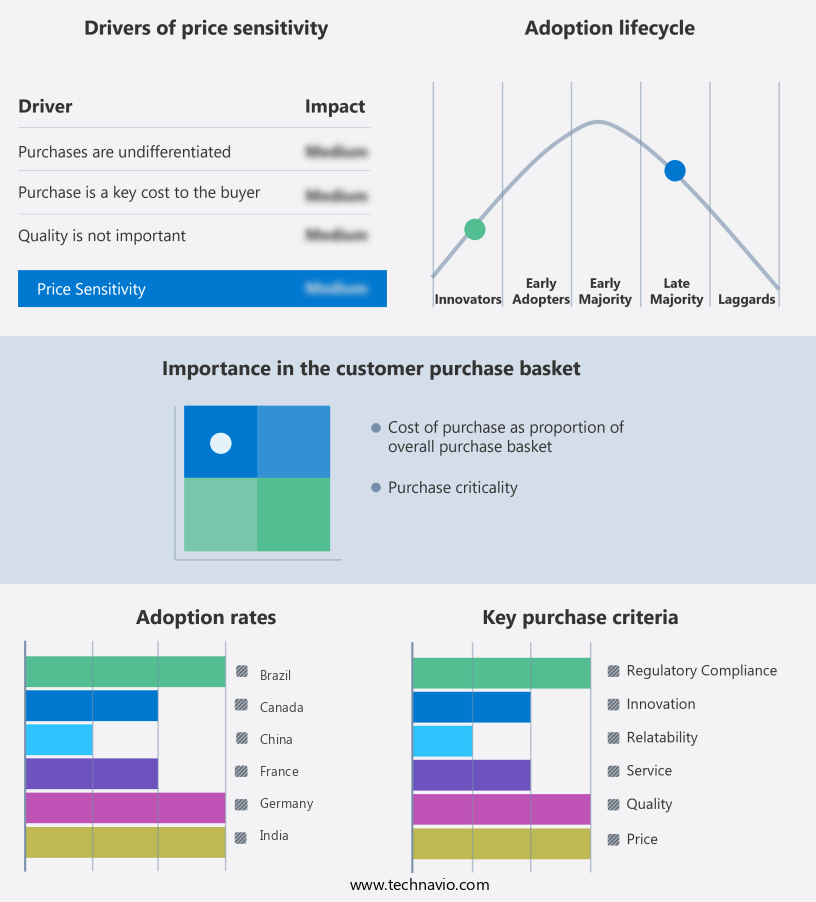
The smart classroom market forecasting report includes the adoption lifecycle of the market, covering from the innovator's stage to the laggard's stage. It focuses on adoption rates in different regions based on penetration. Furthermore, the smart classroom market report also includes key purchase criteria and drivers of price sensitivity to help companies evaluate and develop their market growth analysis strategies.
Customer Landscape
Key Companies & Market Insights
Companies are implementing various strategies, such as strategic alliances, smart classroom market forecast, partnerships, mergers and acquisitions, geographical expansion, and product/service launches, to enhance their presence in the industry.
BenQ Corp. - Interactive flat panels, including the ClassroomCare model, feature high-definition touchscreens with multi-touch capabilities and 4K resolution.
The industry research and growth report includes detailed analyses of the competitive landscape of the market and information about key companies, including:
- BenQ Corp.
- Boxlight Corp
- Educomp Solutions Ltd.
- Extramarks
- Gynzy Group B.V.
- Kahoot ASA
- LG Corp.
- Nearpod Inc.
- PaperScorer
- Pathway Innovations Inc
- Promethean World Ltd.
- Schoolnet India Ltd
- SMART Technologies ULC
- Solutionz Inc.
- SmartSchool
- Toppr Technologies Pvt. Ltd.
- ViewSonic Corp.
- Vivi International Pty Ltd.
Qualitative and quantitative analysis of companies has been conducted to help clients understand the wider business environment as well as the strengths and weaknesses of key industry players. Data is qualitatively analyzed to categorize companies as pure play, category-focused, industry-focused, and diversified; it is quantitatively analyzed to categorize companies as dominant, leading, strong, tentative, and weak.
Recent Development and News in Smart Classroom Market
- In February 2023, Logitech, a leading technology company, announced the launch of their new interactive classroom solution, Logitech Classroom Suite. This all-in-one solution includes a large format touch display, a camera, and a soundbar, aiming to enhance interactive learning experiences (Logitech Press Release, 2023).
- In May 2024, Microsoft and Google, two tech giants, joined forces to integrate Microsoft Teams into Google Classroom. This collaboration allows teachers to schedule and manage Microsoft Teams meetings directly from Google Classroom, streamlining remote learning processes (Microsoft Press Release, 2024).
- In September 2024, Panasonic Corporation and Cisco Systems, Inc. announced a strategic partnership to develop and deliver smart classroom solutions. Their collaboration includes the integration of Panasonic's interactive displays and Cisco's Webex video conferencing technology, providing a comprehensive solution for remote and hybrid learning environments (Cisco Press Release, 2024).
- In January 2025, Apple announced a significant investment of USD 1 billion in Clever, an educational technology company. This investment aims to expand Clever's services, including single sign-on and rostering solutions, to more schools and districts, further integrating Apple devices into the education sector (Apple Press Release, 2025).
Research Analyst Overview
- The market is experiencing significant growth, driven by the integration of technology into education. STEM and STEAM education are leading this trend, with open educational resources and interactive games playing crucial roles in immersive learning experiences. Blended learning models, incorporating both traditional and digital methods, are becoming increasingly popular. Student performance tracking and teacher feedback systems enable personalized learning paths, while coding and programming skills are in high demand. Inquiry-based learning and project-based learning are fostering collaborative learning spaces, where students can work together on complex projects. Digital textbook adoption and online learning are expanding access to education, especially in distance learning scenarios.
- Big data analytics and educational simulations offer valuable insights into student progress, while virtual field trips broaden horizons. Hybrid learning models and classroom technology adoption continue to evolve, with educational data mining and learning analytics dashboards providing valuable insights for educators. Computational thinking and collaborative learning are essential skills for the future workforce, and digital storytelling enhances students' creativity and communication abilities. Open educational resources and interactive games contribute to engaging, effective learning experiences, while inquiry-based learning and project-based learning foster critical thinking and problem-solving skills. Classroom technology adoption and blended learning models are transforming education, making it more accessible, personalized, and interactive.
Dive into Technavio's robust research methodology, blending expert interviews, extensive data synthesis, and validated models for unparalleled Smart Classroom Market insights. See full methodology.
|
Market Scope |
|
|
Report Coverage |
Details |
|
Page number |
202 |
|
Base year |
2024 |
|
Historic period |
2019-2023 |
|
Forecast period |
2025-2029 |
|
Growth momentum & CAGR |
Accelerate at a CAGR of 18.4% |
|
Market growth 2025-2029 |
USD 38.51 billion |
|
Market structure |
Fragmented |
|
YoY growth 2024-2025(%) |
17.0 |
|
Key countries |
US, Canada, Germany, UK, China, Brazil, France, Spain, India, and Japan |
|
Competitive landscape |
Leading Companies, Market Positioning of Companies, Competitive Strategies, and Industry Risks |
What are the Key Data Covered in this Smart Classroom Market Research and Growth Report?
- CAGR of the Smart Classroom industry during the forecast period
- Detailed information on factors that will drive the growth and forecasting between 2025 and 2029
- Precise estimation of the size of the market and its contribution of the industry in focus to the parent market
- Accurate predictions about upcoming growth and trends and changes in consumer behaviour
- Growth of the market across North America, Europe, APAC, South America, and Middle East and Africa
- Thorough analysis of the market's competitive landscape and detailed information about companies
- Comprehensive analysis of factors that will challenge the smart classroom market growth of industry companies
We can help! Our analysts can customize this smart classroom market research report to meet your requirements.
 RIA -
RIA - 
