3D Scanner Market Analysis, Size, and Forecast 2026-2030: APAC (China, Japan, and India), North America (US, Canada, and Mexico), Europe (Germany, UK, and France), South America (Brazil and Argentina), Middle East and Africa (Saudi Arabia, UAE, and South Africa), and Rest of World (ROW)

3D Scanner Market Analysis, Size, and Forecast 2026-2030:
APAC (China, Japan, and India), North America (US, Canada, and Mexico), Europe (Germany, UK, and France), South America (Brazil and Argentina), Middle East and Africa (Saudi Arabia, UAE, and South Africa), and Rest of World (ROW)

Published: May 2026 298 Pages SKU: IRTNTR43838

Market Overview at a Glance

$6.38 B
Market Opportunity
12.8%
CAGR 2025 - 2030
37.3%
APAC Growth
$3.94 B
Laser triangulation segment 2024

3D Scanner Market Size 2026-2030

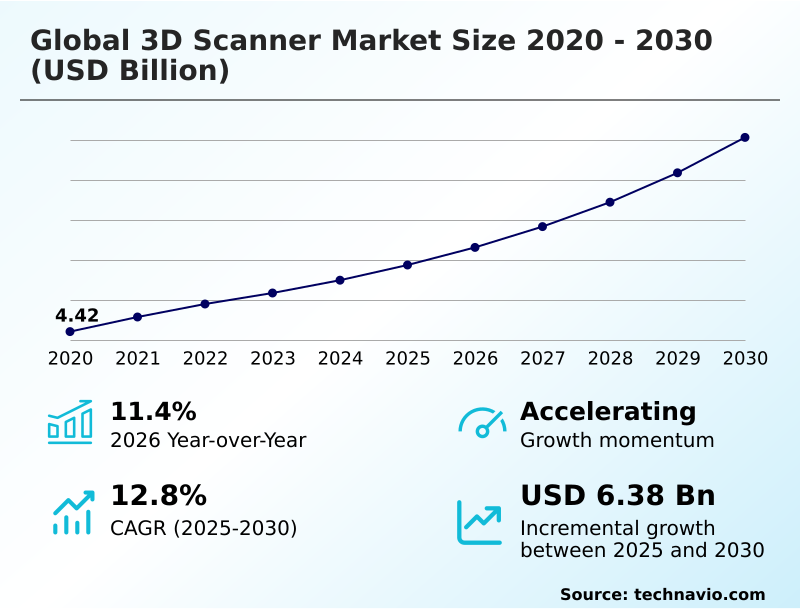
The 3D Scanner Market size was valued at USD 7.75 billion in 2025, growing at a CAGR of 12.8% during the forecast period 2026-2030.

Major Market Trends & Insights

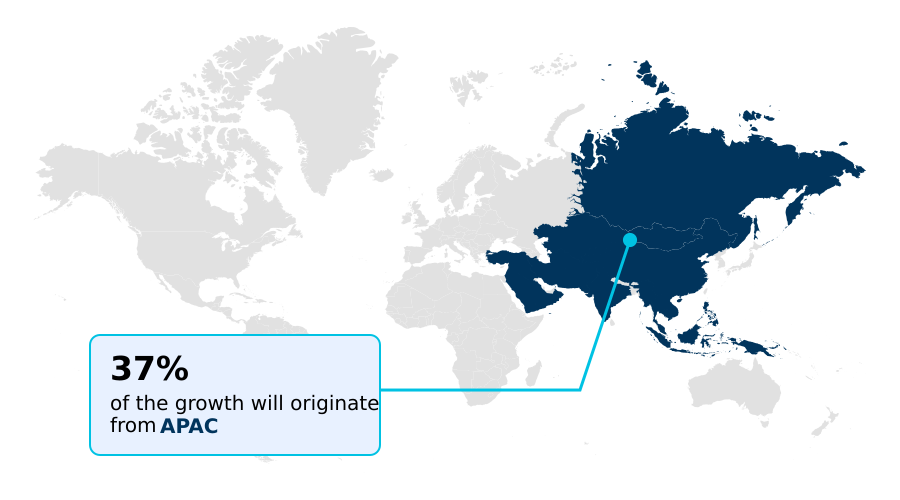
  • APAC dominated the market and accounted for a 37.3% growth during the forecast period.
  • By Technology - Laser triangulation segment was valued at USD 3.94 billion in 2024
  • By End-user - Industrial manufacturing segment accounted for the largest market revenue share in 2024

Market Size & Forecast

  • Historic Market Opportunities 2020-2024: USD 9.71 billion
  • Market Future Opportunities 2025-2030: USD 6.38 billion
  • CAGR from 2025 to 2030 : 12.8%

Market Summary

  • The 3D scanner market is characterized by rapid technological advancement and expanding applications, where adoption in industrial manufacturing for automated quality control reduces rework by over 20%.
  • The drive for precision and efficiency in sectors like automotive and aerospace is a major market force, as a business may use a handheld 3d scanner to conduct component wear assessment, which is 50% faster than manual methods. This need for high-fidelity data fuels innovation and investment.
  • However, the market faces a significant challenge from the inherent complexity of post-processing workflows and a persistent scarcity of skilled operators, which can increase project timelines.
  • This skills gap acts as a deterrent for companies lacking in-house expertise, tempering the pace of adoption despite the clear operational benefits of using polygonal mesh generation and other advanced techniques for digital twin creation.

What will be the Size of the 3D Scanner Market during the forecast period?

Get Key Insights on Market Forecast (PDF) Request Free Sample

How is the 3D Scanner Market Segmented?

The 3d scanner industry research report provides comprehensive data (region-wise segment analysis), with forecasts and analysis for the period 2026-2030, as well as historical data from 2020-2024 for the following segments.

  • Technology
    • Laser triangulation
    • Structured light
  • End-user
    • Industrial manufacturing
    • Healthcare
    • Architecture and engineering
    • Aerospace and defense
    • Others
  • Product type
    • Short-range
    • Medium-range
    • Long-range
  • Geography
    • APAC
      • China
      • Japan
      • India
    • North America
      • US
      • Canada
      • Mexico
    • Europe
      • Germany
      • UK
      • France
    • South America
      • Brazil
      • Argentina
    • Middle East and Africa
      • Saudi Arabia
      • UAE
      • South Africa
    • Rest of World (ROW)

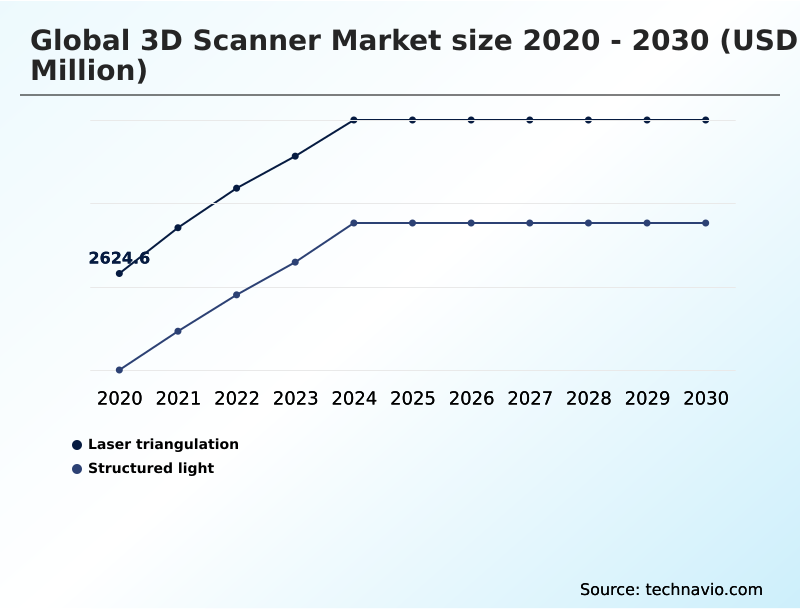
How is the 3D Scanner Market Segmented by Technology?

The laser triangulation segment is estimated to witness significant growth during the forecast period.

The laser triangulation segment, which accounts for over 55% of the technology-based market, is defined by its metrology-grade accuracy and high-resolution data capture for industrial applications.

This technology is critical in manufacturing environments where it improves defect detection rates by over 25% through precise CAD model comparison.

The operational value is derived from its ability to perform non-contact measurement of complex parts, reducing inspection cycles by up to 40% compared to traditional coordinate measuring machine (CMM) methods.

Its integration into production lines provides a real-time feedback loop, enabling immediate process adjustments and supporting zero-defect production goals.

While essential for quality control and reverse engineering workflows, its effectiveness is often dependent on the surface properties of the scanned object.

Request Free Sample

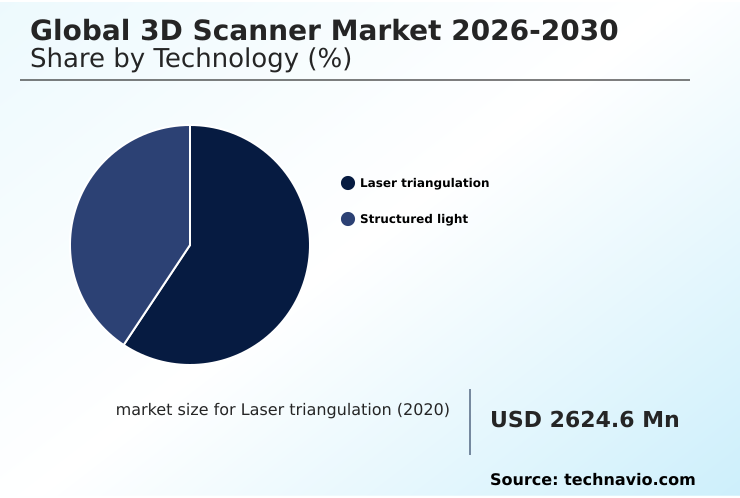
The Laser triangulation segment was valued at USD 3.94 billion in 2024 and showed a gradual increase during the forecast period.

Request Free Sample

How demand for the 3D Scanner market is rising in the leading region?

APAC is estimated to contribute 37.3% to the growth of the global market during the forecast period.Technavio’s analysts have elaborately explained the regional trends and drivers that shape the market during the forecast period.

See How 3D Scanner Market demand is rising in APAC Request Free Sample

The geographic landscape of the 3D scanner market is led by APAC, which is projected to contribute over 37% of the market's incremental growth, outpacing North America's 31% share.

This growth is driven by rapid industrialization and strong government support for smart factory principles in countries like China and Japan, whose markets are approximately 30% and 15% larger, respectively, than any other nation in the region.

North America's market is characterized by high adoption of advanced systems for aerospace and medical applications, leveraging nanometer-level metrology. In contrast, APAC's growth is fueled by high-volume manufacturing, where in-line inspection systems are critical.

This regional difference impacts supply chain strategies, with vendors focusing on high-precision, specialized solutions for North America and scalable, cost-effective systems for APAC to meet diverse industrial demands.

What are the key Drivers, Trends, and Challenges in the 3D Scanner Market?

Our researchers analyzed the data with 2025 as the base year, along with the key drivers, trends, and challenges. A holistic analysis of drivers will help companies refine their marketing strategies to gain a competitive advantage.

  • Businesses evaluating the global 3d scanner market 2026-2030 are increasingly focused on specific use cases to justify capital investment. For instance, a key query is the specific capability of a 3d scanner for automotive quality control, where implementing automated inspection can reduce part-rejection rates by over 15% compared to manual methods.
  • The decision between structured light vs laser triangulation accuracy is critical; while laser systems may offer a 5% accuracy advantage on certain geometries, structured light provides faster data capture for freeform surfaces. The rising interest in a handheld 3d scanner for reverse engineering stems from its ability to shorten product development cycles.
  • Furthermore, the application of 3d scanning for healthcare personalized medicine is a high-growth area, driven by the demand for patient-specific implants. Finally, understanding the total cost of industrial 3d scanning implementation is crucial, as software and training can add up to 50% to the initial hardware price, a factor that heavily influences ROI calculations and purchasing decisions.

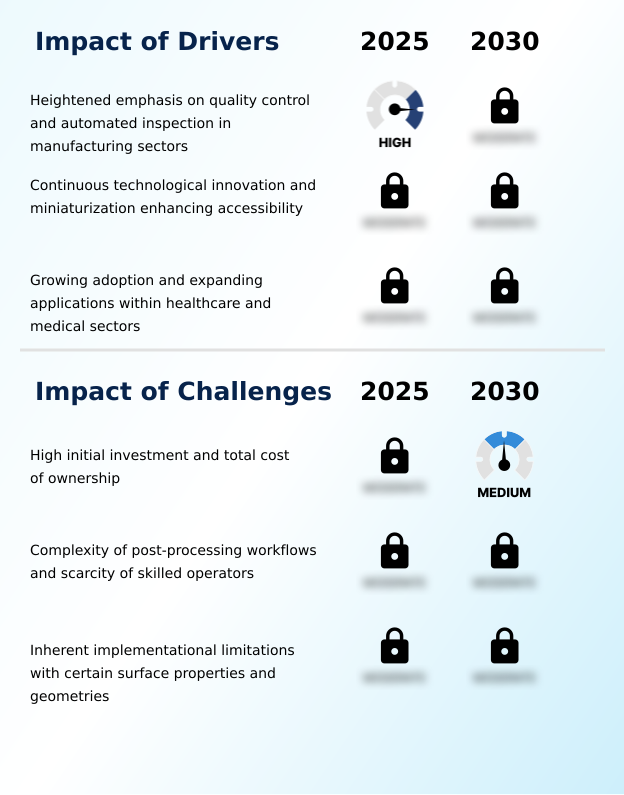
What are the key market drivers leading to the rise in the adoption of 3D Scanner Industry?

  • A heightened emphasis on meticulous quality control and the adoption of automated inspection processes across manufacturing sectors are primary drivers of market growth.

  • The primary driver for the 3D scanner market is the heightened demand for automated quality control in manufacturing, which can reduce scrap rates by more than 15% through early defect detection.
  • Industries such as automotive and aerospace are adopting non-contact measurement techniques to perform comprehensive, full-surface inspections, a process that is up to 10 times faster than using traditional coordinate measuring machines.
  • This adoption is fueled by the pursuit of zero-defect production and the need to comply with stringent quality standards.
  • Furthermore, continuous technological innovation, including the development of more user-friendly software interfaces and portable hardware, is making the technology more accessible to small and medium-sized enterprises, significantly broadening the user base and driving market expansion.

What are the market trends shaping the 3D Scanner Industry?

  • The integration of artificial intelligence and machine learning is a transformative trend, enhancing the automation and efficiency of data processing workflows in the 3D scanner market.

  • A pivotal trend in the 3D scanner market is the integration of AI-powered data processing, which automates complex tasks and can accelerate post-processing workflows by up to 40%. Machine learning algorithms are now used for automated feature recognition and CAD model comparison, enabling in-line inspection systems to detect manufacturing defects with over 98% accuracy.
  • This shift from manual to automated analysis is driven by the need for greater efficiency in zero-defect production environments. Another significant trend is the synergy with additive manufacturing, where 3D scanning provides the essential digital thread connectivity between a physical part and its digital twin, ensuring dimensional fidelity in scan-to-print applications.
  • The proliferation of portable solutions is also expanding the market, making advanced metrology more accessible.

What challenges does the 3D Scanner Industry face during its growth?

  • The high initial investment required for professional-grade systems and the total cost of ownership remain significant challenges affecting broader market adoption.

  • A significant challenge restraining the 3d scanner market is the high capital investment barrier, with the total cost of ownership for industrial-grade systems often being 2-3 times the initial hardware price due to software, training, and maintenance. This financial hurdle deters many small and medium-sized enterprises.
  • Another key issue is the scarcity of skilled operators proficient in complex point cloud processing and reverse engineering workflows, which can lead to project delays of 20% or more.
  • Furthermore, inherent technological constraints, such as surface property limitations when scanning highly reflective or transparent objects, can compromise data quality and require additional manual preparation, reducing overall operational efficiency gains and limiting applications.

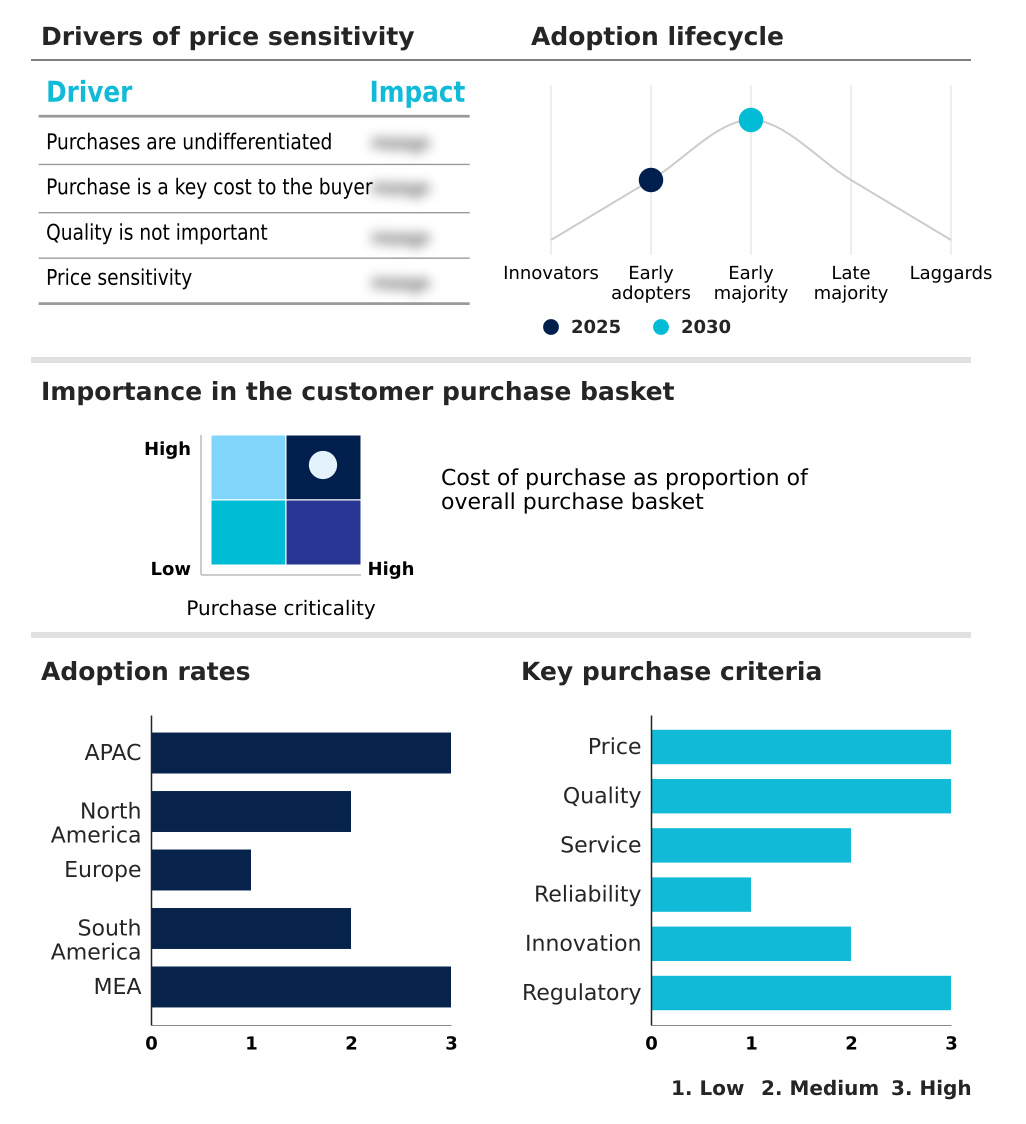
Exclusive Technavio Analysis on Customer Landscape

The 3d scanner market forecasting report includes the adoption lifecycle of the market, covering from the innovator’s stage to the laggard’s stage. It focuses on adoption rates in different regions based on penetration. Furthermore, the 3d scanner market report also includes key purchase criteria and drivers of price sensitivity to help companies evaluate and develop their market growth analysis strategies.

Customer Landscape of 3D Scanner Industry

Competitive Landscape

Companies are implementing various strategies, such as strategic alliances, 3d scanner market forecast, partnerships, mergers and acquisitions, geographical expansion, and product/service launches, to enhance their presence in the industry.

Artec Europe Sarl - Key market offerings include high-precision metrology solutions, portable 3D scanners, automated quality control systems, and integrated software platforms for industrial, medical, and geospatial applications.

The industry research and growth report includes detailed analyses of the competitive landscape of the market and information about key companies, including:

  • Artec Europe Sarl
  • Basis Software Inc.
  • Carl Zeiss AG
  • Creaform Inc.
  • Evatronix SA
  • Hexagon AB
  • Keyence Corp.
  • Maptek Pty Ltd.
  • Matterport Inc.
  • Medit Corp.
  • Metronor AS
  • Nikon Corp.
  • Quality Vision International Inc.
  • RIEGL Laser Measurement Systems
  • Scantech Hangzhou Co. Ltd.
  • Shining 3D Tech Co. Ltd.
  • Tesca Technologies Pvt. Ltd.
  • Topcon Positioning Systems Inc.
  • Trimble Inc.
  • Zoller and Frohlich GmbH

Qualitative and quantitative analysis of companies has been conducted to help clients understand the wider business environment as well as the strengths and weaknesses of key industry players. Data is qualitatively analyzed to categorize companies as pure play, category-focused, industry-focused, and diversified; it is quantitatively analyzed to categorize companies as dominant, leading, strong, tentative, and weak.

Market Intelligence Radar: High-Impact Developments & Growth Signals

  • In the Industrial Machinery and Supplies and Components industry, the push toward Industry 4.0 and smart factory principles has accelerated the integration of digital twin creation and management, directly fueling demand for 3D scanners as the primary tool for capturing as-built data.
  • A growing emphasis on supply chain digitalization and resilience is prompting manufacturers to adopt 3D scanning for reverse engineering, enabling the rapid in-house replication of legacy or out-of-stock parts, which reduces dependency on volatile external suppliers.
  • The widespread adoption of autonomous robotics and automated quality control systems in manufacturing has created a significant pull for in-line inspection systems, where integrated 3D scanners provide essential machine vision and real-time data for process feedback loops.
  • Increasingly stringent international quality standards and a focus on zero-defect production methodologies have made advanced, non-contact measurement a requirement, solidifying the role of 3D scanning in high-precision inspection workflows across the industrial sector.

Dive into Technavio’s robust research methodology, blending expert interviews, extensive data synthesis, and validated models for unparalleled 3D Scanner Market insights. See full methodology.

Market Scope
Page number 298
Base year 2025
Historic period 2020-2024
Forecast period 2026-2030
Growth momentum & CAGR Accelerate at a CAGR of 12.8%
Market growth 2026-2030 USD 6379.3 million
Market structure Fragmented
YoY growth 2025-2026(%) 11.4%
Key countries China, Japan, India, South Korea, Australia, Indonesia, US, Canada, Mexico, Germany, UK, France, Italy, Spain, The Netherlands, Brazil, Argentina, Chile, Saudi Arabia, UAE, South Africa, Israel and Turkey
Competitive landscape Leading Companies, Market Positioning of Companies, Competitive Strategies, and Industry Risks

Request Free Sample

Research Analyst Overview

  • The 3D scanner market ecosystem is a complex network where technology suppliers of lasers and sensors provide core components to hardware manufacturers, who represent about 60% of the market's value. These manufacturers, including key players like Hexagon AB and Creaform Inc., then partner with software developers to create integrated solutions.
  • Distribution channels are varied, including direct sales for high-value industrial systems and a network of resellers for smaller, portable devices. End-users in industrial manufacturing and healthcare are the primary consumers, driving demand for metrology-grade accuracy and application-specific functionalities.
  • This value chain is supported by research institutions that advance point cloud processing algorithms and industry standards bodies that ensure interoperability, creating a dynamic and interdependent market structure.

What are the Key Data Covered in this 3D Scanner Market Research and Growth Report?

  • What is the expected growth of the 3D Scanner Market between 2026 and 2030?

    • The 3D Scanner Market is expected to grow by USD 6.38 billion during 2026-2030, registering a CAGR of 12.8%. Year-over-year growth in 2026 is estimated at 11.4%%. This acceleration is shaped by heightened emphasis on quality control and automated inspection in manufacturing sectors, which is intensifying demand across multiple end-use verticals covered in the report.

  • What segmentation does the market report cover?

    • The report is segmented by Technology (Laser triangulation, and Structured light), End-user (Industrial manufacturing, Healthcare, Architecture and engineering, Aerospace and defense, and Others), Product Type (Short-range, Medium-range, and Long-range) and Geography (APAC, North America, Europe, South America, Middle East and Africa). Among these, the Laser triangulation segment is estimated to witness significant growth during the forecast period, driven by rising adoption across key application areas. Each segment includes detailed qualitative and quantitative analysis, along with historical data from 2020-2024 and forecasts through 2030 with year-over-year growth rates.

  • Which regions are analyzed in the report?

    • The report covers APAC, North America, Europe, South America and Middle East and Africa. APAC is estimated to contribute 37.3% to market growth during the forecast period. Country-level analysis includes China, Japan, India, South Korea, Australia, Indonesia, US, Canada, Mexico, Germany, UK, France, Italy, Spain, The Netherlands, Brazil, Argentina, Chile, Saudi Arabia, UAE, South Africa, Israel and Turkey, with dedicated market size tables and year-over-year growth for each.

  • What are the key growth drivers and market challenges?

    • The primary driver is heightened emphasis on quality control and automated inspection in manufacturing sectors, which is accelerating investment and industry demand. The main challenge is high initial investment and total cost of ownership, creating operational barriers for key market participants. The report quantifies the impact of each driver and challenge across 2026 and 2030 with comparative analysis.

  • Who are the major players in the 3D Scanner Market?

    • Key vendors include Artec Europe Sarl, Basis Software Inc., Carl Zeiss AG, Creaform Inc., Evatronix SA, Hexagon AB, Keyence Corp., Maptek Pty Ltd., Matterport Inc., Medit Corp., Metronor AS, Nikon Corp., Quality Vision International Inc., RIEGL Laser Measurement Systems, Scantech Hangzhou Co. Ltd., Shining 3D Tech Co. Ltd., Tesca Technologies Pvt. Ltd., Topcon Positioning Systems Inc., Trimble Inc. and Zoller and Frohlich GmbH. The report provides qualitative and quantitative analysis categorizing companies as dominant, leading, strong, tentative, and weak based on their market positioning. Company profiles include business segment analysis, SWOT assessment, key offerings, and recent strategic developments.

Market Research Insights

  • The competitive landscape of the 3d scanner market is highly fragmented, with the top five vendors accounting for less than 40% of the market share, fostering intense innovation. Key players like Hexagon AB and Trimble Inc. are focused on expanding their software ecosystems and integrating AI-powered data processing to create more value.
  • For instance, recent developments in mobile mapping systems have increased data acquisition speed by over 30% for large-scale projects. This addresses enterprise demand for greater operational efficiency gains in industries such as construction and mining.
  • However, vendors continue to navigate challenges related to surface property limitations on reflective or transparent materials, prompting significant R&D investment in new sensor and light-source technologies to broaden application capabilities and maintain a competitive edge.

We can help! Our analysts can customize this 3d scanner market research report to meet your requirements.

Get in touch

1. Executive Summary

1.1 Market overview

Executive Summary - Chart on Market Overview
Executive Summary - Data Table on Market Overview
Executive Summary - Chart on Global Market Characteristics
Executive Summary - Chart on Market by Geography
Executive Summary - Chart on Market Segmentation by Technology
Executive Summary - Chart on Market Segmentation by End-user
Executive Summary - Chart on Market Segmentation by Product Type
Executive Summary - Chart on Incremental Growth
Executive Summary - Data Table on Incremental Growth
Executive Summary - Chart on Company Market Positioning

2. Technavio Analysis

2.1 Analysis of price sensitivity, lifecycle, customer purchase basket, adoption rates, and purchase criteria

2.2 Criticality of inputs and Factors of differentiation

Chart on Overview on criticality of inputs and factors of differentiation

2.3 Factors of disruption

Chart on Overview on factors of disruption

2.4 Impact of drivers and challenges

Chart on Impact of drivers and challenges in 2025 and 2030

3. Market Landscape

3.1 Market ecosystem

Chart on Parent Market
Data Table on - Parent Market

3.2 Market characteristics

Chart on Market characteristics analysis

3.3 Value chain analysis

Chart on Value chain analysis

4. Market Sizing

4.1 Market definition

Data Table on Offerings of companies included in the market definition

4.2 Market segment analysis

Market segments

4.3 Market size 2025

4.4 Market outlook: Forecast for 2025-2030

Chart on Global - Market size and forecast 2025-2030 ($ million)
Data Table on Global - Market size and forecast 2025-2030 ($ million)
Chart on Global Market: Year-over-year growth 2025-2030 (%)
Data Table on Global Market: Year-over-year growth 2025-2030 (%)

5. Historic Market Size

5.1 Global 3D Scanner Market 2020 - 2024

Historic Market Size - Data Table on Global 3D Scanner Market 2020 - 2024 ($ million)

5.2 Technology segment analysis 2020 - 2024

Historic Market Size - Technology Segment 2020 - 2024 ($ million)

5.3 End-user segment analysis 2020 - 2024

Historic Market Size - End-user Segment 2020 - 2024 ($ million)

5.4 Product Type segment analysis 2020 - 2024

Historic Market Size - Product Type Segment 2020 - 2024 ($ million)

5.5 Geography segment analysis 2020 - 2024

Historic Market Size - Geography Segment 2020 - 2024 ($ million)

5.6 Country segment analysis 2020 - 2024

Historic Market Size - Country Segment 2020 - 2024 ($ million)

6. Qualitative Analysis

6.1 Impact of AI on global 3D scanner market

6.2 Impact of geopolitical conflicts on global 3D scanner market

7. Five Forces Analysis

7.1 Five forces summary

Five forces analysis - Comparison between 2025 and 2030

7.2 Bargaining power of buyers

Bargaining power of buyers - Impact of key factors 2025 and 2030

7.3 Bargaining power of suppliers

Bargaining power of suppliers - Impact of key factors in 2025 and 2030

7.4 Threat of new entrants

Threat of new entrants - Impact of key factors in 2025 and 2030

7.5 Threat of substitutes

Threat of substitutes - Impact of key factors in 2025 and 2030

7.6 Threat of rivalry

Threat of rivalry - Impact of key factors in 2025 and 2030

7.7 Market condition

Chart on Market condition - Five forces 2025 and 2030

8. Market Segmentation by Technology

8.1 Market segments

Chart on Technology - Market share 2025-2030 (%)
Data Table on Technology - Market share 2025-2030 (%)

8.2 Comparison by Technology

Chart on Comparison by Technology
Data Table on Comparison by Technology

8.3 Laser triangulation - Market size and forecast 2025-2030

Chart on Laser triangulation - Market size and forecast 2025-2030 ($ million)
Data Table on Laser triangulation - Market size and forecast 2025-2030 ($ million)
Chart on Laser triangulation - Year-over-year growth 2025-2030 (%)
Data Table on Laser triangulation - Year-over-year growth 2025-2030 (%)

8.4 Structured light - Market size and forecast 2025-2030

Chart on Structured light - Market size and forecast 2025-2030 ($ million)
Data Table on Structured light - Market size and forecast 2025-2030 ($ million)
Chart on Structured light - Year-over-year growth 2025-2030 (%)
Data Table on Structured light - Year-over-year growth 2025-2030 (%)

8.5 Market opportunity by Technology

Market opportunity by Technology ($ million)
Data Table on Market opportunity by Technology ($ million)

9. Market Segmentation by End-user

9.1 Market segments

Chart on End-user - Market share 2025-2030 (%)
Data Table on End-user - Market share 2025-2030 (%)

9.2 Comparison by End-user

Chart on Comparison by End-user
Data Table on Comparison by End-user

9.3 Industrial manufacturing - Market size and forecast 2025-2030

Chart on Industrial manufacturing - Market size and forecast 2025-2030 ($ million)
Data Table on Industrial manufacturing - Market size and forecast 2025-2030 ($ million)
Chart on Industrial manufacturing - Year-over-year growth 2025-2030 (%)
Data Table on Industrial manufacturing - Year-over-year growth 2025-2030 (%)

9.4 Healthcare - Market size and forecast 2025-2030

Chart on Healthcare - Market size and forecast 2025-2030 ($ million)
Data Table on Healthcare - Market size and forecast 2025-2030 ($ million)
Chart on Healthcare - Year-over-year growth 2025-2030 (%)
Data Table on Healthcare - Year-over-year growth 2025-2030 (%)

9.5 Architecture and engineering - Market size and forecast 2025-2030

Chart on Architecture and engineering - Market size and forecast 2025-2030 ($ million)
Data Table on Architecture and engineering - Market size and forecast 2025-2030 ($ million)
Chart on Architecture and engineering - Year-over-year growth 2025-2030 (%)
Data Table on Architecture and engineering - Year-over-year growth 2025-2030 (%)

9.6 Aerospace and defense - Market size and forecast 2025-2030

Chart on Aerospace and defense - Market size and forecast 2025-2030 ($ million)
Data Table on Aerospace and defense - Market size and forecast 2025-2030 ($ million)
Chart on Aerospace and defense - Year-over-year growth 2025-2030 (%)
Data Table on Aerospace and defense - Year-over-year growth 2025-2030 (%)

9.7 Others - Market size and forecast 2025-2030

Chart on Others - Market size and forecast 2025-2030 ($ million)
Data Table on Others - Market size and forecast 2025-2030 ($ million)
Chart on Others - Year-over-year growth 2025-2030 (%)
Data Table on Others - Year-over-year growth 2025-2030 (%)

9.8 Market opportunity by End-user

Market opportunity by End-user ($ million)
Data Table on Market opportunity by End-user ($ million)

10. Market Segmentation by Product Type

10.1 Market segments

Chart on Product Type - Market share 2025-2030 (%)
Data Table on Product Type - Market share 2025-2030 (%)

10.2 Comparison by Product Type

Chart on Comparison by Product Type
Data Table on Comparison by Product Type

10.3 Short-range - Market size and forecast 2025-2030

Chart on Short-range - Market size and forecast 2025-2030 ($ million)
Data Table on Short-range - Market size and forecast 2025-2030 ($ million)
Chart on Short-range - Year-over-year growth 2025-2030 (%)
Data Table on Short-range - Year-over-year growth 2025-2030 (%)

10.4 Medium-range - Market size and forecast 2025-2030

Chart on Medium-range - Market size and forecast 2025-2030 ($ million)
Data Table on Medium-range - Market size and forecast 2025-2030 ($ million)
Chart on Medium-range - Year-over-year growth 2025-2030 (%)
Data Table on Medium-range - Year-over-year growth 2025-2030 (%)

10.5 Long-range - Market size and forecast 2025-2030

Chart on Long-range - Market size and forecast 2025-2030 ($ million)
Data Table on Long-range - Market size and forecast 2025-2030 ($ million)
Chart on Long-range - Year-over-year growth 2025-2030 (%)
Data Table on Long-range - Year-over-year growth 2025-2030 (%)

10.6 Market opportunity by Product Type

Market opportunity by Product Type ($ million)
Data Table on Market opportunity by Product Type ($ million)

11. Customer Landscape

11.1 Customer landscape overview

Analysis of price sensitivity, lifecycle, customer purchase basket, adoption rates, and purchase criteria

12. Geographic Landscape

12.1 Geographic segmentation

Chart on Market share by geography 2025-2030 (%)
Data Table on Market share by geography 2025-2030 (%)

12.2 Geographic comparison

Chart on Geographic comparison
Data Table on Geographic comparison

12.3 APAC - Market size and forecast 2025-2030

Chart on APAC - Market size and forecast 2025-2030 ($ million)
Data Table on APAC - Market size and forecast 2025-2030 ($ million)
Chart on APAC - Year-over-year growth 2025-2030 (%)
Data Table on APAC - Year-over-year growth 2025-2030 (%)
Chart on Regional Comparison - APAC
Data Table on Regional Comparison - APAC

12.3.1 China - Market size and forecast 2025-2030

Chart on China - Market size and forecast 2025-2030 ($ million)
Data Table on China - Market size and forecast 2025-2030 ($ million)
Chart on China - Year-over-year growth 2025-2030 (%)
Data Table on China - Year-over-year growth 2025-2030 (%)

12.3.2 Japan - Market size and forecast 2025-2030

Chart on Japan - Market size and forecast 2025-2030 ($ million)
Data Table on Japan - Market size and forecast 2025-2030 ($ million)
Chart on Japan - Year-over-year growth 2025-2030 (%)
Data Table on Japan - Year-over-year growth 2025-2030 (%)

12.3.3 India - Market size and forecast 2025-2030

Chart on India - Market size and forecast 2025-2030 ($ million)
Data Table on India - Market size and forecast 2025-2030 ($ million)
Chart on India - Year-over-year growth 2025-2030 (%)
Data Table on India - Year-over-year growth 2025-2030 (%)

12.3.4 South Korea - Market size and forecast 2025-2030

Chart on South Korea - Market size and forecast 2025-2030 ($ million)
Data Table on South Korea - Market size and forecast 2025-2030 ($ million)
Chart on South Korea - Year-over-year growth 2025-2030 (%)
Data Table on South Korea - Year-over-year growth 2025-2030 (%)

12.3.5 Australia - Market size and forecast 2025-2030

Chart on Australia - Market size and forecast 2025-2030 ($ million)
Data Table on Australia - Market size and forecast 2025-2030 ($ million)
Chart on Australia - Year-over-year growth 2025-2030 (%)
Data Table on Australia - Year-over-year growth 2025-2030 (%)

12.3.6 Indonesia - Market size and forecast 2025-2030

Chart on Indonesia - Market size and forecast 2025-2030 ($ million)
Data Table on Indonesia - Market size and forecast 2025-2030 ($ million)
Chart on Indonesia - Year-over-year growth 2025-2030 (%)
Data Table on Indonesia - Year-over-year growth 2025-2030 (%)

12.4 North America - Market size and forecast 2025-2030

Chart on North America - Market size and forecast 2025-2030 ($ million)
Data Table on North America - Market size and forecast 2025-2030 ($ million)
Chart on North America - Year-over-year growth 2025-2030 (%)
Data Table on North America - Year-over-year growth 2025-2030 (%)
Chart on Regional Comparison - North America
Data Table on Regional Comparison - North America

12.4.1 US - Market size and forecast 2025-2030

Chart on US - Market size and forecast 2025-2030 ($ million)
Data Table on US - Market size and forecast 2025-2030 ($ million)
Chart on US - Year-over-year growth 2025-2030 (%)
Data Table on US - Year-over-year growth 2025-2030 (%)

12.4.2 Canada - Market size and forecast 2025-2030

Chart on Canada - Market size and forecast 2025-2030 ($ million)
Data Table on Canada - Market size and forecast 2025-2030 ($ million)
Chart on Canada - Year-over-year growth 2025-2030 (%)
Data Table on Canada - Year-over-year growth 2025-2030 (%)

12.4.3 Mexico - Market size and forecast 2025-2030

Chart on Mexico - Market size and forecast 2025-2030 ($ million)
Data Table on Mexico - Market size and forecast 2025-2030 ($ million)
Chart on Mexico - Year-over-year growth 2025-2030 (%)
Data Table on Mexico - Year-over-year growth 2025-2030 (%)

12.5 Europe - Market size and forecast 2025-2030

Chart on Europe - Market size and forecast 2025-2030 ($ million)
Data Table on Europe - Market size and forecast 2025-2030 ($ million)
Chart on Europe - Year-over-year growth 2025-2030 (%)
Data Table on Europe - Year-over-year growth 2025-2030 (%)
Chart on Regional Comparison - Europe
Data Table on Regional Comparison - Europe

12.5.1 Germany - Market size and forecast 2025-2030

Chart on Germany - Market size and forecast 2025-2030 ($ million)
Data Table on Germany - Market size and forecast 2025-2030 ($ million)
Chart on Germany - Year-over-year growth 2025-2030 (%)
Data Table on Germany - Year-over-year growth 2025-2030 (%)

12.5.2 UK - Market size and forecast 2025-2030

Chart on UK - Market size and forecast 2025-2030 ($ million)
Data Table on UK - Market size and forecast 2025-2030 ($ million)
Chart on UK - Year-over-year growth 2025-2030 (%)
Data Table on UK - Year-over-year growth 2025-2030 (%)

12.5.3 France - Market size and forecast 2025-2030

Chart on France - Market size and forecast 2025-2030 ($ million)
Data Table on France - Market size and forecast 2025-2030 ($ million)
Chart on France - Year-over-year growth 2025-2030 (%)
Data Table on France - Year-over-year growth 2025-2030 (%)

12.5.4 Italy - Market size and forecast 2025-2030

Chart on Italy - Market size and forecast 2025-2030 ($ million)
Data Table on Italy - Market size and forecast 2025-2030 ($ million)
Chart on Italy - Year-over-year growth 2025-2030 (%)
Data Table on Italy - Year-over-year growth 2025-2030 (%)

12.5.5 Spain - Market size and forecast 2025-2030

Chart on Spain - Market size and forecast 2025-2030 ($ million)
Data Table on Spain - Market size and forecast 2025-2030 ($ million)
Chart on Spain - Year-over-year growth 2025-2030 (%)
Data Table on Spain - Year-over-year growth 2025-2030 (%)

12.5.6 The Netherlands - Market size and forecast 2025-2030

Chart on The Netherlands - Market size and forecast 2025-2030 ($ million)
Data Table on The Netherlands - Market size and forecast 2025-2030 ($ million)
Chart on The Netherlands - Year-over-year growth 2025-2030 (%)
Data Table on The Netherlands - Year-over-year growth 2025-2030 (%)

12.6 South America - Market size and forecast 2025-2030

Chart on South America - Market size and forecast 2025-2030 ($ million)
Data Table on South America - Market size and forecast 2025-2030 ($ million)
Chart on South America - Year-over-year growth 2025-2030 (%)
Data Table on South America - Year-over-year growth 2025-2030 (%)
Chart on Regional Comparison - South America
Data Table on Regional Comparison - South America

12.6.1 Brazil - Market size and forecast 2025-2030

Chart on Brazil - Market size and forecast 2025-2030 ($ million)
Data Table on Brazil - Market size and forecast 2025-2030 ($ million)
Chart on Brazil - Year-over-year growth 2025-2030 (%)
Data Table on Brazil - Year-over-year growth 2025-2030 (%)

12.6.2 Argentina - Market size and forecast 2025-2030

Chart on Argentina - Market size and forecast 2025-2030 ($ million)
Data Table on Argentina - Market size and forecast 2025-2030 ($ million)
Chart on Argentina - Year-over-year growth 2025-2030 (%)
Data Table on Argentina - Year-over-year growth 2025-2030 (%)

12.6.3 Chile - Market size and forecast 2025-2030

Chart on Chile - Market size and forecast 2025-2030 ($ million)
Data Table on Chile - Market size and forecast 2025-2030 ($ million)
Chart on Chile - Year-over-year growth 2025-2030 (%)
Data Table on Chile - Year-over-year growth 2025-2030 (%)

12.7 Middle East and Africa - Market size and forecast 2025-2030

Chart on Middle East and Africa - Market size and forecast 2025-2030 ($ million)
Data Table on Middle East and Africa - Market size and forecast 2025-2030 ($ million)
Chart on Middle East and Africa - Year-over-year growth 2025-2030 (%)
Data Table on Middle East and Africa - Year-over-year growth 2025-2030 (%)
Chart on Regional Comparison - Middle East and Africa
Data Table on Regional Comparison - Middle East and Africa

12.7.1 Saudi Arabia - Market size and forecast 2025-2030

Chart on Saudi Arabia - Market size and forecast 2025-2030 ($ million)
Data Table on Saudi Arabia - Market size and forecast 2025-2030 ($ million)
Chart on Saudi Arabia - Year-over-year growth 2025-2030 (%)
Data Table on Saudi Arabia - Year-over-year growth 2025-2030 (%)

12.7.2 UAE - Market size and forecast 2025-2030

Chart on UAE - Market size and forecast 2025-2030 ($ million)
Data Table on UAE - Market size and forecast 2025-2030 ($ million)
Chart on UAE - Year-over-year growth 2025-2030 (%)
Data Table on UAE - Year-over-year growth 2025-2030 (%)

12.7.3 South Africa - Market size and forecast 2025-2030

Chart on South Africa - Market size and forecast 2025-2030 ($ million)
Data Table on South Africa - Market size and forecast 2025-2030 ($ million)
Chart on South Africa - Year-over-year growth 2025-2030 (%)
Data Table on South Africa - Year-over-year growth 2025-2030 (%)

12.7.4 Israel - Market size and forecast 2025-2030

Chart on Israel - Market size and forecast 2025-2030 ($ million)
Data Table on Israel - Market size and forecast 2025-2030 ($ million)
Chart on Israel - Year-over-year growth 2025-2030 (%)
Data Table on Israel - Year-over-year growth 2025-2030 (%)

12.7.5 Turkey - Market size and forecast 2025-2030

Chart on Turkey - Market size and forecast 2025-2030 ($ million)
Data Table on Turkey - Market size and forecast 2025-2030 ($ million)
Chart on Turkey - Year-over-year growth 2025-2030 (%)
Data Table on Turkey - Year-over-year growth 2025-2030 (%)

12.8 Market opportunity by geography

Market opportunity by geography ($ million)
Data Tables on Market opportunity by geography ($ million)

13. Drivers, Challenges, and Opportunity

13.1 Market drivers

Heightened emphasis on quality control and automated inspection in manufacturing sectors
Continuous technological innovation and miniaturization enhancing accessibility
Growing adoption and expanding applications within healthcare and medical sectors

13.2 Market challenges

High initial investment and total cost of ownership
Complexity of post-processing workflows and scarcity of skilled operators
Inherent implementational limitations with certain surface properties and geometries

13.3 Impact of drivers and challenges

Impact of drivers and challenges in 2025 and 2030

13.4 Market opportunities

Integration of artificial intelligence and machine learning for enhanced data processing
Proliferation of portable and handheld scanning solutions
Deepening synergy with additive manufacturing and digital twin technologies

14. Competitive Landscape

14.1 Overview

14.2

Overview on criticality of inputs and factors of differentiation

14.3 Landscape disruption

Overview on factors of disruption

14.4 Industry risks

Impact of key risks on business

15. Competitive Analysis

15.1 Companies profiled

Companies covered

15.2 Company ranking index

15.3 Market positioning of companies

Matrix on companies position and classification

15.4 Artec Europe Sarl

Artec Europe Sarl - Overview
Artec Europe Sarl - Product / Service
Artec Europe Sarl - Key offerings
SWOT

15.5 Carl Zeiss AG

Carl Zeiss AG - Overview
Carl Zeiss AG - Product / Service
Carl Zeiss AG - Key offerings
SWOT

15.6 Creaform Inc.

Creaform Inc. - Overview
Creaform Inc. - Product / Service
Creaform Inc. - Key offerings
SWOT

15.7 Hexagon AB

Hexagon AB - Overview
Hexagon AB - Business segments
Hexagon AB - Key news
Hexagon AB - Key offerings
Hexagon AB - Segment focus
SWOT

15.8 Keyence Corp.

Keyence Corp. - Overview
Keyence Corp. - Product / Service
Keyence Corp. - Key offerings
SWOT

15.9 Maptek Pty Ltd.

Maptek Pty Ltd. - Overview
Maptek Pty Ltd. - Product / Service
Maptek Pty Ltd. - Key offerings
SWOT

15.10 Matterport Inc.

Matterport Inc. - Overview
Matterport Inc. - Product / Service
Matterport Inc. - Key offerings
SWOT

15.11 Medit Corp.

Medit Corp. - Overview
Medit Corp. - Product / Service
Medit Corp. - Key offerings
SWOT

15.12 Nikon Corp.

Nikon Corp. - Overview
Nikon Corp. - Business segments
Nikon Corp. - Key offerings
Nikon Corp. - Segment focus
SWOT

15.13 Quality Vision International Inc.

Quality Vision International Inc. - Overview
Quality Vision International Inc. - Product / Service
Quality Vision International Inc. - Key offerings
SWOT

15.14 Scantech Hangzhou Co. Ltd.

Scantech Hangzhou Co. Ltd. - Overview
Scantech Hangzhou Co. Ltd. - Product / Service
Scantech Hangzhou Co. Ltd. - Key offerings
SWOT

15.15 Shining 3D Tech Co. Ltd.

Shining 3D Tech Co. Ltd. - Overview
Shining 3D Tech Co. Ltd. - Product / Service
Shining 3D Tech Co. Ltd. - Key offerings
SWOT

15.16 Tesca Technologies Pvt. Ltd.

Tesca Technologies Pvt. Ltd. - Overview
Tesca Technologies Pvt. Ltd. - Product / Service
Tesca Technologies Pvt. Ltd. - Key offerings
SWOT

15.17 Topcon Positioning Systems Inc.

Topcon Positioning Systems Inc. - Overview
Topcon Positioning Systems Inc. - Product / Service
Topcon Positioning Systems Inc. - Key offerings
SWOT

15.18 Trimble Inc.

Trimble Inc. - Overview
Trimble Inc. - Business segments
Trimble Inc. - Key offerings
Trimble Inc. - Segment focus
SWOT

16. Appendix

16.1 Scope of the report

Market definition
Objectives
Notes and caveats

16.2 Inclusions and exclusions checklist

Inclusions checklist
Exclusions checklist

16.3 Currency conversion rates for US$

16.4 Research methodology

16.5 Data procurement

Information sources

16.6 Data validation

16.7 Validation techniques employed for market sizing

16.8 Data synthesis

16.9 360 degree market analysis

16.10 List of abbreviations

Research Methodology

Technavio presents a detailed picture of the market by way of study, synthesis, and summation of data from multiple sources. The analysts have presented the various facets of the market with a particular focus on identifying the key industry influencers. The data thus presented is comprehensive, reliable, and the result of extensive research, both primary and secondary.

INFORMATION SOURCES

Primary sources

  • Manufacturers and suppliers
  • Channel partners
  • Industry experts
  • Strategic decision makers

Secondary sources

  • Industry journals and periodicals
  • Government data
  • Financial reports of key industry players
  • Historical data
  • Press releases

DATA ANALYSIS

Data Synthesis

  • Collation of data
  • Estimation of key figures
  • Analysis of derived insights

Data Validation

  • Triangulation with data models
  • Reference against proprietary databases
  • Corroboration with industry experts

REPORT WRITING

Qualitative

  • Market drivers
  • Market challenges
  • Market trends
  • Five forces analysis

Quantitative

  • Market size and forecast
  • Market segmentation
  • Geographical insights
  • Competitive landscape

Interested in this report?

Get your sample now to see our research methodology and insights!

Download Now

Frequently Asked Questions

3D Scanner market growth will increase by USD 6379.3 million during 2026-2030.

The 3D Scanner market is expected to grow at a CAGR of 12.8% during 2026-2030.

3D Scanner market is segmented by Technology (Laser triangulation, Structured light) End-user (Industrial manufacturing, Healthcare, Architecture and engineering, Aerospace and defense, Others) Product type (Short-range, Medium-range, Long-range)

Artec Europe Sarl, Basis Software Inc., Carl Zeiss AG, Creaform Inc., Evatronix SA, Hexagon AB, Keyence Corp., Maptek Pty Ltd., Matterport Inc., Medit Corp., Metronor AS, Nikon Corp., Quality Vision International Inc., RIEGL Laser Measurement Systems, Scantech Hangzhou Co. Ltd., Shining 3D Tech Co. Ltd., Tesca Technologies Pvt. Ltd., Topcon Positioning Systems Inc., Trimble Inc., Zoller and Frohlich GmbH are a few of the key vendors in the 3D Scanner market.

APAC will register the highest growth rate of 37.3% among the other regions. Therefore, the 3D Scanner market in APAC is expected to garner significant business opportunities for the vendors during the forecast period.

China, Japan, India, South Korea, Australia, Indonesia, US, Canada, Mexico, Germany, UK, France, Italy, Spain, The Netherlands, Brazil, Argentina, Chile, Saudi Arabia, UAE, South Africa, Israel, Turkey

  • Heightened emphasis on quality control and automated inspection in manufacturing sectors is the driving factor this market.

The 3D Scanner market vendors should focus on grabbing business opportunities from the Technology segment as it accounted for the largest market share in the base year.
RIA - Research AI Assistant
Ask RIA