5G Smart Retail Market Size 2024-2028
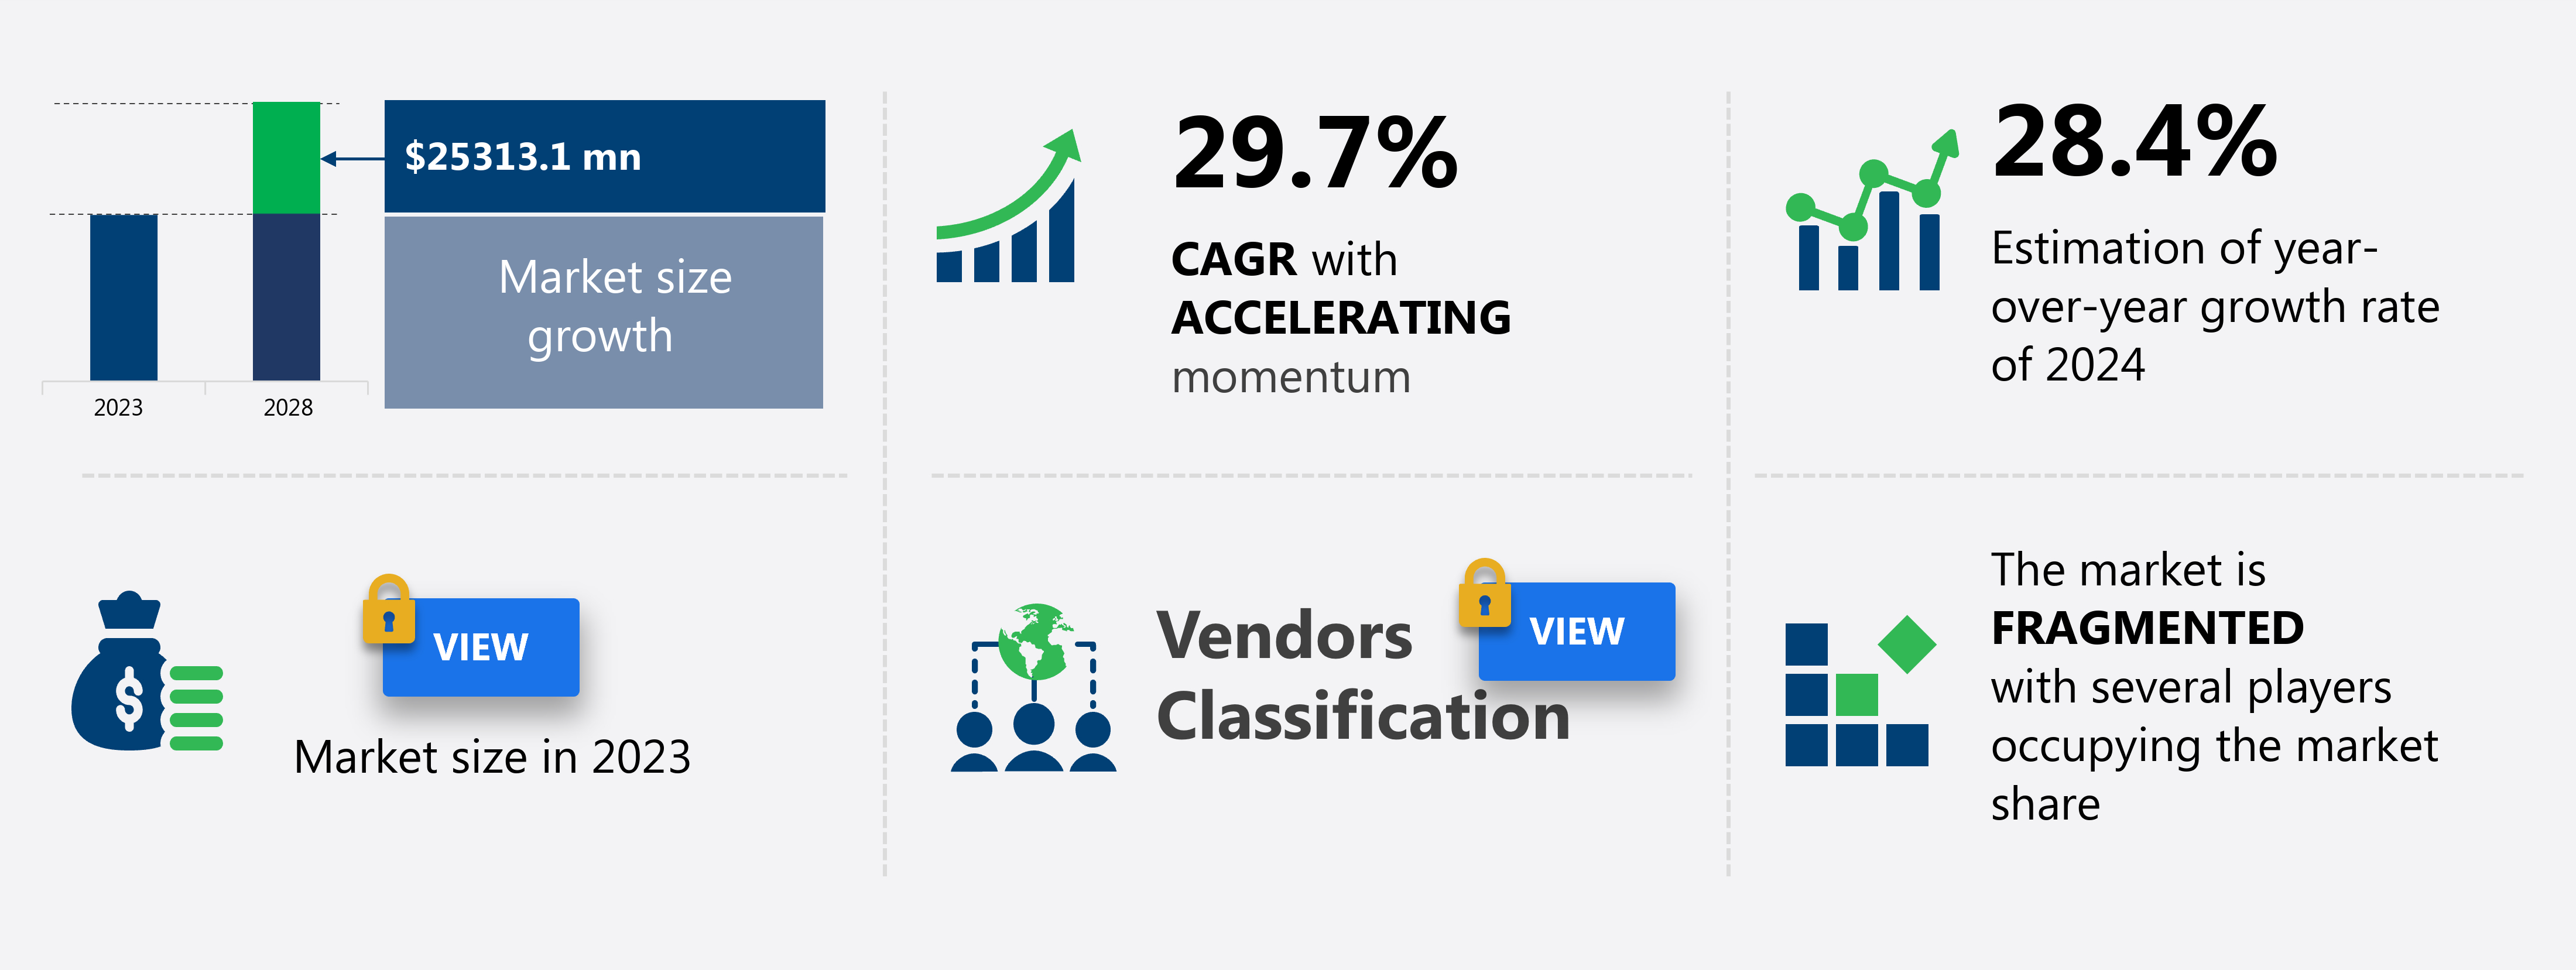
The 5G smart retail market size is forecast to increase by USD 25.31 billion at a CAGR of 29.7% between 2023 and 2028.
- The market is experiencing significant growth, driven by the demand for faster Internet access and the integration of augmented and virtual reality technologies. This technological advancement is revolutionizing the retail industry, particularly in sectors such as tufting and the silk road trade network. The adoption of 5G technology enables process automation, leading to increased efficiency in manufacturing workflows and the production of flexible, high-quality cloth using both artificial materials and natural fibers. 5G will facilitate the integration of advanced technologies such as IoT sensors, AI, and machine learning.
- While the investment needed to implement these technologies is significant, the potential benefitsâsuch as enhanced customer experience and greater market competitivenessâare equally substantial. This trend mirrors the ongoing industrial revolution, where technology is reshaping traditional industries and unlocking new opportunities.
What will be the 5G Smart Retail Market Size During the Forecast Period?

Request Free Sample
- The textile industry, a significant contributor to the global economy, traces its roots back to prehistoric times. From weaving clothing and creating carpets to the intricate manufacturing processes of the modern era, textile production has played a pivotal role in human comfort, survival, and culture. However, the industry has faced challenges, including exploitation of factory workers and safety concerns, such as the Rana Plaza collapse in 2013. In the present day, textile production processes encompass various stages, including fiber production, spinning, weaving, dyeing, printing, and finishing. Inventory management is crucial to ensure seamless production and delivery of high-quality textiles.
- In addition, traditional textile manufacturing relied on manual processes, which were time-consuming and inefficient. The advent of 5G technology is set to revolutionize textile production, enabling real-time communication and automation. This technology will optimize each stage of the textile production process, from fiber to finished clothing. These technologies will optimize fiber production by monitoring environmental conditions, ensuring consistent quality and reducing wastage. The spinning process will benefit from real-time monitoring, enabling adjustments to maintain optimal conditions and increase efficiency. The dyeing and printing stages will experience significant improvements with 5G.
How is this market segmented and which is the largest segment?
The market research report provides comprehensive data (region-wise segment analysis), with forecasts and estimates in "USD billion" for the period 2024-2028, as well as historical data from 2018-2022 for the following segments.
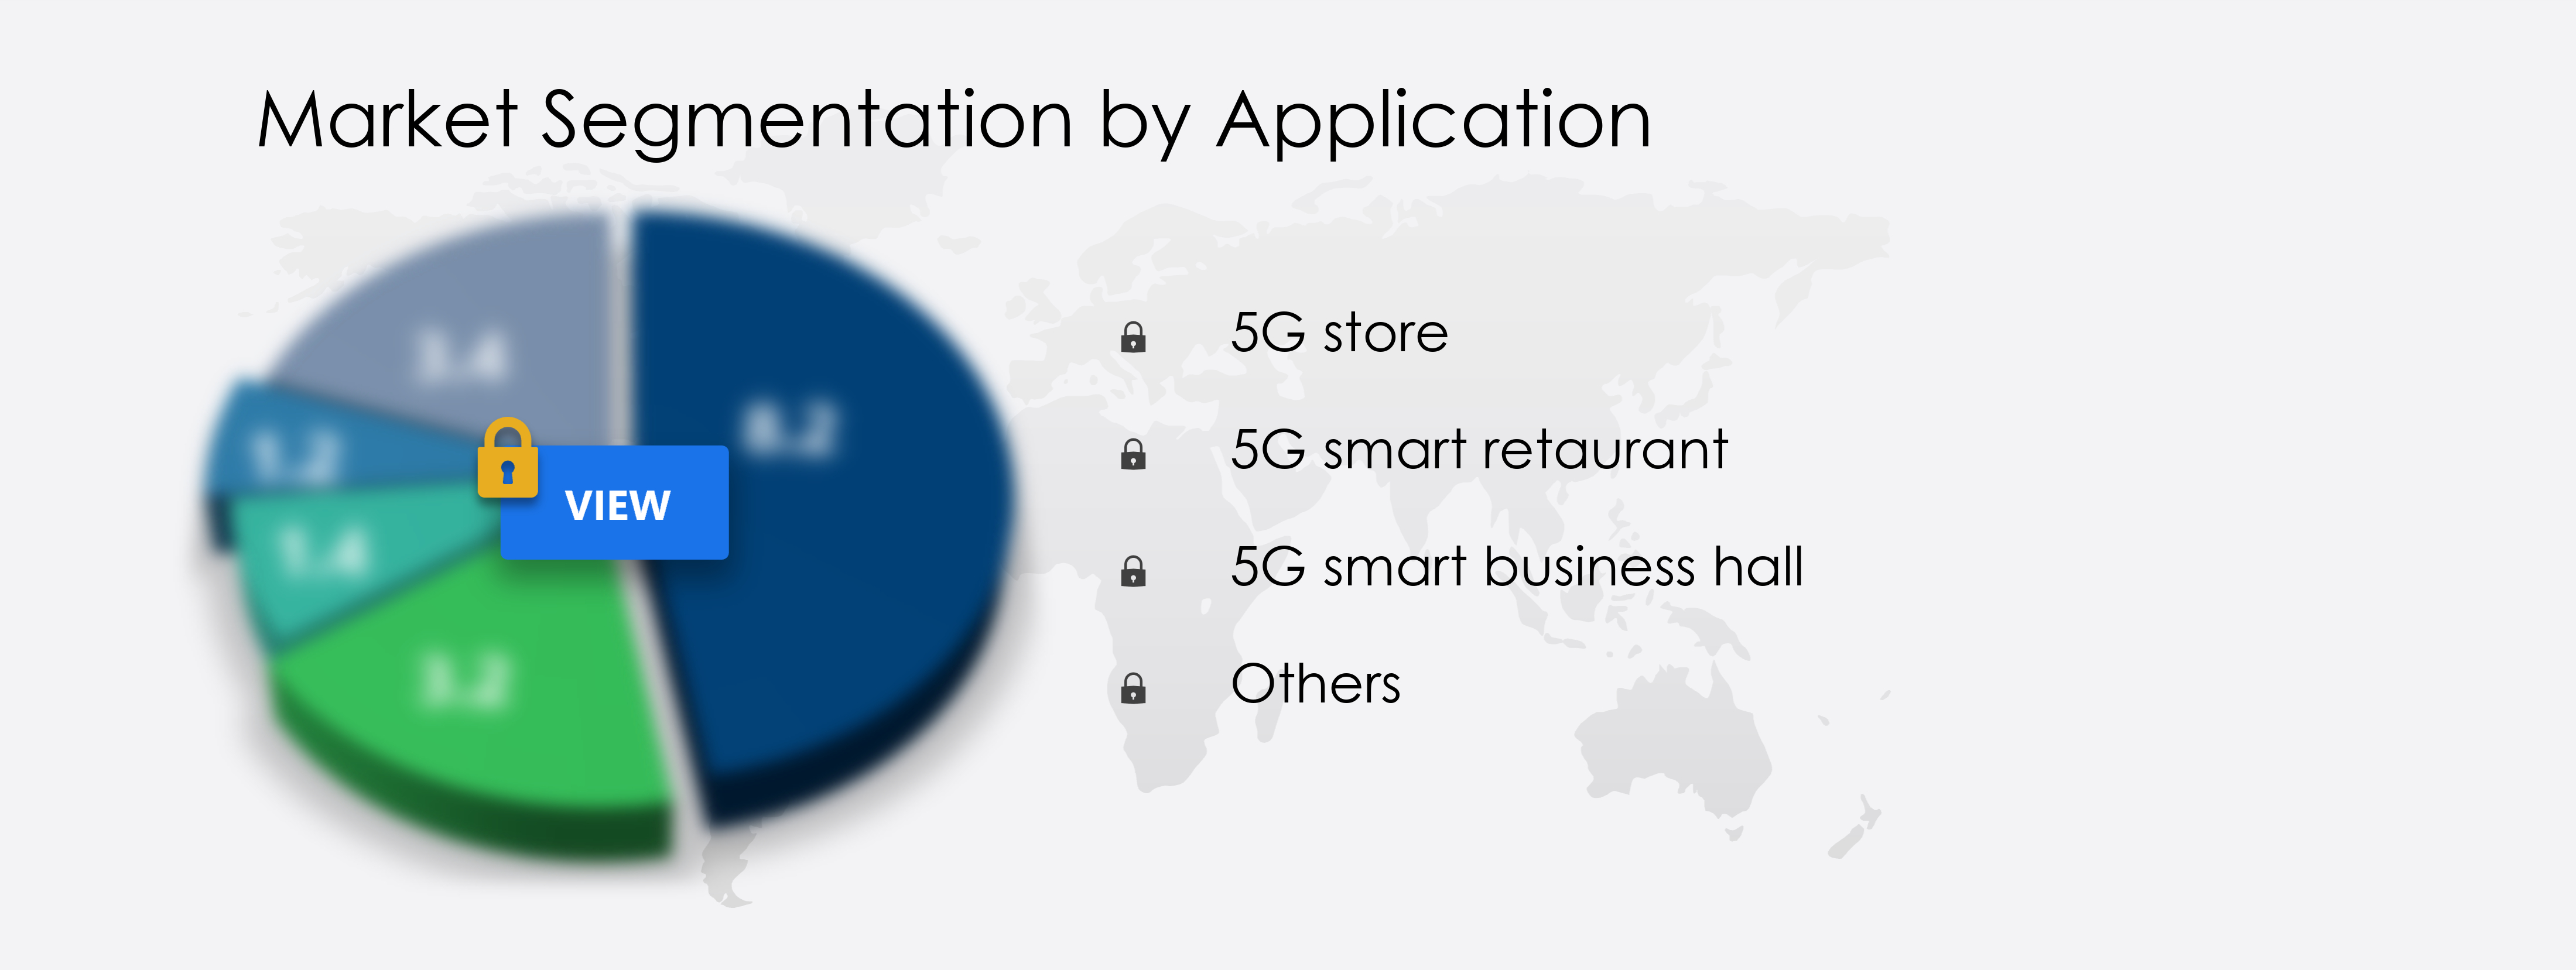
- Application
- 5G store
- 5G smart retaurant
- 5G smart business hall
- Others
- Component
- Hardware
- Software
- Services
- Geography
- APAC
- China
- India
- Japan
- South Korea
- North America
- Europe
- Middle East and Africa
- South America
By Application Insights
- The 5G store segment is estimated to witness significant growth during the forecast period.
In the realm of 5G smart retail, the implementation of advanced hardware solutions is pivotal for facilitating uninterrupted and secure connectivity in retail environments. A 5G wireless edge networking solution serves as an economical and adaptable substitute for conventional wired connections, especially for retailers managing multiple storefronts. These advanced solutions encompass essential functionalities such as Software-Defined Wide Area Network (SD-WAN) capabilities, effortless Virtual Private Network (VPN) setup, Wi-Fi integration, routing, and integrated security services like firewalls. Retailers reap the rewards of cloud-based network management tools, enabling centralized monitoring and problem-solving, thereby diminishing the requirement for on-site service calls and minimizing downtime.
In addition, with the advent of 5G technology, retailers can swiftly introduce services such as point-of-sale (POS) systems in new locations, offering the freedom to establish operations in diverse locations with ease. By adopting these innovative 5G solutions, retailers can elevate their fashion offerings, from artificial fibers in thread to fashionable shoes, while minimizing the environmental impact by recycling torn and damaged textiles, ultimately reducing the volume of textiles that would otherwise end up in landfills.

Get a glance at the market report of share of various segments Request Free Sample
Market Dynamics
Our market researchers analyzed the data with 2023 as the base year, along with the key drivers, trends, and challenges. A holistic analysis of drivers will help companies refine their marketing strategies to gain a competitive advantage.
What are the key market drivers leading to the rise in adoption of 5G Retail Market?
Efforts for faster Internet access is the key driver of the market.
- The demand for swift Internet connectivity is significantly propelling the expansion of the market. This growth is driven by the increasing requirement for dependable high-speed networks to support data-heavy applications, such as cloud computing, IoT devices, and video streaming. In the textile industry, for instance, the need for real-time inventory management and seamless communication between factory workers and suppliers is becoming increasingly essential. The Rana Plaza collapse in 2013 highlighted the importance of transparency and efficiency in textile production, from fiber to yarn, fabric dying, printing, and clothing manufacturing. To meet this need, numerous organizations are investing in expanding broadband and 5G networks.
- In addition, for example, Bharti Global and the UK government-backed OneWeb recently launched 36 communications satellites to provide high-speed internet in India by mid-2022. This is part of a broader initiative to offer global services from a constellation of Low Earth Orbit (LEO) satellites, with service availability expanding to regions such as the UK, Northern Europe, and parts of Canada. By enhancing connectivity, the 5G smart retail industry aims to streamline operations, reduce costs, and improve overall productivity.
What are the market trends shaping the 5G Retail Market?
Merging of augmented and virtual reality technologies is the upcoming trend in the market.
- The market is experiencing a significant transformation as augmented reality (AR) and virtual reality (VR) technologies merge, providing consumers with enhanced shopping experiences. This fusion, made possible by the high-speed and flexible 5G networks, enables customers to participate in mixed reality interactions, such as virtually testing clothing options in 3D without the necessity for numerous physical alterations. This feature not only saves time but also boosts customer satisfaction. Beyond enriching virtual fitting rooms, retailers are incorporating smart carts and self-checkout kiosks, empowering customers to complete transactions efficiently without extended wait times. The convenience of mobile payment applications and credit card swipes further simplifies the shopping process.
- In addition, the industrial revolution of the retail sector is underway, with process automation and advanced technologies like Tufting, a weaving technique, and the integration of artificial materials and natural fibers, such as silk, into the trade network. This evolution is poised to revolutionize the way we produce and consume goods, offering a more flexible and efficient shopping experience.
What challenges does 5G Retail Market face during the growth?
Significant investment requirements is a key challenge affecting the market growth.
- The integration of 5G technology in retail is a significant investment, necessitating substantial resources for infrastructure development. IoT devices, automation solutions, and advanced security systems are among the technologies requiring investment. The cost of creating a mobile application for retail businesses starts at approximately USD 50,000. Beyond app development, retailers must also account for the expenses related to purchasing, installing, and configuring various smart technologies. For example, the price range for smart mirrors, which are gaining popularity in retail environments, varies based on features, size, and brand. High-end smart mirrors featuring advanced functionalities like voice assistants and gesture controls can cost between USD 500 and USD 2,000 per unit.
In addition, textile production processes, such as spinning, dyeing, knitting, bonding, embroidery, and felting, can also benefit from 5G technology's enhanced connectivity and speed. However, the initial investment required for implementing these technologies may pose a challenge for some retailers.
Exclusive Customer Landscape
The market forecasting report includes the adoption lifecycle of the market, covering from the innovator's stage to the laggard's stage. It focuses on adoption rates in different regions based on penetration. Furthermore, the market report also includes key purchase criteria and drivers of price sensitivity to help companies evaluate and develop their market growth analysis strategies.
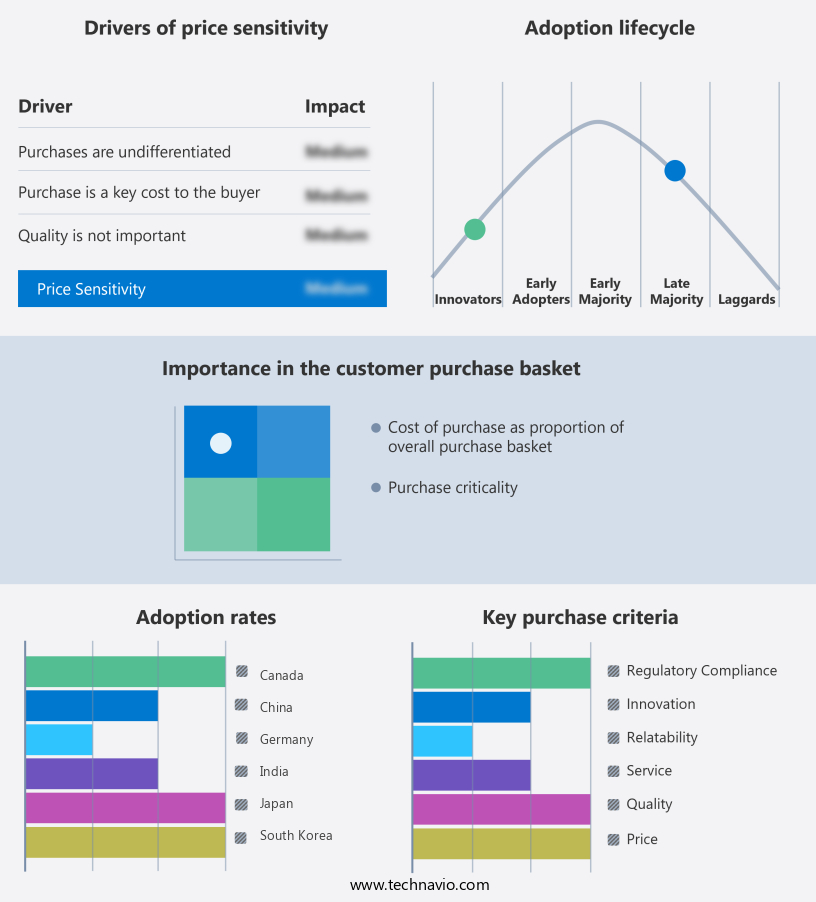
Customer Landscape
Key Companies & Market Insights
Companies are implementing various strategies, such as strategic alliances, market forecast, partnerships, mergers and acquisitions, geographical expansion, and product/service launches, to enhance their presence in the market.
The market research and growth report includes detailed analyses of the competitive landscape of the market and information about key companies, including:
- AT and T Inc.
- Cisco Systems Inc.
- EMARKETER Inc
- Fibocom Wireless Inc.
- Hitachi Energy Ltd.
- Huawei Technologies Co. Ltd.
- Intel Corp.
- MobileCorp
- Movandi Corp.
- Oracle Corp.
- Qualcomm Inc.
- Reliance Jio Infocomm Ltd
- Singapore Telecommunications Ltd.
- T Mobile US Inc.
- Tata Consultancy Services Ltd.
- Telefonaktiebolaget LM Ericsson
- Telit Cinterion
- Vapor IO Inc.
- Verizon Communications Inc.
- Wipro Ltd.
Qualitative and quantitative analysis of companies has been conducted to help clients understand the wider business environment as well as the strengths and weaknesses of key market players. Data is qualitatively analyzed to categorize companies as pure play, category-focused, industry-focused, and diversified; it is quantitatively analyzed to categorize companies as dominant, leading, strong, tentative, and weak.
Research Analyst Overview
In the realm of commerce, the textile industry holds a significant place in human history, tracing back to prehistoric times when people wove clothing from natural fibers like wool and cotton. Over the centuries, textile production evolved from manual weaving to complex manufacturing processes, leading to an increase in comfort and cultural expression. However, this progress came with its challenges, including the exploitation of factory workers and the Rana Plaza collapse, highlighting the need for ethical business practices. Today, the smart retail market is revolutionizing textile production with advanced technology. From fiber to finished garments, every stage of the process is being automated, from spinning and dyeing to knitting and embroidery.
Furthermore, natural fibers like cotton, wool, and silk are being blended with artificial materials to create flexible, durable, and fashionable textiles. The textile industry's future lies in sustainable practices, with a focus on recycling and reusing textile waste. Clothes that are torn or damaged can be sorted, graded, and reused, while industrial wipers, sound insulation panels, and mattress fillings can be made from reclaimed fibers. The textile industry's cultural significance continues to grow, with technology playing a crucial role in preserving traditional techniques and creating new ones.
|
Market Scope
|
|
Report Coverage
|
Details
|
|
Page number
|
204
|
|
Base year
|
2023
|
|
Historic period
|
2018-2022 |
|
Forecast period
|
2024-2028
|
|
Growth momentum & CAGR
|
Accelerate at a CAGR of 29.7%
|
|
Market growth 2024-2028
|
USD 25.31 billion
|
|
Market structure
|
Fragmented
|
|
YoY growth 2023-2024(%)
|
28.4
|
|
Key countries
|
China, Japan, South Korea, India, Germany, UK, Spain, US, Canada, and United Arab Emirates
|
|
Competitive landscape
|
Leading Companies, Market Positioning of Companies, Competitive Strategies, and Industry Risks
|
Request Free Sample
What are the Key Data Covered in this Market Research and Growth Report?
- CAGR of the market during the forecast period
- Detailed information on factors that will drive the market growth and forecasting between 2024 and 2028
- Precise estimation of the size of the market and its contribution of the market in focus to the parent market
- Accurate predictions about upcoming market growth and trends and changes in consumer behaviour
- Growth of the market across APAC, North America, Europe, Middle East and Africa, and South America
- Thorough analysis of the market's competitive landscape and detailed information about companies
- Comprehensive analysis of factors that will challenge the growth of market companies
We can help! Our analysts can customize this market research report to meet your requirements. Get in touch
1 Executive Summary
- 1.1 Market overview
- Executive Summary - Chart on Market Overview
- Executive Summary - Data Table on Market Overview
- Executive Summary - Chart on Global Market Characteristics
- Executive Summary - Chart on Market by Geography
- Executive Summary - Chart on Market Segmentation by Application
- Executive Summary - Chart on Market Segmentation by Component
- Executive Summary - Chart on Incremental Growth
- Executive Summary - Data Table on Incremental Growth
- Executive Summary - Chart on Company Market Positioning
2 Technavio Analysis
- 2.1 Analysis of price sensitivity, lifecycle, customer purchase basket, adoption rates, and purchase criteria
- Analysis of price sensitivity, lifecycle, customer purchase basket, adoption rates, and purchase criteria
- 2.2 Criticality of inputs and Factors of differentiation
- Overview on criticality of inputs and factors of differentiation
- 2.3 Factors of disruption
- Overview on factors of disruption
- 2.4 Impact of drivers and challenges
- Impact of drivers and challenges in 2023 and 2028
3 Market Landscape
- 3.1 Market ecosystem
- Parent Market
- Data Table on - Parent Market
- 3.2 Market characteristics
- Market characteristics analysis
4 Market Sizing
- 4.1 Market definition
- Offerings of companies included in the market definition
- 4.2 Market segment analysis
- 4.4 Market outlook: Forecast for 2023-2028
- Chart on Global - Market size and forecast 2023-2028 ($ million)
- Data Table on Global - Market size and forecast 2023-2028 ($ million)
- Chart on Global Market: Year-over-year growth 2023-2028 (%)
- Data Table on Global Market: Year-over-year growth 2023-2028 (%)
5 Qualitative Analysis
- 5.1 Impact of Artificial Intelligence (AI) on global 5G smart retail market
6 Five Forces Analysis
- 6.1 Five forces summary
- Five forces analysis - Comparison between 2023 and 2028
- 6.2 Bargaining power of buyers
- Bargaining power of buyers - Impact of key factors 2023 and 2028
- 6.3 Bargaining power of suppliers
- Bargaining power of suppliers - Impact of key factors in 2023 and 2028
- 6.4 Threat of new entrants
- Threat of new entrants - Impact of key factors in 2023 and 2028
- 6.5 Threat of substitutes
- Threat of substitutes - Impact of key factors in 2023 and 2028
- 6.6 Threat of rivalry
- Threat of rivalry - Impact of key factors in 2023 and 2028
- 6.7 Market condition
- Chart on Market condition - Five forces 2023 and 2028
7 Market Segmentation by Application
- 7.1 Market segments
- Chart on Application - Market share 2023-2028 (%)
- Data Table on Application - Market share 2023-2028 (%)
- 7.2 Comparison by Application
- Chart on Comparison by Application
- Data Table on Comparison by Application
- 5G store - Market size and forecast 2023-2028
- Chart on 5G store - Market size and forecast 2023-2028 ($ million)
- Data Table on 5G store - Market size and forecast 2023-2028 ($ million)
- Chart on 5G store - Year-over-year growth 2023-2028 (%)
- Data Table on 5G store - Year-over-year growth 2023-2028 (%)
- 5G smart retaurant - Market size and forecast 2023-2028
- Chart on 5G smart retaurant - Market size and forecast 2023-2028 ($ million)
- Data Table on 5G smart retaurant - Market size and forecast 2023-2028 ($ million)
- Chart on 5G smart retaurant - Year-over-year growth 2023-2028 (%)
- Data Table on 5G smart retaurant - Year-over-year growth 2023-2028 (%)
- 5G smart business hall - Market size and forecast 2023-2028
- Chart on 5G smart business hall - Market size and forecast 2023-2028 ($ million)
- Data Table on 5G smart business hall - Market size and forecast 2023-2028 ($ million)
- Chart on 5G smart business hall - Year-over-year growth 2023-2028 (%)
- Data Table on 5G smart business hall - Year-over-year growth 2023-2028 (%)
- 7.6 Others - Market size and forecast 2023-2028
- Chart on Others - Market size and forecast 2023-2028 ($ million)
- Data Table on Others - Market size and forecast 2023-2028 ($ million)
- Chart on Others - Year-over-year growth 2023-2028 (%)
- Data Table on Others - Year-over-year growth 2023-2028 (%)
- 7.7 Market opportunity by Application
- Market opportunity by Application ($ million)
- Data Table on Market opportunity by Application ($ million)
8 Market Segmentation by Component
- 8.1 Market segments
- Chart on Component - Market share 2023-2028 (%)
- Data Table on Component - Market share 2023-2028 (%)
- 8.2 Comparison by Component
- Chart on Comparison by Component
- Data Table on Comparison by Component
- 8.3 Hardware - Market size and forecast 2023-2028
- Chart on Hardware - Market size and forecast 2023-2028 ($ million)
- Data Table on Hardware - Market size and forecast 2023-2028 ($ million)
- Chart on Hardware - Year-over-year growth 2023-2028 (%)
- Data Table on Hardware - Year-over-year growth 2023-2028 (%)
- 8.4 Software - Market size and forecast 2023-2028
- Chart on Software - Market size and forecast 2023-2028 ($ million)
- Data Table on Software - Market size and forecast 2023-2028 ($ million)
- Chart on Software - Year-over-year growth 2023-2028 (%)
- Data Table on Software - Year-over-year growth 2023-2028 (%)
- 8.5 Services - Market size and forecast 2023-2028
- Chart on Services - Market size and forecast 2023-2028 ($ million)
- Data Table on Services - Market size and forecast 2023-2028 ($ million)
- Chart on Services - Year-over-year growth 2023-2028 (%)
- Data Table on Services - Year-over-year growth 2023-2028 (%)
- 8.6 Market opportunity by Component
- Market opportunity by Component ($ million)
- Data Table on Market opportunity by Component ($ million)
9 Customer Landscape
- 9.1 Customer landscape overview
- Analysis of price sensitivity, lifecycle, customer purchase basket, adoption rates, and purchase criteria
10 Geographic Landscape
- 10.1 Geographic segmentation
- Chart on Market share by geography 2023-2028 (%)
- Data Table on Market share by geography 2023-2028 (%)
- 10.2 Geographic comparison
- Chart on Geographic comparison
- Data Table on Geographic comparison
- 10.3 APAC - Market size and forecast 2023-2028
- Chart on APAC - Market size and forecast 2023-2028 ($ million)
- Data Table on APAC - Market size and forecast 2023-2028 ($ million)
- Chart on APAC - Year-over-year growth 2023-2028 (%)
- Data Table on APAC - Year-over-year growth 2023-2028 (%)
- 10.4 North America - Market size and forecast 2023-2028
- Chart on North America - Market size and forecast 2023-2028 ($ million)
- Data Table on North America - Market size and forecast 2023-2028 ($ million)
- Chart on North America - Year-over-year growth 2023-2028 (%)
- Data Table on North America - Year-over-year growth 2023-2028 (%)
- 10.5 Europe - Market size and forecast 2023-2028
- Chart on Europe - Market size and forecast 2023-2028 ($ million)
- Data Table on Europe - Market size and forecast 2023-2028 ($ million)
- Chart on Europe - Year-over-year growth 2023-2028 (%)
- Data Table on Europe - Year-over-year growth 2023-2028 (%)
- 10.6 Middle East and Africa - Market size and forecast 2023-2028
- Chart on Middle East and Africa - Market size and forecast 2023-2028 ($ million)
- Data Table on Middle East and Africa - Market size and forecast 2023-2028 ($ million)
- Chart on Middle East and Africa - Year-over-year growth 2023-2028 (%)
- Data Table on Middle East and Africa - Year-over-year growth 2023-2028 (%)
- 10.7 South America - Market size and forecast 2023-2028
- Chart on South America - Market size and forecast 2023-2028 ($ million)
- Data Table on South America - Market size and forecast 2023-2028 ($ million)
- Chart on South America - Year-over-year growth 2023-2028 (%)
- Data Table on South America - Year-over-year growth 2023-2028 (%)
- 10.8 US - Market size and forecast 2023-2028
- Chart on US - Market size and forecast 2023-2028 ($ million)
- Data Table on US - Market size and forecast 2023-2028 ($ million)
- Chart on US - Year-over-year growth 2023-2028 (%)
- Data Table on US - Year-over-year growth 2023-2028 (%)
- 10.9 China - Market size and forecast 2023-2028
- Chart on China - Market size and forecast 2023-2028 ($ million)
- Data Table on China - Market size and forecast 2023-2028 ($ million)
- Chart on China - Year-over-year growth 2023-2028 (%)
- Data Table on China - Year-over-year growth 2023-2028 (%)
- 10.10 Japan - Market size and forecast 2023-2028
- Chart on Japan - Market size and forecast 2023-2028 ($ million)
- Data Table on Japan - Market size and forecast 2023-2028 ($ million)
- Chart on Japan - Year-over-year growth 2023-2028 (%)
- Data Table on Japan - Year-over-year growth 2023-2028 (%)
- 10.11 South Korea - Market size and forecast 2023-2028
- Chart on South Korea - Market size and forecast 2023-2028 ($ million)
- Data Table on South Korea - Market size and forecast 2023-2028 ($ million)
- Chart on South Korea - Year-over-year growth 2023-2028 (%)
- Data Table on South Korea - Year-over-year growth 2023-2028 (%)
- 10.12 Germany - Market size and forecast 2023-2028
- Chart on Germany - Market size and forecast 2023-2028 ($ million)
- Data Table on Germany - Market size and forecast 2023-2028 ($ million)
- Chart on Germany - Year-over-year growth 2023-2028 (%)
- Data Table on Germany - Year-over-year growth 2023-2028 (%)
- 10.13 Canada - Market size and forecast 2023-2028
- Chart on Canada - Market size and forecast 2023-2028 ($ million)
- Data Table on Canada - Market size and forecast 2023-2028 ($ million)
- Chart on Canada - Year-over-year growth 2023-2028 (%)
- Data Table on Canada - Year-over-year growth 2023-2028 (%)
- 10.14 UK - Market size and forecast 2023-2028
- Chart on UK - Market size and forecast 2023-2028 ($ million)
- Data Table on UK - Market size and forecast 2023-2028 ($ million)
- Chart on UK - Year-over-year growth 2023-2028 (%)
- Data Table on UK - Year-over-year growth 2023-2028 (%)
- 10.15 Spain - Market size and forecast 2023-2028
- Chart on Spain - Market size and forecast 2023-2028 ($ million)
- Data Table on Spain - Market size and forecast 2023-2028 ($ million)
- Chart on Spain - Year-over-year growth 2023-2028 (%)
- Data Table on Spain - Year-over-year growth 2023-2028 (%)
- 10.16 India - Market size and forecast 2023-2028
- Chart on India - Market size and forecast 2023-2028 ($ million)
- Data Table on India - Market size and forecast 2023-2028 ($ million)
- Chart on India - Year-over-year growth 2023-2028 (%)
- Data Table on India - Year-over-year growth 2023-2028 (%)
- 10.17 United Arab Emirates - Market size and forecast 2023-2028
- Chart on United Arab Emirates - Market size and forecast 2023-2028 ($ million)
- Data Table on United Arab Emirates - Market size and forecast 2023-2028 ($ million)
- Chart on United Arab Emirates - Year-over-year growth 2023-2028 (%)
- Data Table on United Arab Emirates - Year-over-year growth 2023-2028 (%)
- 10.18 Market opportunity by geography
- Market opportunity by geography ($ million)
- Data Tables on Market opportunity by geography ($ million)
11 Drivers, Challenges, and Opportunity/Restraints
- 11.3 Impact of drivers and challenges
- Impact of drivers and challenges in 2023 and 2028
- 11.4 Market opportunities/restraints
12 Competitive Landscape
- 12.2 Competitive Landscape
- Overview on criticality of inputs and factors of differentiation
- 12.3 Landscape disruption
- Overview on factors of disruption
- 12.4 Industry risks
- Impact of key risks on business
13 Competitive Analysis
- 13.2 Company ranking index
- 13.3 Market positioning of companies
- Matrix on companies position and classification
- 13.4 AT and T Inc.
- AT and T Inc. - Overview
- AT and T Inc. - Business segments
- AT and T Inc. - Key news
- AT and T Inc. - Key offerings
- AT and T Inc. - Segment focus
- SWOT
- 13.5 Cisco Systems Inc.
- Cisco Systems Inc. - Overview
- Cisco Systems Inc. - Business segments
- Cisco Systems Inc. - Key news
- Cisco Systems Inc. - Key offerings
- Cisco Systems Inc. - Segment focus
- SWOT
- 13.6 Huawei Technologies Co. Ltd.
- Huawei Technologies Co. Ltd. - Overview
- Huawei Technologies Co. Ltd. - Product / Service
- Huawei Technologies Co. Ltd. - Key news
- Huawei Technologies Co. Ltd. - Key offerings
- SWOT
- 13.7 Intel Corp.
- Intel Corp. - Overview
- Intel Corp. - Business segments
- Intel Corp. - Key news
- Intel Corp. - Key offerings
- Intel Corp. - Segment focus
- SWOT
- 13.8 Movandi Corp.
- Movandi Corp. - Overview
- Movandi Corp. - Product / Service
- Movandi Corp. - Key offerings
- SWOT
- 13.9 Oracle Corp.
- Oracle Corp. - Overview
- Oracle Corp. - Business segments
- Oracle Corp. - Key news
- Oracle Corp. - Key offerings
- Oracle Corp. - Segment focus
- SWOT
- 13.10 Qualcomm Inc.
- Qualcomm Inc. - Overview
- Qualcomm Inc. - Business segments
- Qualcomm Inc. - Key news
- Qualcomm Inc. - Key offerings
- Qualcomm Inc. - Segment focus
- SWOT
- 13.11 Reliance Jio Infocomm Ltd
- Reliance Jio Infocomm Ltd - Overview
- Reliance Jio Infocomm Ltd - Product / Service
- Reliance Jio Infocomm Ltd - Key offerings
- SWOT
- 13.12 Singapore Telecommunications Ltd.
- Singapore Telecommunications Ltd. - Overview
- Singapore Telecommunications Ltd. - Business segments
- Singapore Telecommunications Ltd. - Key offerings
- Singapore Telecommunications Ltd. - Segment focus
- SWOT
- 13.13 T Mobile US Inc.
- T Mobile US Inc. - Overview
- T Mobile US Inc. - Product / Service
- T Mobile US Inc. - Key offerings
- SWOT
- 13.14 Tata Consultancy Services Ltd.
- Tata Consultancy Services Ltd. - Overview
- Tata Consultancy Services Ltd. - Business segments
- Tata Consultancy Services Ltd. - Key news
- Tata Consultancy Services Ltd. - Key offerings
- Tata Consultancy Services Ltd. - Segment focus
- SWOT
- 13.15 Telefonaktiebolaget LM Ericsson
- Telefonaktiebolaget LM Ericsson - Overview
- Telefonaktiebolaget LM Ericsson - Business segments
- Telefonaktiebolaget LM Ericsson - Key news
- Telefonaktiebolaget LM Ericsson - Key offerings
- Telefonaktiebolaget LM Ericsson - Segment focus
- SWOT
- 13.16 Telit Cinterion
- Telit Cinterion - Overview
- Telit Cinterion - Product / Service
- Telit Cinterion - Key offerings
- SWOT
- 13.17 Verizon Communications Inc.
- Verizon Communications Inc. - Overview
- Verizon Communications Inc. - Business segments
- Verizon Communications Inc. - Key news
- Verizon Communications Inc. - Key offerings
- Verizon Communications Inc. - Segment focus
- SWOT
- 13.18 Wipro Ltd.
- Wipro Ltd. - Overview
- Wipro Ltd. - Business segments
- Wipro Ltd. - Key news
- Wipro Ltd. - Key offerings
- Wipro Ltd. - Segment focus
- SWOT
14 Appendix
- 14.2 Inclusions and exclusions checklist
- Inclusions checklist
- Exclusions checklist
- 14.3 Currency conversion rates for US$
- Currency conversion rates for US$
- 14.4 Research methodology
- 14.7 Validation techniques employed for market sizing
- Validation techniques employed for market sizing
- 14.9 360 degree market analysis
- 360 degree market analysis
- 14.10 List of abbreviations