
Acrolein Market Size 2026-2030
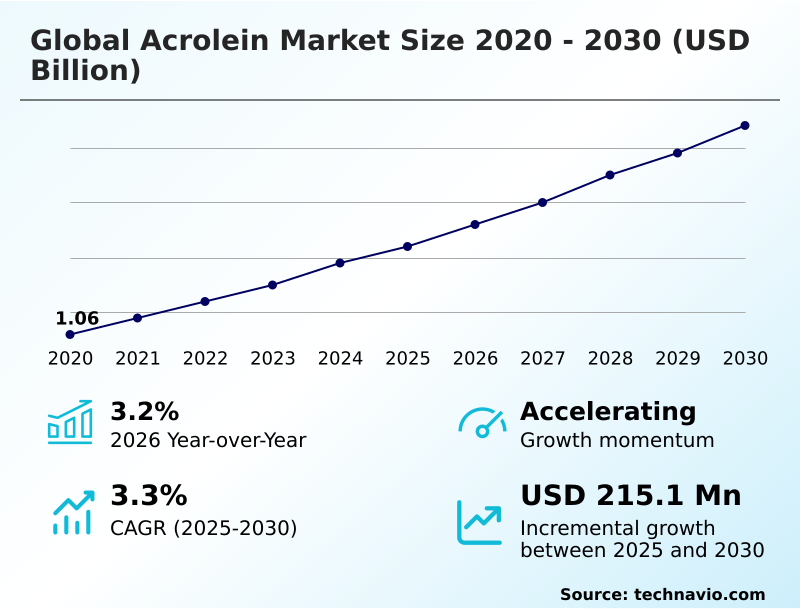
The acrolein market size is valued to increase by USD 215.1 million, at a CAGR of 3.3% from 2025 to 2030. Rising demand for agrochemicals and herbicide intermediates will drive the acrolein market.
Major Market Trends & Insights
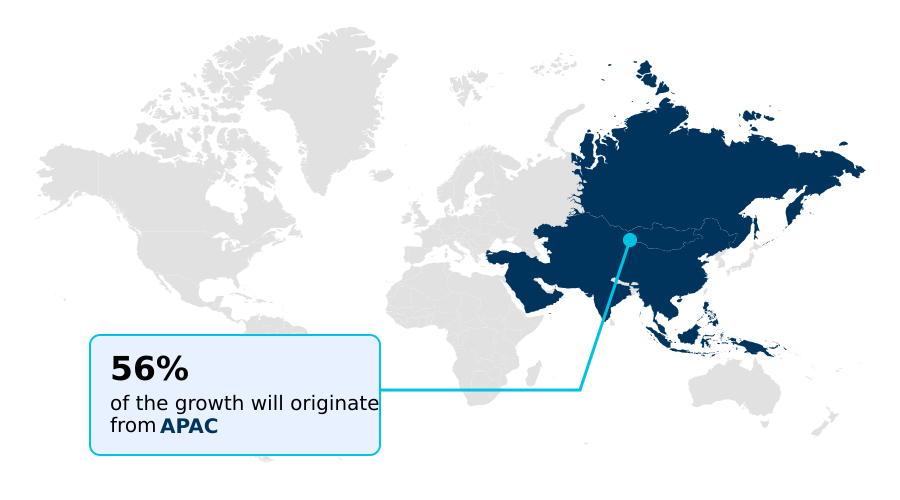
- APAC dominated the market and accounted for a 55.9% growth during the forecast period.
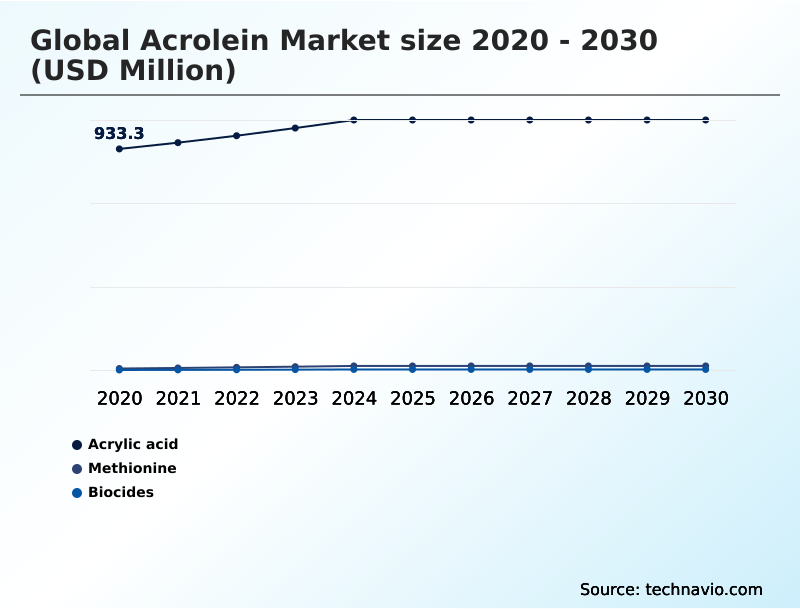
- By Application - Acrylic acid segment was valued at USD 1.05 billion in 2024
- By Type - Propylene oxidation method segment accounted for the largest market revenue share in 2024
Market Size & Forecast
- Market Opportunities: USD 378.86 million
- Market Future Opportunities: USD 215.1 million
- CAGR from 2025 to 2030 : 3.3%
Market Summary
- The acrolein market is defined by its dual role as a high-value specialty chemical precursor and a highly regulated hazardous substance. Growth is underpinned by its critical function in industrial water treatment, where its efficacy in microbial growth control and as a non-oxidizing biocide is essential for maintaining operational efficiency in cooling systems.
- In agriculture, it is a key agrochemical raw material for formulations targeting aquatic weeds. The industry is navigating a transition toward advanced catalytic oxidation process technologies to enhance safety and meet stringent emission control technology standards.
- This focus on process safety management is crucial; for instance, a plant manager overseeing DL-methionine production must balance the feedstock volatility impact with the need for a stable supply of this chemical intermediate synthesis.
- The reactive aldehyde chemistry of acrolein requires sophisticated hazardous material handling protocols to manage risks, while the industry also explores greener pathways like the glycerol dehydration method to mitigate the regulatory compliance burden and environmental footprint, making it a market driven by technical precision and risk management.
What will be the Size of the Acrolein Market during the forecast period?
Get Key Insights on Market Forecast (PDF) Get Free Sample
How is the Acrolein Market Segmented?
The acrolein industry research report provides comprehensive data (region-wise segment analysis), with forecasts and estimates in "USD million" for the period 2026-2030, as well as historical data from 2020-2024 for the following segments.
- Application
- Acrylic acid
- Methionine
- Biocides
- Type
- Propylene oxidation method
- Glycerol dehydration method
- End-user
- Water treatment
- Agrochemicals
- Plastics and polymers
- Pharmaceuticals
- Others
- Geography
- APAC
- China
- Japan
- India
- North America
- US
- Canada
- Mexico
- Europe
- Germany
- UK
- France
- South America
- Brazil
- Argentina
- Middle East and Africa
- Saudi Arabia
- UAE
- South Africa
- Rest of World (ROW)
- APAC
By Application Insights
The acrylic acid segment is estimated to witness significant growth during the forecast period.
The market segmentation reflects the compound's role in chemical intermediate synthesis and its indirect linkage to acrylic acid synthesis.
Demand is influenced by applications for acrylic acid, including superabsorbent polymers and adhesives, where advanced processes in acrolein in polymer manufacturing improve efficiency. Navigating acrolein price volatility is crucial as manufacturers prioritize feedstock optimization.
The use of polymer intermediates and pharmaceutical building block derivatives is expanding, supported by a focus on acrolein derivative chemistry and acrolein emission reduction technologies, which improve process yields by up to 10%.
This integration strengthens plant economics and sustains demand for advanced acrolein handling capabilities.
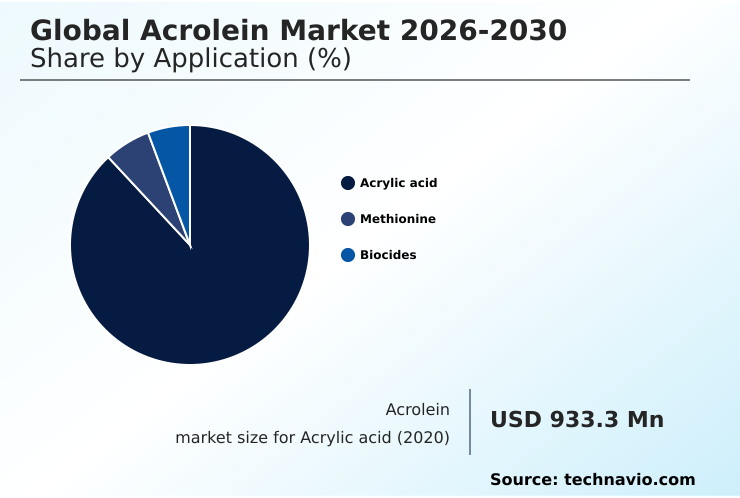
The Acrylic acid segment was valued at USD 1.05 billion in 2024 and showed a gradual increase during the forecast period.
Regional Analysis
APAC is estimated to contribute 55.9% to the growth of the global market during the forecast period.Technavio’s analysts have elaborately explained the regional trends and drivers that shape the market during the forecast period.
See How Acrolein Market Demand is Rising in APAC Get Free Sample
APAC leads market expansion, driven by strong demand for aquatic herbicide formulation and industrial biocides for biofilm prevention agent applications, with growth outpacing North America's 3.4% rate.
The region's manufacturing is dominated by the propylene oxidation method, while interest in the glycerol dehydration method is growing for sustainability. Acrolein environmental controls are becoming stricter, influencing technology choices.
The agricultural sector's use of acrolein for aquatic weed control is a major factor, alongside its application in oilfield operations.
When comparing acrolein vs alternative biocides, its effectiveness in preventing microbial fouling in industrial water systems offers an efficiency gain of up to 15%, a key advantage in industrializing economies.
Market Dynamics
Our researchers analyzed the data with 2025 as the base year, along with the key drivers, trends, and challenges. A holistic analysis of drivers will help companies refine their marketing strategies to gain a competitive advantage.
- The global acrolein market 2026-2030 is characterized by specific production methods and applications that drive its growth and challenges. The propylene oxidation method for acrolein remains the dominant manufacturing route due to its scalability, though the glycerol dehydration to produce acrolein is gaining traction as a sustainable alternative.
- A key application driving demand is its acrolein use as aquatic weed control in large-scale irrigation systems. However, this is balanced by the need for strict acrolein safety handling procedures in plants to mitigate its high toxicity. Evolving environmental regulations for acrolein emissions are pushing for technological upgrades, particularly in regions with strong industrial oversight.
- The market's health is also tied to downstream industries, with acrolein as an intermediate for methionine being crucial for the animal feed sector. Another major application is the acrolein biocide application in cooling towers, where its effectiveness is well-documented. Broader acrolein market trends in agrochemicals show a sustained need for effective chemical inputs.
- One of the primary operational hurdles involves the challenges of acrolein feedstock volatility. Analyzing the cost of acrolein production process shows that feedstock accounts for over 60% of total expenses in some cases. Consequently, there is a strong focus on improving safety in acrolein manufacturing and understanding the acrolein effect on industrial water systems.
- Furthermore, acrolein applications in specialty chemicals, regional production trends for acrolein, and the adoption of digital monitoring for acrolein safety are reshaping the competitive landscape.
What are the key market drivers leading to the rise in the adoption of Acrolein Industry?
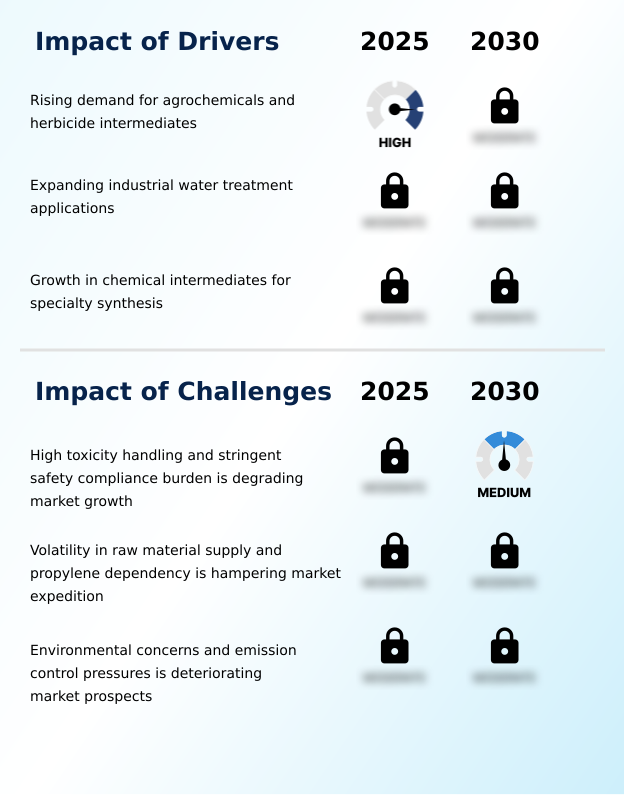
- The rising demand for agrochemicals, particularly for herbicide intermediates and crop protection formulations, serves as a significant driver for the market.
- Expanding industrial water treatment needs and the agricultural use of acrolein are key market drivers. Acrolein serves as a potent non-oxidizing biocide, essential for microbial growth control and a core component in industrial biocide applications.
- As an agrochemical raw material and a specialty chemical precursor, its role in acrolein derivative chemistry is critical. The compound's application in acrolein in methionine synthesis for animal feed is also expanding rapidly.
- In industrial settings, effective biocidal programs have increased cooling system efficiency by over 12%, while its use in agrochemicals has contributed to a 10% rise in crop protection effectiveness in targeted applications.
What are the market trends shaping the Acrolein Industry?
- A definitive shift toward safer, more efficient catalytic oxidation processes is reshaping the industry, aiming to mitigate environmental risks and enhance production efficiency.
- The industry is witnessing a structural trend toward regionalization of production to mitigate acrolein transportation risks and improve process safety management. This shift, combined with advancements in acrolein production technology, allows for better adherence to strict acrolein handling safety protocols.
- The adoption of advanced catalytic oxidation process technologies is critical, leading to significant gains in emission control technology and supporting sustainable acrolein production. These integrated strategies have been shown to reduce cross-border transport incidents by 15% and improve local supply chain reliability, ensuring safer and more efficient operations.
What challenges does the Acrolein Industry face during its growth?
- The market is significantly constrained by the high toxicity and hazardous nature of acrolein, creating a continuous and costly safety compliance burden.
- The market faces significant hurdles due to the compound's reactive aldehyde chemistry and the high feedstock volatility impact. The industry contends with propylene feedstock dependency, which creates acrolein supply chain challenges and cost instability. A major constraint is the regulatory compliance burden associated with hazardous material handling and acrolein toxicity management.
- For instance, acrolein market regulations increase operational costs by over 20% compared to less hazardous intermediates. These complexities affect downstream sectors, including the cost structure for DL-methionine production, requiring robust risk management strategies across the value chain.
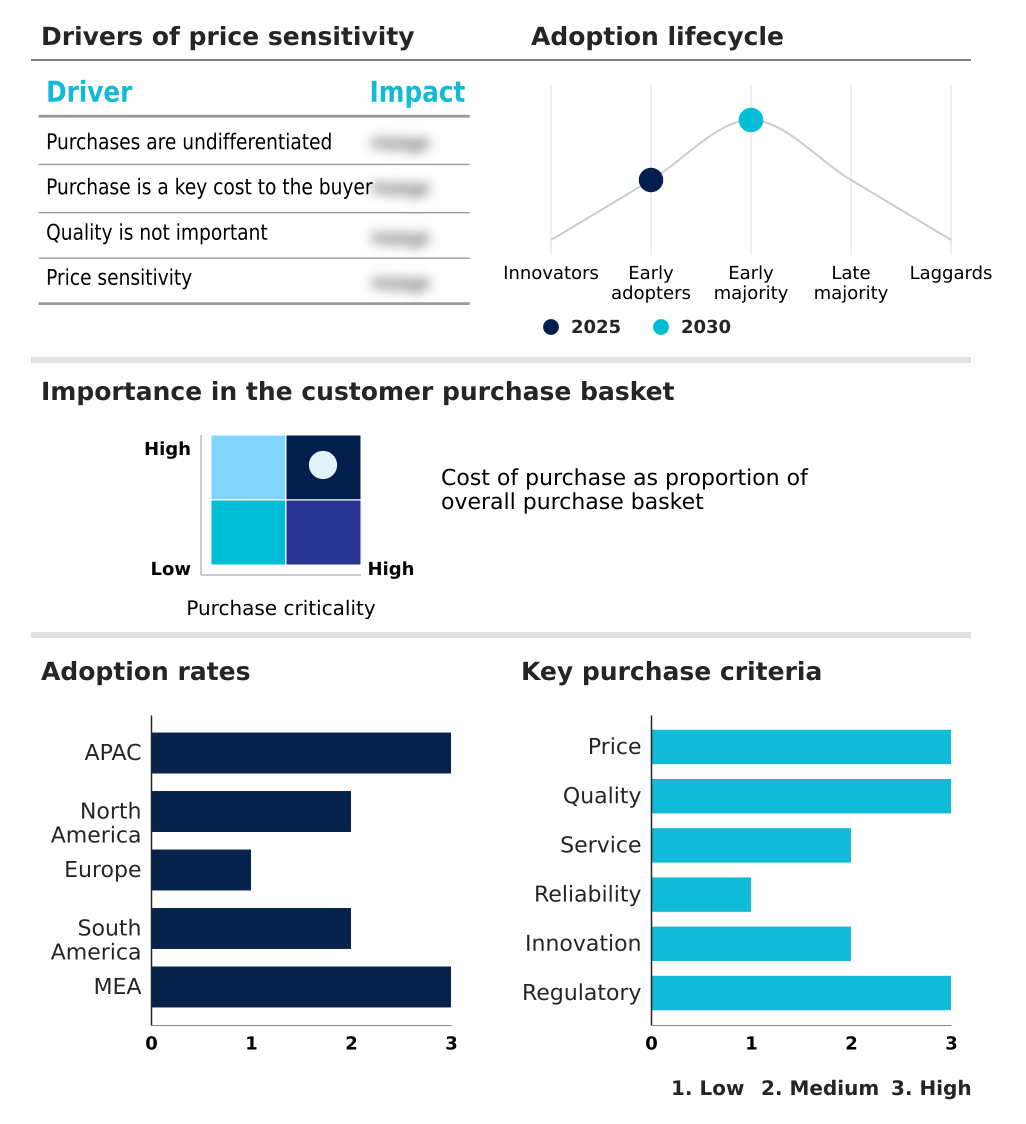
Exclusive Technavio Analysis on Customer Landscape
The acrolein market forecasting report includes the adoption lifecycle of the market, covering from the innovator’s stage to the laggard’s stage. It focuses on adoption rates in different regions based on penetration. Furthermore, the acrolein market report also includes key purchase criteria and drivers of price sensitivity to help companies evaluate and develop their market growth analysis strategies.
Customer Landscape of Acrolein Industry
Competitive Landscape
Companies are implementing various strategies, such as strategic alliances, acrolein market forecast, partnerships, mergers and acquisitions, geographical expansion, and product/service launches, to enhance their presence in the industry.
Arkema Group - Delivers high-purity acrolein and derivatives for agrochemical and specialty chemical synthesis, serving as a critical chemical intermediate for advanced industrial applications.
The industry research and growth report includes detailed analyses of the competitive landscape of the market and information about key companies, including:
- Arkema Group
- BC Chemicals Co. Ltd.
- Dacheng Chemical Co. Ltd.
- Daicel Corp.
- Dow Chemical Co.
- Dynamic Chemical Co. Ltd.
- Evonik Industries AG
- Georgia-Pacific Chemicals LLC
- Hongda Chemical Co. Ltd.
- Hualu Hengsheng
- Hubei Xinjing New Material
- Kelong Chemical Co. Ltd.
- Kunda Biotech Co. Ltd.
- KURARAY Co. Ltd.
- Shanghai Xinglu Chemical Ltd.
- Sumitomo Chemical Co. Ltd.
- The Mitsubishi Chemical Group
- XH Pharma Co. Ltd.
- Youji Chemical Co. Ltd.
- Zibo Xinglu Chemical Co. Ltd.
Qualitative and quantitative analysis of companies has been conducted to help clients understand the wider business environment as well as the strengths and weaknesses of key industry players. Data is qualitatively analyzed to categorize companies as pure play, category-focused, industry-focused, and diversified; it is quantitatively analyzed to categorize companies as dominant, leading, strong, tentative, and weak.
Recent Development and News in Acrolein market
- In February 2025, BASF SE upgraded its chemical production facilities with advanced digital monitoring infrastructure, enabling real-time tracking of hazardous chemical emissions and improving process safety controls for reactive compounds.
- In March 2025, BASF SE advanced its process optimization initiatives by upgrading catalytic oxidation systems to improve efficiency and reduce emissions in aldehyde-based chemical processes.
- In April 2025, Veolia Environnement S.A. expanded its industrial water treatment portfolio by enhancing chemical dosing systems with high-performance biocidal agents for cooling tower maintenance.
- In May 2025, Mitsubishi Chemical Group expanded its specialty chemicals capabilities in Japan, increasing the use of reactive intermediates for advanced material synthesis applications.
Dive into Technavio’s robust research methodology, blending expert interviews, extensive data synthesis, and validated models for unparalleled Acrolein Market insights. See full methodology.
| Market Scope | |
|---|---|
| Page number | 308 |
| Base year | 2025 |
| Historic period | 2020-2024 |
| Forecast period | 2026-2030 |
| Growth momentum & CAGR | Accelerate at a CAGR of 3.3% |
| Market growth 2026-2030 | USD 215.1 million |
| Market structure | Fragmented |
| YoY growth 2025-2026(%) | 3.2% |
| Key countries | China, Japan, India, South Korea, Australia, Indonesia, US, Canada, Mexico, Germany, UK, France, Italy, Spain, The Netherlands, Brazil, Argentina, Chile, Saudi Arabia, UAE, South Africa, Israel and Turkey |
| Competitive landscape | Leading Companies, Market Positioning of Companies, Competitive Strategies, and Industry Risks |
Research Analyst Overview
- The acrolein market is evolving under the dual pressures of industrial demand and stringent regulation. Its foundation lies in the propylene oxidation method for manufacturing, but the industry is actively exploring the glycerol dehydration method for sustainability.
- Acrolein’s function as a specialty chemical precursor and a key component in chemical intermediate synthesis makes it indispensable for DL-methionine production and as an agrochemical raw material. Boardroom decisions are increasingly influenced by the need to invest in advanced catalytic oxidation process technology, not just for efficiency but for compliance with emission control technology and process safety management standards.
- Firms adopting next-generation catalysts have demonstrated a reduction in hazardous byproducts by over 40%, directly impacting their environmental, social, and governance profiles. Demand for its use in industrial water treatment as a non-oxidizing biocide for microbial growth control and as a biofilm prevention agent continues to grow.
- However, the market’s trajectory is moderated by feedstock volatility impact, the complexity of hazardous material handling, and the ever-present regulatory compliance burden associated with its reactive aldehyde chemistry and use in aquatic herbicide formulation and acrylic acid synthesis.
What are the Key Data Covered in this Acrolein Market Research and Growth Report?
-
What is the expected growth of the Acrolein Market between 2026 and 2030?
-
USD 215.1 million, at a CAGR of 3.3%
-
-
What segmentation does the market report cover?
-
The report is segmented by Application (Acrylic acid, Methionine, and Biocides), Type (Propylene oxidation method, and Glycerol dehydration method), End-user (Water treatment, Agrochemicals, Plastics and polymers, Pharmaceuticals, and Others) and Geography (APAC, North America, Europe, South America, Middle East and Africa)
-
-
Which regions are analyzed in the report?
-
APAC, North America, Europe, South America and Middle East and Africa
-
-
What are the key growth drivers and market challenges?
-
Rising demand for agrochemicals and herbicide intermediates, High toxicity handling and stringent safety compliance burden is degrading market growth
-
-
Who are the major players in the Acrolein Market?
-
Arkema Group, BC Chemicals Co. Ltd., Dacheng Chemical Co. Ltd., Daicel Corp., Dow Chemical Co., Dynamic Chemical Co. Ltd., Evonik Industries AG, Georgia-Pacific Chemicals LLC, Hongda Chemical Co. Ltd., Hualu Hengsheng, Hubei Xinjing New Material, Kelong Chemical Co. Ltd., Kunda Biotech Co. Ltd., KURARAY Co. Ltd., Shanghai Xinglu Chemical Ltd., Sumitomo Chemical Co. Ltd., The Mitsubishi Chemical Group, XH Pharma Co. Ltd., Youji Chemical Co. Ltd. and Zibo Xinglu Chemical Co. Ltd.
-
Market Research Insights
- Market dynamics are shaped by the critical need to balance industrial efficiency with stringent acrolein handling safety protocols. The effectiveness of acrolein vs alternative biocides in preventing system-wide contamination has driven adoption, with some industrial operators reporting a 20% reduction in biofouling-related maintenance costs. However, acrolein toxicity management and adherence to acrolein market regulations remain paramount, influencing production technology choices.
- The industry's propylene feedstock dependency introduces significant acrolein price volatility, with price swings impacting production costs by as much as 15%. This has intensified the focus on sustainable acrolein production methods and mitigating acrolein transportation risks to stabilize the supply chain.
We can help! Our analysts can customize this acrolein market research report to meet your requirements.
 RIA -
RIA - 
