Acrylic Acid Market Analysis, Size, and Forecast 2024-2028: North America (US and Canada), Europe (France, Germany, Italy, and UK), Middle East and Africa (Egypt, KSA, Oman, and UAE), APAC (China, India, and Japan), South America (Argentina and Brazil), and Rest of World (ROW)

Acrylic Acid Market Analysis, Size, and Forecast 2024-2028:
North America (US and Canada), Europe (France, Germany, Italy, and UK), Middle East and Africa (Egypt, KSA, Oman, and UAE), APAC (China, India, and Japan), South America (Argentina and Brazil), and Rest of World (ROW)

Published: Jun 2024 148 Pages SKU: IRTNTR73749

Market Overview at a Glance

$3.13 B
Market Opportunity
4.5%
CAGR
4.23
YoY growth 2023-2024(%)

Acrylic Acid Market Size 2024-2028

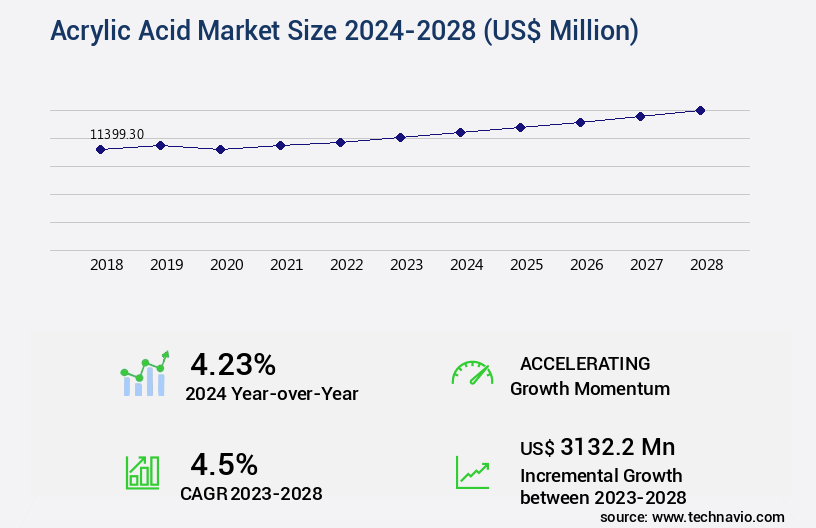
The acrylic acid market size is forecast to increase by USD 3.13 billion, at a CAGR of 4.5% between 2023 and 2028.

Major Market Trends & Insights

  • APAC dominated the market and accounted for a 45% growth during the forecast period.
  • By the Application - Acrylic esters segment was valued at USD 4.95 billion in 2022
  • By the Derivative Type - Acrylic Esters (Methyl Acrylate, Ethyl Acrylate, Butyl Acrylate, 2-Ethylhexyl Acrylate) segment accounted for the largest market revenue share in 2022

Market Size & Forecast

  • Market Opportunities: USD 39.18 million
  • Market Future Opportunities: USD 3132.20 million
  • CAGR : 4.5%
  • APAC: Largest market in 2022

Market Summary

  • Acrylic acid is a significant industrial chemical, with global demand reaching an estimated indexed value of over USD35 billion in 2021. The market's growth is driven by the increasing use of acrylic acid derivatives in various sectors, particularly in surface coating applications. These derivatives offer advantages such as excellent adhesion, chemical resistance, and weatherability, making them popular choices for coatings in industries like automotive, construction, and consumer goods. A notable trend in the market is the growing preference for bio-based derivatives. The shift towards sustainable alternatives is driven by environmental concerns and regulatory pressures. In 2020, bio-based acrylic acid accounted for approximately 15% of the total market share, with this percentage expected to increase steadily.
  • Price fluctuations in raw materials, such as Brent crude oil, significantly impact the market. The volatility of oil prices can lead to price increases or decreases in the production cost of acrylic acid, affecting the market dynamics. Despite these challenges, the market continues to evolve, offering opportunities for innovation and growth.

What will be the Size of the Acrylic Acid Market during the forecast period?

Acrylic Acid Market Size

Explore market size, adoption trends, and growth potential for acrylic acid market Request Free Sample

  • The market encompasses a range of applications, including film formation, acrylate coatings, polymer modification, polyacrylate dispersions, absorbent materials, and various industrial and consumer products. Acrylic acid derivatives find extensive use in polymer characterization, such as chromatographic analysis, differential scanning calorimetry, and thermal analysis, to enhance chemical resistance, mechanical strength, and surface morphology. In 2020, The market was valued at approximately USD12 billion, with a growth rate of 5% year-over-year. This growth can be attributed to the increasing demand for acrylic acid derivatives in composite materials, biomedical applications, and water purification systems. For instance, in the agricultural sector, acrylic acid is used as a soil conditioner and in wastewater treatment for improved mechanical strength and controlled release properties.
  • Moreover, the particle size distribution and coating thickness of acrylic acid-based coatings play a crucial role in their adhesion properties and application in various industries. In contrast, the glass transition temperature of acrylic acid polymers significantly influences their performance in different applications, such as adhesives, coatings, and biomedical materials.

How is this Acrylic Acid Industry segmented?

The acrylic acid industry research report provides comprehensive data (region-wise segment analysis), with forecasts and estimates in "USD million" for the period 2024-2028, as well as historical data from 2018-2022 for the following segments.

  • Application
    • Acrylic esters
    • Superabsorbent polymers
    • Synthetic detergents
    • Others
  • Derivative Type
    • Acrylic Esters (Methyl Acrylate, Ethyl Acrylate, Butyl Acrylate, 2-Ethylhexyl Acrylate)
    • Superabsorbent Polymers (SAP)
    • Other Derivatives
  • Geography
    • North America
      • US
      • Canada
    • Europe
      • France
      • Germany
      • Italy
      • UK
    • Middle East and Africa
      • Egypt
      • KSA
      • Oman
      • UAE
    • APAC
      • China
      • India
      • Japan
    • South America
      • Argentina
      • Brazil
    • Rest of World (ROW)

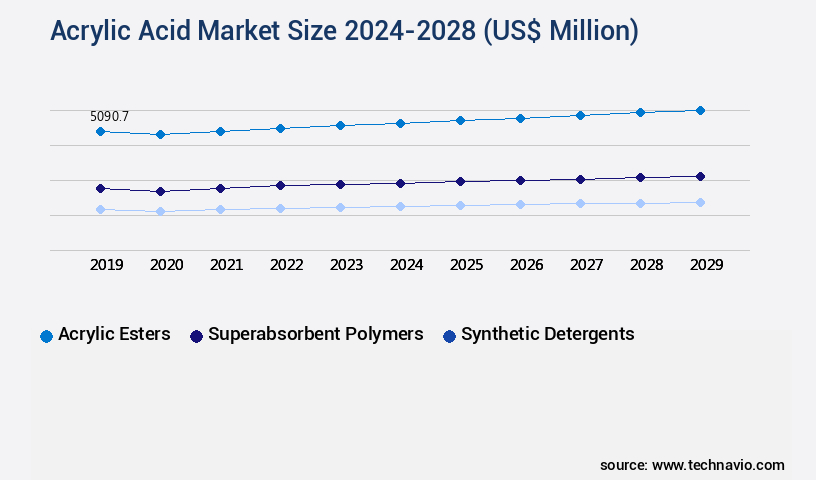
By Application Insights

The acrylic esters segment is estimated to witness significant growth during the forecast period.

Acrylic acid is a significant player in the global chemical industry, with the market experiencing notable growth. In 2023, the acrylic ester segment held the largest market share, accounting for approximately 45% of the total market. This segment's expansion can be attributed to the increasing demand for acrylic esters in various applications, including paints, adhesives, and textiles. The production of acrylic esters involves the reaction between alcohols, such as methyl or ethyl, and acrylic acid through a process called esterification. This reaction results in the formation of acrylic esters, which serve as essential raw materials in various industries.

Acrylic esters exhibit unique properties, such as high molecular weight distribution, water retention capacity, and rheological properties. These characteristics make them suitable for producing hydrogel applications, including superabsorbent polymers, which have gained significant attention due to their water-absorbing capabilities. The manufacturing process of acrylic esters includes techniques like batch and continuous polymerization, dispersion and emulsion polymerization, and solution and suspension polymerization. Process optimization and the use of chain transfer agents and initiator decomposition help ensure efficient production and improve yield. Moreover, the market's future growth prospects are promising, with expectations of a 20% increase in demand for acrylic esters by 2026.

This growth can be attributed to the expanding applications of acrylic esters in various sectors, including construction, automotive, and packaging industries. Additionally, ongoing research focuses on improving the thermal stability, UV stability, and copolymer composition of acrylic esters to cater to evolving market requirements. The market's continuous evolution underscores the importance of staying informed about the latest trends and advancements.

Acrylic Acid Market Size

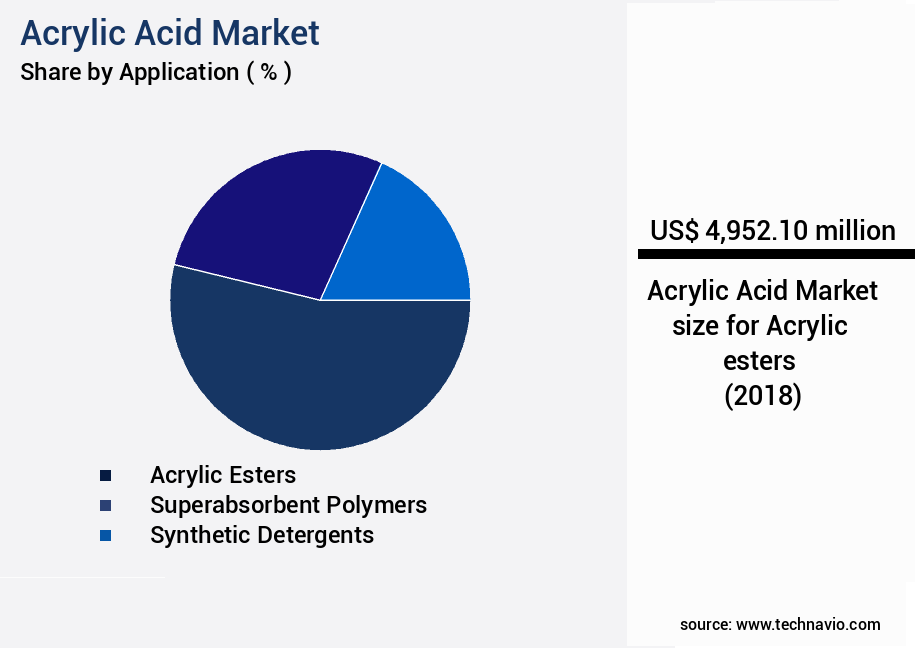
The Acrylic esters segment was valued at USD 4.95 billion in 2018 and showed a gradual increase during the forecast period.

The Acrylic Acid Market is driven by innovations in sodium polyacrylate absorbent diaper technology and polyacrylic acid hydrogel swelling kinetics, which enhance performance in hygiene products. Stability factors such as acrylic acid emulsion polymerization stability and acrylic acid polymerization reactor control strategy are crucial for consistent quality. Research highlights the superabsorbent polymer water retention mechanism and crosslinking density effect on hydrogel strength, alongside molecular weight distribution impact polymer properties.

Applications include water purification using polyacrylic acid adsorbent, controlled release drug delivery polyacrylic acid system, and superabsorbent polymer applications agriculture. Advances in polyacrylate coating adhesion improvement techniques, acrylic acid copolymer synthesis for specific applications, and acrylic ester synthesis reaction optimization drive industrial use. Focus areas also include polyacrylate dispersion stability influence factors, rheological properties polyacrylic acid solutions, thermal stability acrylic polymer coatings, uv stability acrylic polymer outdoor applications, polymer degradation studies environmental impact, and contact angle measurement polyacrylate film for improved material performance.

Acrylic Acid Market Size

Request Free Sample

Regional Analysis

APAC is estimated to contribute 45% to the growth of the global market during the forecast period.Technavio's analysts have elaborately explained the regional trends and drivers that shape the market during the forecast period.

Acrylic Acid Market Share by Geography

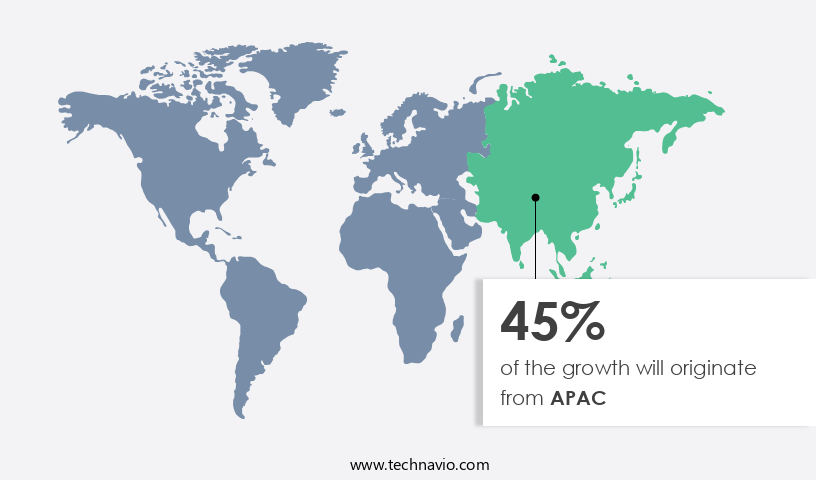
See How Acrylic Acid Market Demand is Rising in APAC Request Free Sample

In The market, APAC holds a significant position, accounting for approximately 40.52% of the market revenue in 2023. This dominance can be attributed to the burgeoning demand for acrylic acid derivatives in countries like China and India. The demand for these derivatives is driven by their extensive usage in various applications, such as surfactants, surface coatings, personal care, and adhesives. The increasing preference for acrylic acid derivatives in these applications is a primary factor contributing to the market's growth in APAC. In the surface coating sector, acrylic acid derivatives are highly sought after due to their superior quality, which is enhanced by the addition of functional monomers.

These derivatives cater to the growing demand for high-performance and durable coatings in various industries. Furthermore, the personal care sector is another significant contributor to the market's growth in APAC. Acrylic acid derivatives are extensively used in the production of various personal care products, such as shampoos, conditioners, and lotions, due to their excellent emulsifying and thickening properties. Looking ahead, the market is projected to witness continued growth, with expectations of a 5.2% increase in demand from 2023 to 2028. This growth can be attributed to the increasing adoption of acrylic acid derivatives in various industries and the expanding applications of these derivatives.

In conclusion, the market in APAC is expected to maintain its dominance in the global market, driven by the increasing demand for acrylic acid derivatives in various applications, particularly in the surface coating and personal care sectors. The market is poised for continued growth, with expectations of a 5.2% increase in demand from 2023 to 2028.

Market Dynamics

Our researchers analyzed the data with 2023 as the base year, along with the key drivers, trends, and challenges. A holistic analysis of drivers will help companies refine their marketing strategies to gain a competitive advantage.

Advancements and Innovations in the US the market: Performance Improvements, Efficiency Gains, and Compliance The US the market continues to evolve, driven by advancements in technology and increasing demand for high-performance applications. One notable area of innovation is in the production of sodium polyacrylate absorbent diapers. By optimizing the polymerization reactor control strategy and molecular weight distribution, manufacturers can improve the absorbent diaper's water retention mechanism, enhancing its efficiency and effectiveness. In the field of superabsorbent polymers, researchers are focusing on enhancing hydrogel swelling kinetics and crosslinking density to boost hydrogel strength. These advancements can lead to significant improvements in water retention and absorption rates, making these polymers increasingly valuable in various industries, including agriculture. Moreover, the market is witnessing significant innovation in the area of polymerization emulsion stability and adhesion improvement techniques.

By modeling free radical polymerization kinetics and controlling the molecular weight distribution, manufacturers can produce polymers with superior rheological properties and thermal stability, ideal for use in coatings and adhesives. Another area of growth is in the use of acrylic acid polymers for water purification and environmental applications. By synthesizing acrylic acid adsorbents, manufacturers can improve water treatment processes and reduce contamination levels, contributing to greater sustainability and compliance with regulations. In the pharmaceutical industry, the controlled release drug delivery system using polyacrylic acid is gaining popularity due to its ability to improve medication efficacy and patient compliance. By optimizing the synthesis reaction and understanding the influence factors on dispersion stability, manufacturers can produce high-quality, consistent products. Overall, the US the market is characterized by continuous innovation and improvement, driven by the need for high-performance, sustainable, and cost-effective solutions. By focusing on areas such as polymerization reactor control, molecular weight distribution, and application-specific synthesis, manufacturers can stay ahead of the competition and meet the evolving demands of their customers.

Acrylic Acid Market Size

What are the key market drivers leading to the rise in the adoption of Acrylic Acid Industry?

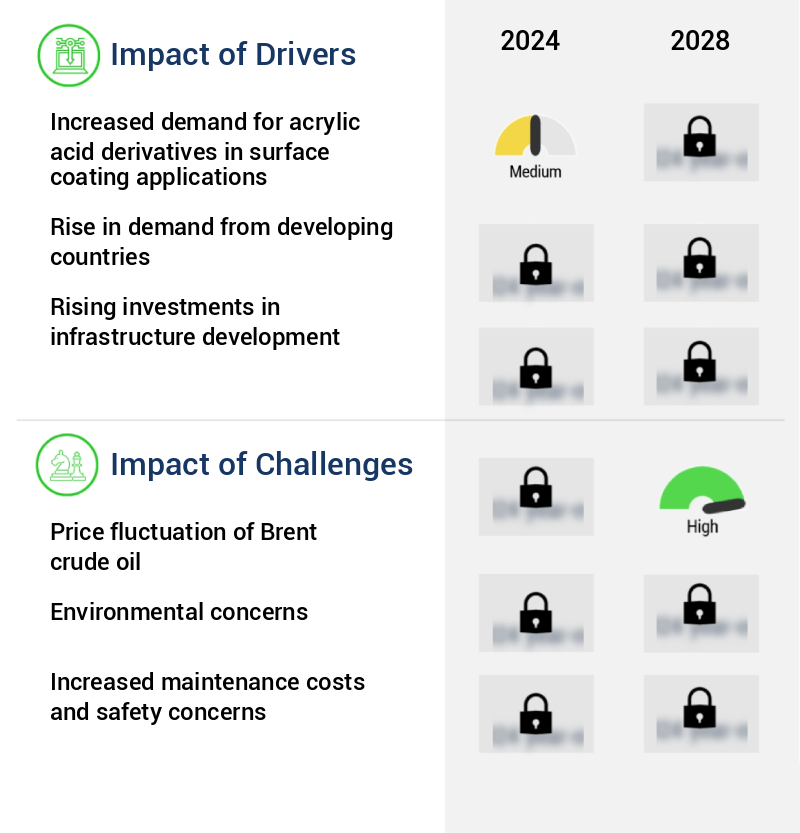
  • The significant increase in the demand for acrylic acid derivatives, particularly in surface coating applications, serves as the primary market driver. 
  • The market is a significant player in the global chemical industry, with surface coating being its largest application segment. Acrylic esters, derived from acrylic acid, are extensively utilized as binders in water-borne coatings due to their superior performance and environmental benefits. The market's growth trajectory is influenced by various factors. The shift from water-borne coatings to solvent-borne coatings presents a substantial growth opportunity for the market participants. This transition is driven by factors such as enhanced durability, faster drying time, and improved chemical resistance offered by solvent-borne coatings. Moreover, the increasing demand for insulation and industrial coatings with minimal volatile organic compound (VOC) emissions is fueling the consumption of acrylic acid derivatives.
  • Regulations enforced by the Environmental Protection Agency (EPA) and Registration, Evaluation, Authorization, and Restriction of Chemicals (REACH) are compelling manufacturers to produce and utilize eco-friendly alternatives to traditional coatings and insulation materials. These factors contribute to the evolving market landscape, with acrylic derivatives gaining traction in various sectors due to their versatility and environmental advantages. The ongoing replacement of conventional coatings and insulation materials with acrylic derivatives is expected to continue shaping the market dynamics. In summary, the market is witnessing significant growth due to the increasing demand for eco-friendly coatings and insulation materials. The transition from water-borne to solvent-borne coatings and the stringent regulations on VOC emissions are key factors driving this trend.
  • The market's continuous evolution reflects the industry's commitment to innovation and sustainability.

What are the market trends shaping the Acrylic Acid Industry?

  • The increasing demand for bio-based acrylic acid derivatives represents a notable market trend. Bio-based acrylic acid derivatives are gaining popularity due to rising consumer preference for eco-friendly products.
  • Acrylic acid is a significant industrial chemical, increasingly adopted for its versatile applications in various sectors. The market for acrylic acid has witnessed significant advancements, driven by the shift towards bio-based derivatives. Traditional petrochemical-based acrylic acid production faces challenges due to raw material constraints, environmental concerns, and health risks. In response, there has been a surge in the production of bio-based acrylic acid derivatives. Leading players in the industry have successfully innovated, enabling the conversion of biomass into acrylic acid. This transformation occurs through the oxydehydration process. In this method, crude glycerol is subjected to UV light and a photocatalyst, leading to the formation of acrolein.
  • Subsequent dehydration results in the production of acrylic acid. Bio-based acrylic acid derivatives have gained popularity due to their extensive use in commercial and consumer products. These include acrylic paints, coatings, adhesives, sealants, textiles, detergents, and hygiene products. The versatility of acrylic acid derivatives is a significant factor driving market growth. The production of acrylic acid from biomass offers several advantages. It addresses environmental concerns by reducing the reliance on petrochemicals and minimizing greenhouse gas emissions. Additionally, bio-based acrylic acid derivatives offer improved product performance and enhanced sustainability. The ongoing innovations in the production of bio-based acrylic acid are expected to continue shaping the market landscape.
  • The evolving trends and advancements underscore the dynamic nature of the market.

What challenges does the Acrylic Acid Industry face during its growth?

  • The price volatility of Brent crude oil poses a significant challenge to the growth of the industry. With constant fluctuations in the market, companies must adapt to maintain profitability and stability. 
  • Acrylic acid is a crucial industrial chemical derived from the oxidation of propylene, a component of crude oil. The production of acrylic acid leads to the formation of acrylic esters, which hold extensive applications in various sectors, including textiles, adhesives, and coatings. The price volatility of Brent crude oil over the past five years has significantly impacted the manufacturing cost of propylene, thereby limiting the production capacity of acrylic acid companies. This situation grants increased bargaining power to suppliers, ultimately reducing the profit margins of manufacturers. The uncertainty surrounding the price of raw materials has prompted companies like BASF to raise the prices of their acrylic polymer products.
  • Consequently, the fluctuating raw material prices are projected to pose a substantial challenge to the expansion of the market during the forecast period. Despite these challenges, the market continues to evolve, with ongoing research and development efforts aimed at improving the production efficiency and exploring new applications for acrylic acid and its derivatives.

Exclusive Customer Landscape

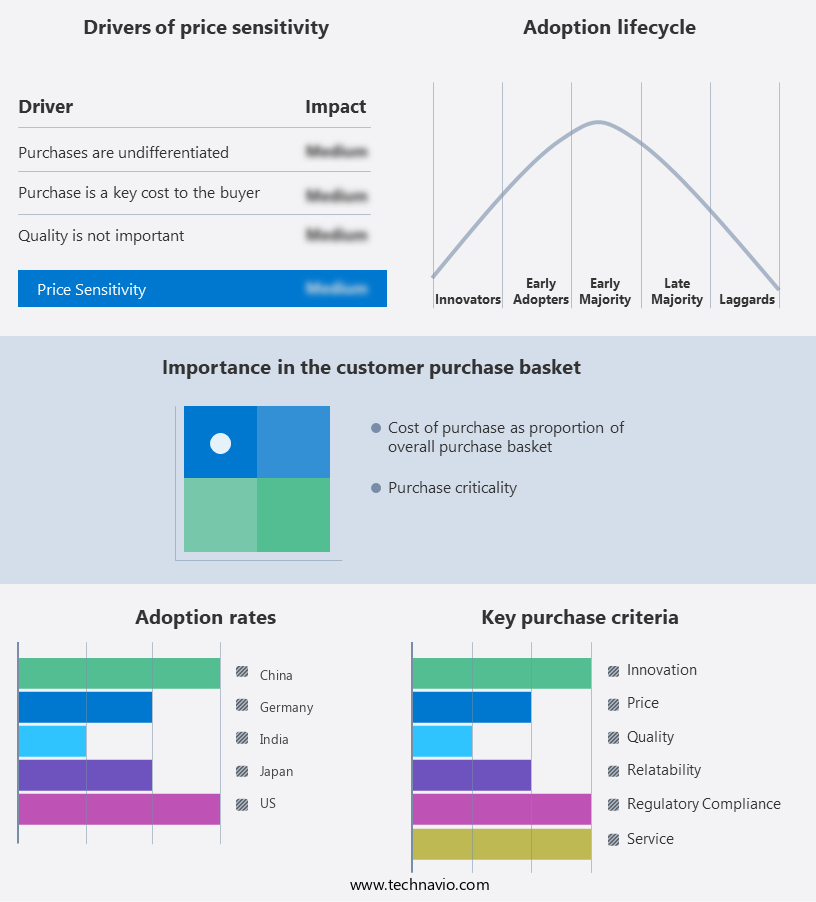
The acrylic acid market forecasting report includes the adoption lifecycle of the market, covering from the innovator's stage to the laggard's stage. It focuses on adoption rates in different regions based on penetration. Furthermore, the acrylic acid market report also includes key purchase criteria and drivers of price sensitivity to help companies evaluate and develop their market growth analysis strategies.

Acrylic Acid Market Share by Geography

 Customer Landscape of Acrylic Acid Industry

Key Companies & Market Insights

Companies are implementing various strategies, such as strategic alliances, acrylic acid market forecast, partnerships, mergers and acquisitions, geographical expansion, and product/service launches, to enhance their presence in the industry.

The industry research and growth report includes detailed analyses of the competitive landscape of the market and information about key companies, including:

  • Arkema S.A.
  • BASF SE
  • Celanese Corporation
  • China National Petroleum Corporation (CNPC)
  • Dow Chemical Company
  • Formosa Plastics Corporation
  • Hexion Inc.
  • INEOS Group Holdings S.A.
  • LG Chem Ltd.
  • Mitsubishi Chemical Corporation
  • Nippon Shokubai Co., Ltd.
  • Puyang Shenghong Chemical Co., Ltd.
  • Sasol Limited
  • Shandong Hongxin Chemical Co., Ltd.
  • Sumitomo Chemical Co., Ltd.
  • The Lubrizol Corporation
  • Tianjin Bohai Chemical Industry Group Corporation
  • TotalEnergies SE
  • Wanhua Chemical Group Co., Ltd.
  • Xinjiang Tianli High & New Tech Industry Co., Ltd.

Qualitative and quantitative analysis of companies has been conducted to help clients understand the wider business environment as well as the strengths and weaknesses of key industry players. Data is qualitatively analyzed to categorize companies as pure play, category-focused, industry-focused, and diversified; it is quantitatively analyzed to categorize companies as dominant, leading, strong, tentative, and weak.

Recent Development and News in Acrylic Acid Market

  • In January 2024, DuPont announced the expansion of its acrylic acid production capacity at its site in Tessenderlo, Belgium. The USD100 million investment aimed to increase production by 25%, strengthening DuPont's position as a leading global producer of acrylic acid (DuPont press release, 2024).
  • In March 2024, BASF and LG Chem entered into a strategic collaboration to develop and produce acrylic acid and butyl acrylate in South Korea. The partnership combined BASF's expertise in acrylic monomers with LG Chem's production capabilities, targeting the growing Asian market (BASF press release, 2024).
  • In May 2024, INEOS Styrolution, the world's leading styrenics supplier, acquired the acrylic monomers business of INEOS Olefins & Polymers Europe. The acquisition included production sites in Germany and the Netherlands, expanding INEOS Styrolution's portfolio and enhancing its integration into the value chain (INEOS Styrolution press release, 2024).
  • In February 2025, the European Chemicals Agency (ECHA) approved the renewal of the registration of acrylic acid under REACH. The approval confirmed the continued use of acrylic acid in various applications, ensuring the continuity of the market and reducing potential regulatory uncertainties (ECHA press release, 2025).

Research Analyst Overview

  • The market encompasses a wide range of applications, with a significant focus on the production of superabsorbent polymers (SAPs) and water-absorbing polymers. In the manufacturing process of SAPs, polymerization inhibitors play a crucial role in controlling the reaction rate and preventing premature polymerization. Sodium polyacrylate, a common SAP, is produced via dispersion polymerization, which involves the formation of monomer droplets in a continuous phase. Reactor design is a critical factor in optimizing the crosslinking density and polyacrylic acid properties during batch polymerization. The choice of reactor configuration, temperature, and agitation rate can significantly impact the yield and quality of the final product.
  • Purification techniques, such as filtration and crystallization, are employed to remove unreacted monomer and impurities, ensuring the desired molecular weight distribution and water retention capacity. Continuous polymerization processes, including free radical polymerization and emulsion polymerization, offer advantages in terms of process efficiency and product consistency. Initiator decomposition and chain transfer agents are essential components in these processes, influencing the initiation rate and molecular weight distribution. The acrylic ester synthesis process, which involves the reaction of acrylic acid with an alcohol, is another significant application of acrylic acid. The resulting polymers exhibit unique rheological properties, making them suitable for various applications, including hydrogel production and UV stability enhancement.
  • Swelling behavior, contact angle measurement, and thermal stability are essential properties that determine the performance of acrylic-based polymers in various applications. Understanding the monomer reactivity ratios and viscosity measurement during polymerization processes is crucial for optimizing the production of these materials. The market is expected to grow at a steady pace, with increasing demand from industries such as construction, agriculture, and healthcare. According to industry reports, the market is projected to expand by approximately 5% annually over the next decade, driven by the growing demand for water-absorbing polymers and acrylic ester-based products.

Dive into Technavio's robust research methodology, blending expert interviews, extensive data synthesis, and validated models for unparalleled Acrylic Acid Market insights. See full methodology.

Market Scope

Report Coverage

Details

Page number

148

Base year

2023

Historic period

2018-2022

Forecast period

2024-2028

Growth momentum & CAGR

Accelerate at a CAGR of 4.5%

Market growth 2024-2028

USD 3132.2 million

Market structure

Fragmented

YoY growth 2023-2024(%)

4.23

Key countries

US, Canada, Germany, UK, Italy, France, China, India, Japan, Brazil, Egypt, UAE, Oman, Argentina, KSA, UAE, Brazil, and Rest of World (ROW)

Competitive landscape

Leading Companies, Market Positioning of Companies, Competitive Strategies, and Industry Risks

Request Free Sample

What are the Key Data Covered in this Acrylic Acid Market Research and Growth Report?

  • CAGR of the Acrylic Acid industry during the forecast period
  • Detailed information on factors that will drive the growth and forecasting between 2024 and 2028
  • Precise estimation of the size of the market and its contribution of the industry in focus to the parent market
  • Accurate predictions about upcoming growth and trends and changes in consumer behaviour
  • Growth of the market across APAC, Europe, North America, Middle East and Africa, and South America
  • Thorough analysis of the market's competitive landscape and detailed information about companies
  • Comprehensive analysis of factors that will challenge the acrylic acid market growth of industry companies

We can help! Our analysts can customize this acrylic acid market research report to meet your requirements.

Get in touch

1 Executive Summary

  • 1.1 Market overview
    • Executive Summary - Chart on Market Overview
    • Executive Summary - Data Table on Market Overview
    • Executive Summary - Chart on Global Market Characteristics
    • Executive Summary - Chart on Market by Geography
    • Executive Summary - Chart on Market Segmentation by Application
    • Executive Summary - Chart on Incremental Growth
    • Executive Summary - Data Table on Incremental Growth
    • Executive Summary - Chart on Company Market Positioning

2 Market Landscape

  • 2.1 Market ecosystem
    • Parent Market
    • Data Table on - Parent Market
  • 2.2 Market characteristics
    • Market characteristics analysis
  • 2.3 Value chain analysis
    • Value Chain Analysis

3 Market Sizing

  • 3.1 Market definition
    • Offerings of companies included in the market definition
  • 3.2 Market segment analysis
    • Market segments
  • 3.3 Market size 2023
    • 3.4 Market outlook: Forecast for 2023-2028
      • Chart on Global - Market size and forecast 2023-2028 ($ million)
      • Data Table on Global - Market size and forecast 2023-2028 ($ million)
      • Chart on Global Market: Year-over-year growth 2023-2028 (%)
      • Data Table on Global Market: Year-over-year growth 2023-2028 (%)

    4 Historic Market Size

    • 4.1 Global Acrylic Acid Market 2018 - 2022
      • Historic Market Size - Data Table on Global Acrylic Acid Market 2018 - 2022 ($ million)
    • 4.2 Application segment analysis 2018 - 2022
      • Historic Market Size - Application Segment 2018 - 2022 ($ million)
    • 4.3 Geography segment analysis 2018 - 2022
      • Historic Market Size - Geography Segment 2018 - 2022 ($ million)
    • 4.4 Country segment analysis 2018 - 2022
      • Historic Market Size - Country Segment 2018 - 2022 ($ million)

    5 Five Forces Analysis

    • 5.1 Five forces summary
      • Five forces analysis - Comparison between 2023 and 2028
    • 5.2 Bargaining power of buyers
      • Bargaining power of buyers - Impact of key factors 2023 and 2028
    • 5.3 Bargaining power of suppliers
      • Bargaining power of suppliers - Impact of key factors in 2023 and 2028
    • 5.4 Threat of new entrants
      • Threat of new entrants - Impact of key factors in 2023 and 2028
    • 5.5 Threat of substitutes
      • Threat of substitutes - Impact of key factors in 2023 and 2028
    • 5.6 Threat of rivalry
      • Threat of rivalry - Impact of key factors in 2023 and 2028
    • 5.7 Market condition
      • Chart on Market condition - Five forces 2023 and 2028

    6 Market Segmentation by Application

    • 6.1 Market segments
      • Chart on Application - Market share (2023-2028) (%)
      • Data Table on Application - Market share (2023-2028) (%)
    • 6.2 Comparison by Application
      • Chart on Comparison by Application
      • Data Table on Comparison by Application
    • 6.3 Acrylic esters - Market size and forecast (2023-2028)
      • Chart on Acrylic esters - Market size and forecast (2023-2028) ($ million)
      • Data Table on Acrylic esters - Market size and forecast (2023-2028) ($ million)
      • Chart on Acrylic esters - Year-over-year growth (2023-2028) (%)
      • Data Table on Acrylic esters - Year-over-year growth (2023-2028) (%)
    • 6.4 Superabsorbent polymers - Market size and forecast (2023-2028)
      • Chart on Superabsorbent polymers - Market size and forecast (2023-2028) ($ million)
      • Data Table on Superabsorbent polymers - Market size and forecast (2023-2028) ($ million)
      • Chart on Superabsorbent polymers - Year-over-year growth (2023-2028) (%)
      • Data Table on Superabsorbent polymers - Year-over-year growth (2023-2028) (%)
    • 6.5 Synthetic detergents - Market size and forecast (2023-2028)
      • Chart on Synthetic detergents - Market size and forecast (2023-2028) ($ million)
      • Data Table on Synthetic detergents - Market size and forecast (2023-2028) ($ million)
      • Chart on Synthetic detergents - Year-over-year growth (2023-2028) (%)
      • Data Table on Synthetic detergents - Year-over-year growth (2023-2028) (%)
    • 6.6 Others - Market size and forecast (2023-2028)
      • Chart on Others - Market size and forecast (2023-2028) ($ million)
      • Data Table on Others - Market size and forecast (2023-2028) ($ million)
      • Chart on Others - Year-over-year growth (2023-2028) (%)
      • Data Table on Others - Year-over-year growth (2023-2028) (%)
    • 6.7 Market opportunity by Application
      • Market opportunity by Application ($ million)
      • Data Table on Market opportunity by Application ($ million)

    7 Market Segmentation by Derivative Type

    • 7.1 Market segments
      • Chart on Derivative Type - Market share (2023-2028) (%)
      • Data Table on Derivative Type - Market share (2023-2028) (%)
    • 7.2 Comparison by Derivative Type
      • Chart on Comparison by Derivative Type
      • Data Table on Comparison by Derivative Type
    • 7.3 Acrylic Esters (Methyl Acrylate, Ethyl Acrylate, Butyl Acrylate, 2-Ethylhexyl Acrylate) - Market size and forecast (2023-2028)
      • Chart on Acrylic Esters (Methyl Acrylate, Ethyl Acrylate, Butyl Acrylate, 2-Ethylhexyl Acrylate) - Market size and forecast (2023-2028) ($ million)
      • Data Table on Acrylic Esters (Methyl Acrylate, Ethyl Acrylate, Butyl Acrylate, 2-Ethylhexyl Acrylate) - Market size and forecast (2023-2028) ($ million)
      • Chart on Acrylic Esters (Methyl Acrylate, Ethyl Acrylate, Butyl Acrylate, 2-Ethylhexyl Acrylate) - Year-over-year growth (2023-2028) (%)
      • Data Table on Acrylic Esters (Methyl Acrylate, Ethyl Acrylate, Butyl Acrylate, 2-Ethylhexyl Acrylate) - Year-over-year growth (2023-2028) (%)
    • 7.4 Superabsorbent Polymers (SAP) - Market size and forecast (2023-2028)
      • Chart on Superabsorbent Polymers (SAP) - Market size and forecast (2023-2028) ($ million)
      • Data Table on Superabsorbent Polymers (SAP) - Market size and forecast (2023-2028) ($ million)
      • Chart on Superabsorbent Polymers (SAP) - Year-over-year growth (2023-2028) (%)
      • Data Table on Superabsorbent Polymers (SAP) - Year-over-year growth (2023-2028) (%)
    • 7.5 Other Derivatives - Market size and forecast (2023-2028)
      • Chart on Other Derivatives - Market size and forecast (2023-2028) ($ million)
      • Data Table on Other Derivatives - Market size and forecast (2023-2028) ($ million)
      • Chart on Other Derivatives - Year-over-year growth (2023-2028) (%)
      • Data Table on Other Derivatives - Year-over-year growth (2023-2028) (%)
    • 7.6 Market opportunity by Derivative Type
      • Market opportunity by Derivative Type ($ million)
      • Data Table on Market opportunity by Derivative Type ($ million)

    8 Customer Landscape

    • 8.1 Customer landscape overview
      • Analysis of price sensitivity, lifecycle, customer purchase basket, adoption rates, and purchase criteria

    9 Geographic Landscape

    • 9.1 Geographic segmentation
      • Chart on Market share by geography 2023-2028 (%)
      • Data Table on Market share by geography 2023-2028 (%)
    • 9.2 Geographic comparison
      • Chart on Geographic comparison
      • Data Table on Geographic comparison
    • 9.3 APAC - Market size and forecast 2023-2028
      • Chart on APAC - Market size and forecast 2023-2028 ($ million)
      • Data Table on APAC - Market size and forecast 2023-2028 ($ million)
      • Chart on APAC - Year-over-year growth 2023-2028 (%)
      • Data Table on APAC - Year-over-year growth 2023-2028 (%)
    • 9.4 Europe - Market size and forecast 2023-2028
      • Chart on Europe - Market size and forecast 2023-2028 ($ million)
      • Data Table on Europe - Market size and forecast 2023-2028 ($ million)
      • Chart on Europe - Year-over-year growth 2023-2028 (%)
      • Data Table on Europe - Year-over-year growth 2023-2028 (%)
    • 9.5 North America - Market size and forecast 2023-2028
      • Chart on North America - Market size and forecast 2023-2028 ($ million)
      • Data Table on North America - Market size and forecast 2023-2028 ($ million)
      • Chart on North America - Year-over-year growth 2023-2028 (%)
      • Data Table on North America - Year-over-year growth 2023-2028 (%)
    • 9.6 Middle East and Africa - Market size and forecast 2023-2028
      • Chart on Middle East and Africa - Market size and forecast 2023-2028 ($ million)
      • Data Table on Middle East and Africa - Market size and forecast 2023-2028 ($ million)
      • Chart on Middle East and Africa - Year-over-year growth 2023-2028 (%)
      • Data Table on Middle East and Africa - Year-over-year growth 2023-2028 (%)
    • 9.7 South America - Market size and forecast 2023-2028
      • Chart on South America - Market size and forecast 2023-2028 ($ million)
      • Data Table on South America - Market size and forecast 2023-2028 ($ million)
      • Chart on South America - Year-over-year growth 2023-2028 (%)
      • Data Table on South America - Year-over-year growth 2023-2028 (%)
    • 9.8 China - Market size and forecast 2023-2028
      • Chart on China - Market size and forecast 2023-2028 ($ million)
      • Data Table on China - Market size and forecast 2023-2028 ($ million)
      • Chart on China - Year-over-year growth 2023-2028 (%)
      • Data Table on China - Year-over-year growth 2023-2028 (%)
    • 9.9 US - Market size and forecast 2023-2028
      • Chart on US - Market size and forecast 2023-2028 ($ million)
      • Data Table on US - Market size and forecast 2023-2028 ($ million)
      • Chart on US - Year-over-year growth 2023-2028 (%)
      • Data Table on US - Year-over-year growth 2023-2028 (%)
    • 9.10 Japan - Market size and forecast 2023-2028
      • Chart on Japan - Market size and forecast 2023-2028 ($ million)
      • Data Table on Japan - Market size and forecast 2023-2028 ($ million)
      • Chart on Japan - Year-over-year growth 2023-2028 (%)
      • Data Table on Japan - Year-over-year growth 2023-2028 (%)
    • 9.11 Germany - Market size and forecast 2023-2028
      • Chart on Germany - Market size and forecast 2023-2028 ($ million)
      • Data Table on Germany - Market size and forecast 2023-2028 ($ million)
      • Chart on Germany - Year-over-year growth 2023-2028 (%)
      • Data Table on Germany - Year-over-year growth 2023-2028 (%)
    • 9.12 India - Market size and forecast 2023-2028
      • Chart on India - Market size and forecast 2023-2028 ($ million)
      • Data Table on India - Market size and forecast 2023-2028 ($ million)
      • Chart on India - Year-over-year growth 2023-2028 (%)
      • Data Table on India - Year-over-year growth 2023-2028 (%)
    • 9.13 Market opportunity by geography
      • Market opportunity by geography ($ million)
      • Data Tables on Market opportunity by geography ($ million)
    • 9.14 Canada - Market size and forecast (2023-2028)
      • Chart on Canada - Market size and forecast (2023-2028) ($ million)
      • Data Table on Canada - Market size and forecast (2023-2028) ($ million)
      • Chart on Canada - Year-over-year growth (2023-2028) (%)
      • Data Table on Canada - Year-over-year growth (2023-2028) (%)
    • 9.15 UK - Market size and forecast (2023-2028)
      • Chart on UK - Market size and forecast (2023-2028) ($ million)
      • Data Table on UK - Market size and forecast (2023-2028) ($ million)
      • Chart on UK - Year-over-year growth (2023-2028) (%)
      • Data Table on UK - Year-over-year growth (2023-2028) (%)
    • 9.16 Italy - Market size and forecast (2023-2028)
      • Chart on Italy - Market size and forecast (2023-2028) ($ million)
      • Data Table on Italy - Market size and forecast (2023-2028) ($ million)
      • Chart on Italy - Year-over-year growth (2023-2028) (%)
      • Data Table on Italy - Year-over-year growth (2023-2028) (%)
    • 9.17 France - Market size and forecast (2023-2028)
      • Chart on France - Market size and forecast (2023-2028) ($ million)
      • Data Table on France - Market size and forecast (2023-2028) ($ million)
      • Chart on France - Year-over-year growth (2023-2028) (%)
      • Data Table on France - Year-over-year growth (2023-2028) (%)
    • 9.18 Brazil - Market size and forecast (2023-2028)
      • Chart on Brazil - Market size and forecast (2023-2028) ($ million)
      • Data Table on Brazil - Market size and forecast (2023-2028) ($ million)
      • Chart on Brazil - Year-over-year growth (2023-2028) (%)
      • Data Table on Brazil - Year-over-year growth (2023-2028) (%)
    • 9.19 Egypt - Market size and forecast (2023-2028)
      • Chart on Egypt - Market size and forecast (2023-2028) ($ million)
      • Data Table on Egypt - Market size and forecast (2023-2028) ($ million)
      • Chart on Egypt - Year-over-year growth (2023-2028) (%)
      • Data Table on Egypt - Year-over-year growth (2023-2028) (%)
    • 9.20 UAE - Market size and forecast (2023-2028)
      • Chart on UAE - Market size and forecast (2023-2028) ($ million)
      • Data Table on UAE - Market size and forecast (2023-2028) ($ million)
      • Chart on UAE - Year-over-year growth (2023-2028) (%)
      • Data Table on UAE - Year-over-year growth (2023-2028) (%)
    • 9.21 Oman - Market size and forecast (2023-2028)
      • Chart on Oman - Market size and forecast (2023-2028) ($ million)
      • Data Table on Oman - Market size and forecast (2023-2028) ($ million)
      • Chart on Oman - Year-over-year growth (2023-2028) (%)
      • Data Table on Oman - Year-over-year growth (2023-2028) (%)
    • 9.22 Argentina - Market size and forecast (2023-2028)
      • Chart on Argentina - Market size and forecast (2023-2028) ($ million)
      • Data Table on Argentina - Market size and forecast (2023-2028) ($ million)
      • Chart on Argentina - Year-over-year growth (2023-2028) (%)
      • Data Table on Argentina - Year-over-year growth (2023-2028) (%)
    • 9.23 KSA - Market size and forecast (2023-2028)
      • Chart on KSA - Market size and forecast (2023-2028) ($ million)
      • Data Table on KSA - Market size and forecast (2023-2028) ($ million)
      • Chart on KSA - Year-over-year growth (2023-2028) (%)
      • Data Table on KSA - Year-over-year growth (2023-2028) (%)
    • 9.24 UAE - Market size and forecast (2023-2028)
      • Chart on UAE - Market size and forecast (2023-2028) ($ million)
      • Data Table on UAE - Market size and forecast (2023-2028) ($ million)
      • Chart on UAE - Year-over-year growth (2023-2028) (%)
      • Data Table on UAE - Year-over-year growth (2023-2028) (%)
    • 9.25 Brazil - Market size and forecast (2023-2028)
      • Chart on Brazil - Market size and forecast (2023-2028) ($ million)
      • Data Table on Brazil - Market size and forecast (2023-2028) ($ million)
      • Chart on Brazil - Year-over-year growth (2023-2028) (%)
      • Data Table on Brazil - Year-over-year growth (2023-2028) (%)
    • 9.26 Rest of World (ROW) - Market size and forecast (2023-2028)
      • Chart on Rest of World (ROW) - Market size and forecast (2023-2028) ($ million)
      • Data Table on Rest of World (ROW) - Market size and forecast (2023-2028) ($ million)
      • Chart on Rest of World (ROW) - Year-over-year growth (2023-2028) (%)
      • Data Table on Rest of World (ROW) - Year-over-year growth (2023-2028) (%)

    10 Drivers, Challenges, and Opportunity/Restraints

    • 10.1 Market drivers
      • 10.2 Market challenges
        • 10.3 Impact of drivers and challenges
          • Impact of drivers and challenges in 2023 and 2028
        • 10.4 Market opportunities/restraints

          11 Competitive Landscape

          • 11.1 Overview
            • 11.2 Competitive Landscape
              • Overview on criticality of inputs and factors of differentiation
            • 11.3 Landscape disruption
              • Overview on factors of disruption
            • 11.4 Industry risks
              • Impact of key risks on business

            12 Competitive Analysis

            • 12.1 Companies profiled
              • Companies covered
            • 12.2 Market positioning of companies
              • Matrix on companies position and classification
            • 12.3 Arkema S.A.
              • Arkema S.A. - Overview
              • Arkema S.A. - Product / Service
              • Arkema S.A. - Key offerings
            • 12.4 BASF SE
              • BASF SE - Overview
              • BASF SE - Product / Service
              • BASF SE - Key offerings
            • 12.5 Celanese Corporation
              • Celanese Corporation - Overview
              • Celanese Corporation - Product / Service
              • Celanese Corporation - Key offerings
            • 12.6 China National Petroleum Corporation (CNPC)
              • China National Petroleum Corporation (CNPC) - Overview
              • China National Petroleum Corporation (CNPC) - Product / Service
              • China National Petroleum Corporation (CNPC) - Key offerings
            • 12.7 Dow Chemical Company
              • Dow Chemical Company - Overview
              • Dow Chemical Company - Product / Service
              • Dow Chemical Company - Key offerings
            • 12.8 Formosa Plastics Corporation
              • Formosa Plastics Corporation - Overview
              • Formosa Plastics Corporation - Product / Service
              • Formosa Plastics Corporation - Key offerings
            • 12.9 Hexion Inc.
              • Hexion Inc. - Overview
              • Hexion Inc. - Product / Service
              • Hexion Inc. - Key offerings
            • 12.10 INEOS Group Holdings S.A.
              • INEOS Group Holdings S.A. - Overview
              • INEOS Group Holdings S.A. - Product / Service
              • INEOS Group Holdings S.A. - Key offerings
            • 12.11 LG Chem Ltd.
              • LG Chem Ltd. - Overview
              • LG Chem Ltd. - Product / Service
              • LG Chem Ltd. - Key offerings
            • 12.12 Mitsubishi Chemical Corporation
              • Mitsubishi Chemical Corporation - Overview
              • Mitsubishi Chemical Corporation - Product / Service
              • Mitsubishi Chemical Corporation - Key offerings
            • 12.13 Nippon Shokubai Co., Ltd.
              • Nippon Shokubai Co., Ltd. - Overview
              • Nippon Shokubai Co., Ltd. - Product / Service
              • Nippon Shokubai Co., Ltd. - Key offerings
            • 12.14 Puyang Shenghong Chemical Co., Ltd.
              • Puyang Shenghong Chemical Co., Ltd. - Overview
              • Puyang Shenghong Chemical Co., Ltd. - Product / Service
              • Puyang Shenghong Chemical Co., Ltd. - Key offerings
            • 12.15 Sasol Limited
              • Sasol Limited - Overview
              • Sasol Limited - Product / Service
              • Sasol Limited - Key offerings
            • 12.16 Shandong Hongxin Chemical Co., Ltd.
              • Shandong Hongxin Chemical Co., Ltd. - Overview
              • Shandong Hongxin Chemical Co., Ltd. - Product / Service
              • Shandong Hongxin Chemical Co., Ltd. - Key offerings
            • 12.17 Sumitomo Chemical Co., Ltd.
              • Sumitomo Chemical Co., Ltd. - Overview
              • Sumitomo Chemical Co., Ltd. - Product / Service
              • Sumitomo Chemical Co., Ltd. - Key offerings
            • 12.18 The Lubrizol Corporation
              • The Lubrizol Corporation - Overview
              • The Lubrizol Corporation - Product / Service
              • The Lubrizol Corporation - Key offerings
            • 12.19 Tianjin Bohai Chemical Industry Group Corporation
              • Tianjin Bohai Chemical Industry Group Corporation - Overview
              • Tianjin Bohai Chemical Industry Group Corporation - Product / Service
              • Tianjin Bohai Chemical Industry Group Corporation - Key offerings
            • 12.20 TotalEnergies SE
              • TotalEnergies SE - Overview
              • TotalEnergies SE - Product / Service
              • TotalEnergies SE - Key offerings
            • 12.21 Wanhua Chemical Group Co., Ltd.
              • Wanhua Chemical Group Co., Ltd. - Overview
              • Wanhua Chemical Group Co., Ltd. - Product / Service
              • Wanhua Chemical Group Co., Ltd. - Key offerings
            • 12.22 Xinjiang Tianli High & New Tech Industry Co., Ltd.
              • Xinjiang Tianli High & New Tech Industry Co., Ltd. - Overview
              • Xinjiang Tianli High & New Tech Industry Co., Ltd. - Product / Service
              • Xinjiang Tianli High & New Tech Industry Co., Ltd. - Key offerings
            • 12.23 Acuro Organics Ltd.
              • Acuro Organics Ltd. - Overview
              • Acuro Organics Ltd. - Product / Service
              • Acuro Organics Ltd. - Key offerings
            • 12.24 Arkema Group
              • Arkema Group - Overview
              • Arkema Group - Product / Service
              • Arkema Group - Key offerings
            • 12.25 Ashland Inc.
              • Ashland Inc. - Overview
              • Ashland Inc. - Product / Service
              • Ashland Inc. - Key offerings
            • 12.26 ATULYA CHEMICALS
              • ATULYA CHEMICALS - Overview
              • ATULYA CHEMICALS - Product / Service
              • ATULYA CHEMICALS - Key offerings
            • 12.27 BASF SE
              • BASF SE - Overview
              • BASF SE - Product / Service
              • BASF SE - Key offerings
            • 12.28 Cargill Inc.
              • Cargill Inc. - Overview
              • Cargill Inc. - Product / Service
              • Cargill Inc. - Key offerings
            • 12.29 EMCO Dyestuff Pvt. Ltd.
              • EMCO Dyestuff Pvt. Ltd. - Overview
              • EMCO Dyestuff Pvt. Ltd. - Product / Service
              • EMCO Dyestuff Pvt. Ltd. - Key offerings
            • 12.30 Evonik Industries AG
              • Evonik Industries AG - Overview
              • Evonik Industries AG - Product / Service
              • Evonik Industries AG - Key offerings
            • 12.31 Formosa Plastics Corp.
              • Formosa Plastics Corp. - Overview
              • Formosa Plastics Corp. - Product / Service
              • Formosa Plastics Corp. - Key offerings
            • 12.32 LG Electronics Inc.
              • LG Electronics Inc. - Overview
              • LG Electronics Inc. - Product / Service
              • LG Electronics Inc. - Key offerings
            • 12.33 Libra Speciality Chemicals Ltd.
              • Libra Speciality Chemicals Ltd. - Overview
              • Libra Speciality Chemicals Ltd. - Product / Service
              • Libra Speciality Chemicals Ltd. - Key offerings
            • 12.34 Merck KGaA
              • Merck KGaA - Overview
              • Merck KGaA - Product / Service
              • Merck KGaA - Key offerings
            • 12.35 Mitsubishi Chemical Group Corp.
              • Mitsubishi Chemical Group Corp. - Overview
              • Mitsubishi Chemical Group Corp. - Product / Service
              • Mitsubishi Chemical Group Corp. - Key offerings
            • 12.36 Nippon Shokubai Co. Ltd.
              • Nippon Shokubai Co. Ltd. - Overview
              • Nippon Shokubai Co. Ltd. - Product / Service
              • Nippon Shokubai Co. Ltd. - Key offerings
            • 12.37 Sasol Ltd.
              • Sasol Ltd. - Overview
              • Sasol Ltd. - Product / Service
              • Sasol Ltd. - Key offerings
            • 12.38 Shanghai Huayi Acrylic Acid Co. Ltd.
              • Shanghai Huayi Acrylic Acid Co. Ltd. - Overview
              • Shanghai Huayi Acrylic Acid Co. Ltd. - Product / Service
              • Shanghai Huayi Acrylic Acid Co. Ltd. - Key offerings
            • 12.39 SIBUR International GmbH
              • SIBUR International GmbH - Overview
              • SIBUR International GmbH - Product / Service
              • SIBUR International GmbH - Key offerings
            • 12.40 The Lubrizol Corp.
              • The Lubrizol Corp. - Overview
              • The Lubrizol Corp. - Product / Service
              • The Lubrizol Corp. - Key offerings
            • 12.41 Toagosei Co. Ltd.
              • Toagosei Co. Ltd. - Overview
              • Toagosei Co. Ltd. - Product / Service
              • Toagosei Co. Ltd. - Key offerings
            • 12.42 Vizag Chemical International
              • Vizag Chemical International - Overview
              • Vizag Chemical International - Product / Service
              • Vizag Chemical International - Key offerings

            13 Appendix

            • 13.1 Scope of the report
              • 13.2 Inclusions and exclusions checklist
                • Inclusions checklist
                • Exclusions checklist
              • 13.3 Currency conversion rates for US$
                • Currency conversion rates for US$
              • 13.4 Research methodology
                • Research methodology
              • 13.5 Data procurement
                • Information sources
              • 13.6 Data validation
                • Data validation
              • 13.7 Validation techniques employed for market sizing
                • Validation techniques employed for market sizing
              • 13.8 Data synthesis
                • Data synthesis
              • 13.9 360 degree market analysis
                • 360 degree market analysis
              • 13.10 List of abbreviations
                • List of abbreviations

              Research Methodology

              Technavio presents a detailed picture of the market by way of study, synthesis, and summation of data from multiple sources. The analysts have presented the various facets of the market with a particular focus on identifying the key industry influencers. The data thus presented is comprehensive, reliable, and the result of extensive research, both primary and secondary.

              INFORMATION SOURCES

              Primary sources

              • Manufacturers and suppliers
              • Channel partners
              • Industry experts
              • Strategic decision makers

              Secondary sources

              • Industry journals and periodicals
              • Government data
              • Financial reports of key industry players
              • Historical data
              • Press releases

              DATA ANALYSIS

              Data Synthesis

              • Collation of data
              • Estimation of key figures
              • Analysis of derived insights

              Data Validation

              • Triangulation with data models
              • Reference against proprietary databases
              • Corroboration with industry experts

              REPORT WRITING

              Qualitative

              • Market drivers
              • Market challenges
              • Market trends
              • Five forces analysis

              Quantitative

              • Market size and forecast
              • Market segmentation
              • Geographical insights
              • Competitive landscape

              Interested in this report?

              Get your sample now to see our research methodology and insights!

              Download Now

              Frequently Asked Questions

              Acrylic Acid market growth will increase by $ 3132.2 mn during 2024-2028.

              The Acrylic Acid market is expected to grow at a CAGR of 4.5% during 2024-2028.

              Acrylic Acid market is segmented by Application( Acrylic esters, Superabsorbent polymers, Synthetic detergents, Others) Derivative Type( Acrylic Esters (Methyl Acrylate, Ethyl Acrylate, Butyl Acrylate, 2-Ethylhexyl Acrylate), Superabsorbent Polymers (SAP), Other Derivatives)

              Arkema S.A., BASF SE, Celanese Corporation, China National Petroleum Corporation (CNPC), Dow Chemical Company, Formosa Plastics Corporation, Hexion Inc., INEOS Group Holdings S.A., LG Chem Ltd., Mitsubishi Chemical Corporation, Nippon Shokubai Co., Ltd., Puyang Shenghong Chemical Co., Ltd., Sasol Limited, Shandong Hongxin Chemical Co., Ltd., Sumitomo Chemical Co., Ltd., The Lubrizol Corporation, Tianjin Bohai Chemical Industry Group Corporation, TotalEnergies SE, Wanhua Chemical Group Co., Ltd., Xinjiang Tianli High & New Tech Industry Co., Ltd. are a few of the key vendors in the Acrylic Acid market.

              APAC will register the highest growth rate of 45% among the other regions. Therefore, the Acrylic Acid market in APAC is expected to garner significant business opportunities for the vendors during the forecast period.

              US, Canada, Germany, UK, Italy, France, China, India, Japan, Brazil, Egypt, UAE, Oman, Argentina, KSA, UAE, Brazil, Rest of World (ROW)

              • Increased demand for acrylic acid derivatives in surface coating applicationsSurface coating is the largest application segment of the global acrylic acid market. Acrylic esters are highly used as binders in water-borne coatings. There is a greater growth opportunity for the global acrylic acid market with the rapid replacement of water-borne coatings with solvent-borne coatings. Limited volatile organic compound (VOC) emission is one of the major factors for the increased consumption of acrylic acid derivatives in insulation and industrial coating applications. The restriction on the use of products containing VOC and harmful constituents by the Environmental Protection Agency (EPA) and Registration is the driving factor this market.
              • Evaluation is the driving factor this market.
              • Authorization is the driving factor this market.
              • and Restriction of Chemicals (REACH) can further increase the consumption rate of acrylic derivatives in industrial coatings and insulation applications. Acrylic hybrid coatings are manufactured through the chemical reaction between an acrylic polymer and compatible functional polymers or directly by physical blending. It is mainly needed in the surface coating applications in regions such as APAC and North America is the driving factor this market.
              • owing to the rapid improvement in the construction is the driving factor this market.
              • automobile is the driving factor this market.
              • and aviation industries. For instance is the driving factor this market.
              • in March 2022 is the driving factor this market.
              • BASF SE announced the launch of its new automotive coatings application center at Coatings Technology Center in Mangalore is the driving factor this market.
              • India. This initiative is intended to strengthen its market position in the fastest-growing APAC region for automotive coating solutions. Such factors are expected to drive the growth of the global acrylic acid market during the forecast period. is the driving factor this market.

              The Acrylic Acid market vendors should focus on grabbing business opportunities from the Acrylic esters segment as it accounted for the largest market share in the base year.