Acrylonitrile Market Analysis, Size, and Forecast 2025-2029: North America (US and Canada), Europe (France, Germany, Italy, and UK), APAC (China, India, Japan, and South Korea), and Rest of World (ROW)

Acrylonitrile Market Analysis, Size, and Forecast 2025-2029:
North America (US and Canada), Europe (France, Germany, Italy, and UK), APAC (China, India, Japan, and South Korea), and Rest of World (ROW)

Published: Dec 2024 218 Pages SKU: IRTNTR43823

Market Overview at a Glance

$2.04 B
Market Opportunity
3.2%
CAGR
3.1
YoY growth 2024-2025(%)

Acrylonitrile Market Size 2025-2029

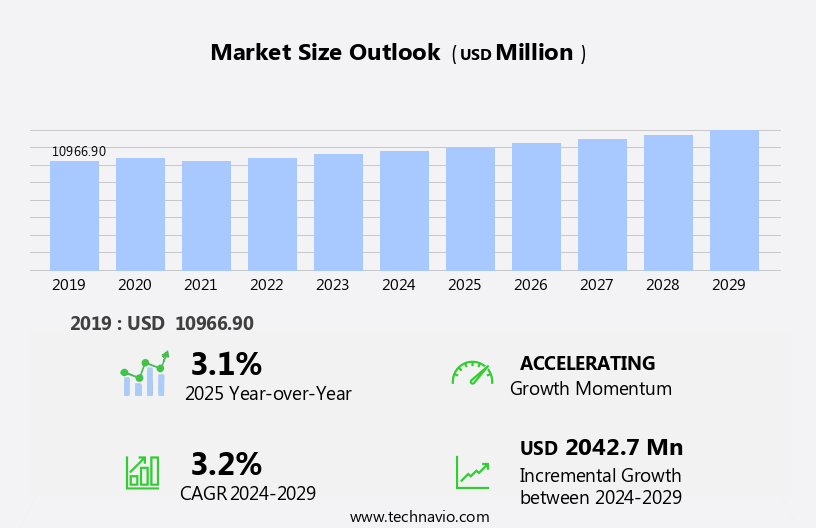
The acrylonitrile market size is forecast to increase by USD 2.04 billion, at a CAGR of 3.2% between 2024 and 2029.

  • The market is driven by robust demand, particularly in the Asia Pacific region, where the growth is underpinned by increasing production of carbon fiber and other high-performance materials. This trend is expected to continue as the demand for lightweight and durable materials increases in various industries, including the automotive industry and aerospace industries. However, the market faces significant challenges due to stringent regulations and health hazards associated with acrylonitrile production and use. These challenges necessitate the adoption of advanced technologies and sustainable production methods to mitigate risks and ensure compliance with environmental, health, and safety standards.
  • Companies seeking to capitalize on market opportunities and navigate challenges effectively should focus on innovation, sustainability, and regulatory compliance. By investing in research and development, collaborating with industry partners, and adopting best practices, they can differentiate themselves and maintain a competitive edge in the dynamic market.

What will be the Size of the Acrylonitrile Market during the forecast period?

Acrylonitrile Market Size

Explore in-depth regional segment analysis with market size data - historical 2019-2023 and forecasts 2025-2029 - in the full report.  
Request Free Sample

The market continues to evolve, driven by advancements in manufacturing processes and applications across various sectors. Acrylonitrile is a versatile monomer used in the production of fibers, polymers, and copolymers, among other applications. For instance, in the fiber production process, process optimization and catalyst optimization play crucial roles in enhancing yield improvement and UV resistance properties. In the realm of disposal methods, recycling methods have gained significant attention due to their environmental benefits. Acrylonitrile purification and adiponitrile synthesis are essential steps in the manufacturing process that require stringent quality control measures to ensure solvent resistance and thermal stability testing.

Moreover, the transportation regulations governing the storage and handling of acrylonitrile monomer purity and safety protocols are continually evolving to minimize emission control and improve reaction kinetics. For example, the market is projected to grow at a robust rate, with an anticipated industry growth of 5% per annum. Polyacrylonitrile fiber, a key application of acrylonitrile, is extensively used in sanitaryware production due to its mechanical property analysis and chemical resistance testing. Copolymerization techniques, such as acrylamide production and nitrile rubber synthesis, expand the scope of acrylonitrile applications further. Carbon fiber production, a high-performance application, relies on the optimization of manufacturing processes and molecular weight distribution to achieve superior strength and durability.

Wastewater treatment and emission control are essential aspects of the acrylonitrile industry, ensuring sustainable production methods. Acrylonitrile derivatives, including polymer chain length analysis and acrylonitrile monomer purity, are subjected to rigorous testing for various applications, including automotive, construction, and electronics industries. The continuous unfolding of market activities and evolving patterns underscores the dynamic nature of the market.

How is this Acrylonitrile Industry segmented?

The acrylonitrile industry research report provides comprehensive data (region-wise segment analysis), with forecasts and estimates in "USD million" for the period 2025-2029, as well as historical data from 2019-2023 for the following segments.

  • Application
    • ABS and SAN
    • Acrylic fibers
    • Polyacrylamide
    • Nitrile butadiene rubber
    • Others
  • End-user
    • Electrical and electronics
    • Automotive
    • Construction
    • Packaging
    • Others
  • Process Technology
    • Ammoxidation Process
    • Others
  • Geography
    • North America
      • US
      • Canada
    • Europe
      • France
      • Germany
      • Italy
      • UK
    • APAC
      • China
      • India
      • Japan
      • South Korea
    • Rest of World (ROW)

By Application Insights

The ABS and SAN segment is estimated to witness significant growth during the forecast period.

Acrylonitrile, a crucial monomer, plays a significant role in the production of various polymers, including acrylonitrile butadiene styrene (ABS) and styrene-acrylonitrile (SAN), which find extensive applications in diverse industries. In the manufacturing process, acrylonitrile is polymerized using catalyst optimization to produce polymers with desirable properties. Mechanical property analysis and molecular weight distribution are crucial in ensuring the production of high-quality polymers. Acrylonitrile's UV resistance properties make it an ideal choice for outdoor applications, such as automotive parts and construction materials. ABS, for instance, is used in automotive applications, including instrument panels, pillar trim, and dashboard components, due to its high impact resistance, excellent insulating properties, and outstanding surface brightness.

The automotive industry's growth, driven by increasing vehicle production and sales, is expected to fuel the demand for acrylonitrile polymers. Disposal methods and emission control are essential considerations in the acrylonitrile production process. Recycling methods are being explored to minimize waste and reduce environmental impact. For instance, carbon fiber production from acrylonitrile offers a sustainable solution, with a recycling rate of up to 90%. Quality control measures and safety protocols are essential in acrylonitrile production to ensure product specifications and worker safety. Acrylonitrile monomer purity is critical in maintaining the desired polymer properties. Reaction kinetics and thermal stability testing are employed to optimize manufacturing processes and improve yields.

The market for acrylonitrile and its derivatives is expected to grow at a steady pace, driven by the increasing demand for applications in various industries. For example, the sanitaryware industry uses acrylonitrile to produce bathtubs, sinks, and toilets due to its chemical resistance and ease of processing. In conclusion, the market is dynamic and evolving, driven by the diverse applications of its polymers in various industries. The demand for high-performance materials with desirable properties, such as impact resistance, chemical resistance, and UV resistance, is expected to fuel the growth of the market. Additionally, the focus on sustainability and waste reduction is leading to innovations in recycling methods and the production of eco-friendly acrylonitrile derivatives.

Acrylonitrile Market Size

Request Free Sample

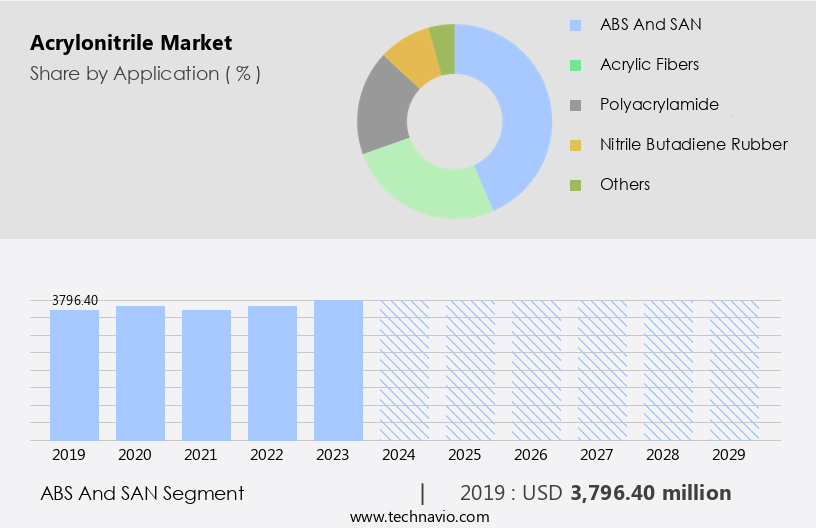
The ABS and SAN segment was valued at USD 3.8 billion in 2019 and showed a gradual increase during the forecast period.

Regional Analysis

APAC is estimated to contribute 67% to the growth of the global market during the forecast period. Technavio's analysts have elaborately explained the regional trends and drivers that shape the market during the forecast period.

Acrylonitrile Market Share by Geography

 Request Free Sample

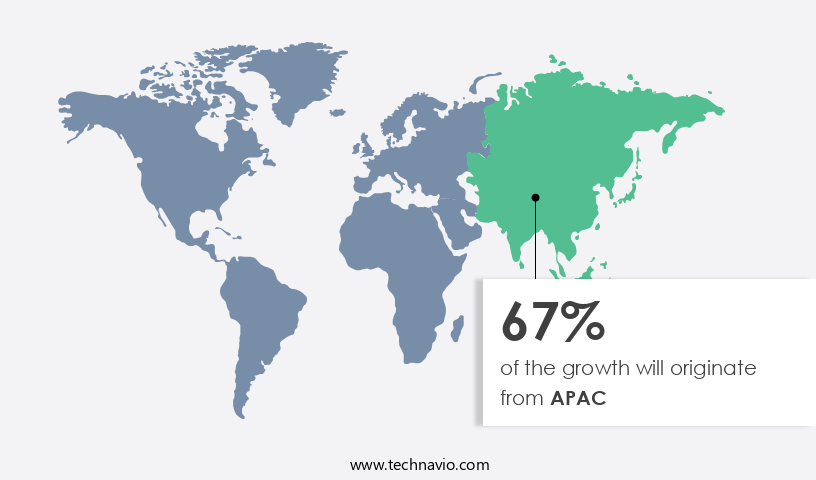
The market in Asia Pacific is experiencing significant growth, driven primarily by the automotive, construction, and water treatment industries. Acrylonitrile is a versatile chemical used in manufacturing ABS plastics, elastomers, and synthetic fibers for various applications in these sectors. In the automotive industry, acrylonitrile is a key substitute for metal components, finding use in structural, powertrain, exterior, interior, electronic, and electrical components. With the increasing production volume of automobiles to meet customer demands, particularly in countries like China, India, Japan, and South Korea, the demand for acrylonitrile is set to rise. Manufacturing processes involve acrylonitrile polymerization, catalyst optimization, and mechanical property analysis to produce high-quality acrylonitrile polymers.

Acrylonitrile monomer purification and adiponitrile synthesis are crucial steps in the production process. Recycling methods and wastewater treatment are essential for sustainable manufacturing. Acrylonitrile fibers, such as polyacrylonitrile, exhibit excellent UV resistance properties, making them suitable for outdoor applications. Carbon fiber production from acrylonitrile is another significant application, offering enhanced mechanical properties and lightweight solutions. Quality control measures, solvent resistance, and transportation regulations are essential considerations in the market. Acrylonitrile derivatives, including nitrile rubber and acrylamide, expand its application scope. The industry anticipates a growth of around 5% in the coming years, driven by the increasing demand for acrylonitrile in various end-use industries.

An example of the market's impact can be seen in the automotive sector, where the use of acrylonitrile-based materials has led to a 15% reduction in vehicle weight, resulting in improved fuel efficiency and reduced emissions.

Market Dynamics

Our researchers analyzed the data with 2024 as the base year, along with the key drivers, trends, and challenges. A holistic analysis of drivers will help companies refine their marketing strategies to gain a competitive advantage.

The market is a significant player in the chemical industry, with applications spanning various sectors including textiles, automotive, and construction. The production of acrylonitrile emulsion polymerization and high-performance acrylonitrile fibers involves acrylonitrile copolymerization with styrene and butadiene. The acrylonitrile purification methods for polymer synthesis are crucial to ensure the desired product quality. The impact of temperature on acrylonitrile polymerization kinetics is a critical factor in optimizing the production process. In the context of acrylonitrile-based carbon fiber manufacturing techniques, temperature control is particularly important to achieve the desired fiber properties. Quality control measures are essential in acrylonitrile fiber production to ensure consistency and meet industry standards. Wastewater treatment techniques for acrylonitrile industries are necessary to minimize environmental impact and comply with regulatory requirements. Acrylonitrile monomer storage and handling safety procedures are crucial to prevent accidents and ensure worker safety. The environmental impact assessment of acrylonitrile manufacturing is a continuous process to minimize the carbon footprint and reduce waste. Acrylonitrile derivatives have numerous applications in various industries, including the production of plastics, elastomers, and fibers. The reaction kinetics study of acrylonitrile polymerization reaction is essential to optimize the process and improve catalyst efficiency. Catalyst optimization and process optimization strategies are crucial for enhanced acrylonitrile polymerization. The molecular weight distribution control of acrylonitrile polymers is crucial to achieve the desired properties, such as tensile strength and elongation properties. Thermal stability and degradation analysis of acrylonitrile polymers are essential to ensure product durability and chemical resistance. Advanced techniques in acrylonitrile polymer characterization enable a better understanding of the material properties and applications. Acrylonitrile copolymers exhibit unique properties, making them suitable for various applications, such as automotive components, electrical insulation, and packaging materials. The study of acrylonitrile copolymer properties and applications is ongoing to discover new uses and optimize production processes.

What are the key market drivers leading to the rise in the adoption of Acrylonitrile Industry?

  • The high demand for acrylonitrile in the Asia-Pacific region serves as the primary driver for the market's growth. 
  • Acrylonitrile is a significant chemical compound with widespread application in various industries, particularly in the production of acrylic fibers and acrylonitrile butadiene styrene (ABS). The Asia Pacific (APAC) region is a major consumer and producer of acrylonitrile, driven by the extensive manufacturing base and favorable market conditions. The region's easy access to raw materials such as propylene and ammonia, inexpensive labor, and supportive government policies for foreign direct investment (FDI) and special economic zones (SEZs) contribute to its dominance. The construction, automotive, and consumer goods industries' robust growth in countries like China, India, Japan, Singapore, and South Korea is fueling the regional market's expansion.
  • For instance, the Chinese market is projected to grow at a significant rate due to the increasing demand for ABS in the automotive industry. Moreover, the market is expected to grow by approximately 5% annually over the next five years, underscoring its continued importance in the chemical industry.

What are the market trends shaping the Acrylonitrile Industry?

  • Carbon fiber production is set to increase, representing the emerging market trend. (Or) The market trend is characterized by an increase in carbon fiber production.
  • The demand for acrylonitrile is significantly driven by the increasing usage of carbon fiber, particularly in the aerospace and defense, and sports and leisure industries. Carbon fiber, primarily made from acrylonitrile's polyacrylonitrile (PAN), is a high-performance material that offers strength, lightweight, and durability. Approximately 90% of carbon fibers are manufactured using PAN, making acrylonitrile a crucial feedstock in this sector. The aerospace industry is a significant consumer of carbon fiber, as it is used to manufacture aircraft and spacecraft structures and components. In the sports and leisure sector, carbon fiber is extensively used in the production of sporting goods, such as bicycles, golf clubs, and tennis rackets.
  • The adoption of carbon fiber in these industries has surged due to its superior properties, leading to a robust demand for acrylonitrile. According to recent studies, the carbon fiber market is projected to grow by 12% in the next five years. This growth is attributed to the increasing demand from the aerospace and defense and sports and leisure industries, which will, in turn, fuel the demand for acrylonitrile. With its unique properties and wide-ranging applications, acrylonitrile is poised to continue its strong market performance in the coming years.

What challenges does the Acrylonitrile Industry face during its growth?

  • The expansion of the acrylonitrile industry is constrained by stringent regulations and health hazards associated with this chemical. 
  • Acrylonitrile, a crucial raw material in the production of acrylic fibers, ABS, SAN, acrylamide, adiponitrile, and nitrile butadiene rubber (NBR), is recognized as a hazardous compound by the European Chemicals Agency (ECHA). Classified as a toxic chemical for humans, acrylonitrile poses significant risks to workers and the environment. Industrial processes, transportation, and the application of acrylonitrile contribute to its release into the air and wastewater. Workers are at high risk of acrylonitrile exposure in their workplaces. The European Occupational Exposure Limit (OEL) for acrylonitrile is set at 2-3 parts per million (PPM), while the National Institute for Occupational Safety and Health (NIOSH) has revised the immediate danger to life or health (IDLH) value to 85 ppm.
  • These stringent safety measures highlight the potential hazards associated with acrylonitrile. The market is expected to experience robust growth, with industry analysts projecting a significant increase of around 6% annually. For instance, the demand for acrylonitrile in the production of automotive parts, such as engine components and interior materials, is on the rise due to the increasing production of electric vehicles. This trend is expected to drive market growth in the coming years.

Exclusive Customer Landscape

The acrylonitrile market forecasting report includes the adoption lifecycle of the market, covering from the innovator's stage to the laggard's stage. It focuses on adoption rates in different regions based on penetration. Furthermore, the acrylonitrile market report also includes key purchase criteria and drivers of price sensitivity to help companies evaluate and develop their market growth analysis strategies.
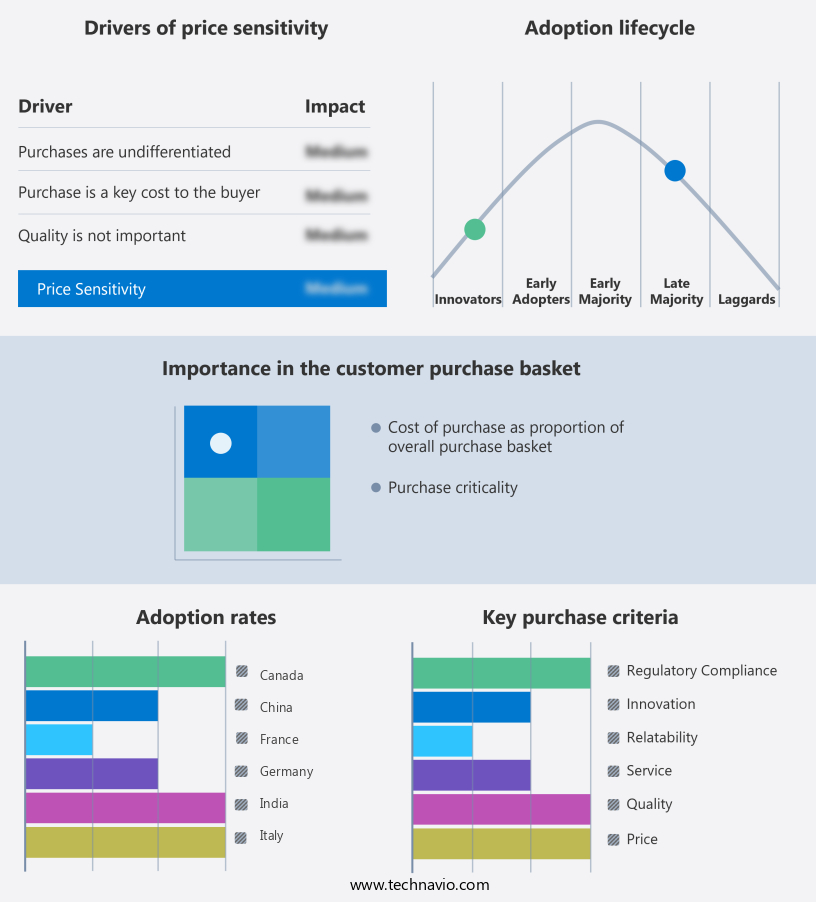
Acrylonitrile Market Share by Geography

 Customer Landscape

Key Companies & Market Insights

Companies are implementing various strategies, such as strategic alliances, acrylonitrile market forecast, partnerships, mergers and acquisitions, geographical expansion, and product/service launches, to enhance their presence in the industry.

AnQore - This company specializes in the production and supply of acrylonitrile, a versatile chemical essential in various industries. 

The industry research and growth report includes detailed analyses of the competitive landscape of the market and information about key companies, including:

  • AnQore
  • Asahi Kasei Corp.
  • Ascend Performance Materials
  • China National Petroleum Corp.
  • China Petrochemical Development Corp.
  • Cornerstone Chemical Co.
  • Formosa Plastics Corp.
  • INEOS Group Holdings S.A.
  • LG Chem Ltd.
  • Mitsubishi Chemical Group Corp.
  • PJSC LUKOIL
  • Polymir
  • S.S.B.POLYMERS
  • Sinopec Shanghai Petrochemical Co. Ltd.
  • SOCAR Turkiye Enerji A.S.
  • Sumitomo Chemical Co. Ltd.
  • Taekwang Industrial Co. Ltd.
  • Thermo Fisher Scientific Inc.
  • Tokyo Chemical Industry Co. Ltd.

Qualitative and quantitative analysis of companies has been conducted to help clients understand the wider business environment as well as the strengths and weaknesses of key industry players. Data is qualitatively analyzed to categorize companies as pure play, category-focused, industry-focused, and diversified; it is quantitatively analyzed to categorize companies as dominant, leading, strong, tentative, and weak.

Recent Development and News in Acrylonitrile Market

  • In January 2024, INEOS Styrolution, the world's leading styrenics supplier, announced the expansion of its acrylonitrile butadiene styrene (ABS) production capacity at its Marl, Germany site. This € 150 million investment aimed to enhance the company's market position and meet growing demand (INEOS Styrolution press release).
  • In March 2024, BASF and SABIC, two global chemical giants, signed a memorandum of understanding to explore potential collaborations in the production and marketing of acrylonitrile and its derivatives. This strategic partnership aimed to leverage their combined expertise and resources to create value for customers (BASF press release).
  • In May 2024, Covestro, a leading global materials company, received approval from the Chinese Ministry of Ecology and Environment for the construction of a new acrylonitrile butadiene styrene (ABS) production plant in Ningbo, China. This € 350 million investment marked Covestro's entry into the Chinese ABS market and underscored its commitment to the Asian market (Covestro press release).
  • In April 2025, LG Chem, a leading global chemical company, announced the successful commercialization of its new acrylonitrile-butadiene-styrene (ABS) resin, which offers improved heat resistance and durability. This technological advancement expanded LG Chem's product portfolio and positioned the company as a key player in the high-performance ABS market (LG Chem press release).

Research Analyst Overview

  • The market for acrylonitrile continues to evolve, driven by its versatile chemical composition and wide-ranging applications across various sectors. Acrylonitrile-styrene copolymers find extensive use in automotive and electrical industries due to their desirable rheological properties, while nitrile rubber grades are essential in the production of seals and gaskets. The hydrolysis reaction of acrylonitrile-vinyl acetate copolymers yields materials with unique product characterization, suitable for adhesives and coatings. Reaction temperature plays a crucial role in the monomer feed rate during polymerization, influencing the modulus of elasticity and tensile strength of the final product. Pressure control in the polymerization reactor is essential for optimizing process efficiency and ensuring consistent fiber properties, such as elongation at break and fiber morphology.
  • Environmental impact is a growing concern, leading to increased focus on process simulation and risk assessment to minimize thermal degradation and improve process control strategy. Crystal structure analysis and material selection are integral parts of the extrusion process, while cost analysis and polymerization inhibitors help maintain profitability. For instance, a leading automotive manufacturer reported a 15% increase in sales due to the adoption of high-performance acrylonitrile-based materials in their latest vehicle models. Industry growth is expected to reach 5% annually, driven by advancements in technology and expanding applications.

Dive into Technavio's robust research methodology, blending expert interviews, extensive data synthesis, and validated models for unparalleled Acrylonitrile Market insights. See full methodology.

Market Scope

Report Coverage

Details

Page number

218

Base year

2024

Historic period

2019-2023

Forecast period

2025-2029

Growth momentum & CAGR

Accelerate at a CAGR of 3.2%

Market growth 2025-2029

USD 2042.7 million

Market structure

Fragmented

YoY growth 2024-2025(%)

3.1

Key countries

China, US, Japan, South Korea, Canada, India, Germany, UK, France, and Italy

Competitive landscape

Leading Companies, Market Positioning of Companies, Competitive Strategies, and Industry Risks

Request Free Sample

What are the Key Data Covered in this Acrylonitrile Market Research and Growth Report?

  • CAGR of the Acrylonitrile industry during the forecast period
  • Detailed information on factors that will drive the growth and forecasting between 2025 and 2029
  • Precise estimation of the size of the market and its contribution of the industry in focus to the parent market
  • Accurate predictions about upcoming growth and trends and changes in consumer behaviour
  • Growth of the market across APAC, North America, Europe, Middle East and Africa, and South America
  • Thorough analysis of the market's competitive landscape and detailed information about companies
  • Comprehensive analysis of factors that will challenge the acrylonitrile market growth of industry companies

We can help! Our analysts can customize this acrylonitrile market research report to meet your requirements.

Get in touch

1 Executive Summary

  • 1.1 Market overview
    • Executive Summary - Chart on Market Overview
    • Executive Summary - Data Table on Market Overview
    • Executive Summary - Chart on Global Market Characteristics
    • Executive Summary - Chart on Market by Geography
    • Executive Summary - Chart on Market Segmentation by Application
    • Executive Summary - Chart on Market Segmentation by End-user
    • Executive Summary - Chart on Incremental Growth
    • Executive Summary - Data Table on Incremental Growth
    • Executive Summary - Chart on Company Market Positioning

2 Technavio Analysis

  • 2.1 Analysis of price sensitivity, lifecycle, customer purchase basket, adoption rates, and purchase criteria
    • Analysis of price sensitivity, lifecycle, customer purchase basket, adoption rates, and purchase criteria
  • 2.2 Criticality of inputs and Factors of differentiation
    • Overview on criticality of inputs and factors of differentiation
  • 2.3 Factors of disruption
    • Overview on factors of disruption
  • 2.4 Impact of drivers and challenges
    • Impact of drivers and challenges in 2024 and 2029

3 Market Landscape

  • 3.1 Market ecosystem
    • Parent Market
    • Data Table on - Parent Market
  • 3.2 Market characteristics
    • Market characteristics analysis
  • 3.3 Value chain analysis
    • Value chain analysis

4 Market Sizing

  • 4.1 Market definition
    • Offerings of companies included in the market definition
  • 4.2 Market segment analysis
    • Market segments
  • 4.3 Market size 2024
    • 4.4 Market outlook: Forecast for 2024-2029
      • Chart on Global - Market size and forecast 2024-2029 ($ million)
      • Data Table on Global - Market size and forecast 2024-2029 ($ million)
      • Chart on Global Market: Year-over-year growth 2024-2029 (%)
      • Data Table on Global Market: Year-over-year growth 2024-2029 (%)

    5 Historic Market Size

    • 5.1 Global Acrylonitrile Market 2019 - 2023
      • Historic Market Size - Data Table on Global Acrylonitrile Market 2019 - 2023 ($ million)
    • 5.2 Application segment analysis 2019 - 2023
      • Historic Market Size - Application Segment 2019 - 2023 ($ million)
    • 5.3 End-user segment analysis 2019 - 2023
      • Historic Market Size - End-user Segment 2019 - 2023 ($ million)
    • 5.4 Geography segment analysis 2019 - 2023
      • Historic Market Size - Geography Segment 2019 - 2023 ($ million)
    • 5.5 Country segment analysis 2019 - 2023
      • Historic Market Size - Country Segment 2019 - 2023 ($ million)

    6 Qualitative Analysis

    • 6.1 Impact of AI on the Global Acrylonitrile Market

      7 Five Forces Analysis

      • 7.1 Five forces summary
        • Five forces analysis - Comparison between 2024 and 2029
      • 7.2 Bargaining power of buyers
        • Bargaining power of buyers - Impact of key factors 2024 and 2029
      • 7.3 Bargaining power of suppliers
        • Bargaining power of suppliers - Impact of key factors in 2024 and 2029
      • 7.4 Threat of new entrants
        • Threat of new entrants - Impact of key factors in 2024 and 2029
      • 7.5 Threat of substitutes
        • Threat of substitutes - Impact of key factors in 2024 and 2029
      • 7.6 Threat of rivalry
        • Threat of rivalry - Impact of key factors in 2024 and 2029
      • 7.7 Market condition
        • Chart on Market condition - Five forces 2024 and 2029

      8 Market Segmentation by Application

      • 8.1 Market segments
        • Chart on Application - Market share (2024-2029) (%)
        • Data Table on Application - Market share (2024-2029) (%)
      • 8.2 Comparison by Application
        • Chart on Comparison by Application
        • Data Table on Comparison by Application
      • 8.3 ABS and SAN - Market size and forecast (2024-2029)
        • Chart on ABS and SAN - Market size and forecast (2024-2029) ($ million)
        • Data Table on ABS and SAN - Market size and forecast (2024-2029) ($ million)
        • Chart on ABS and SAN - Year-over-year growth (2024-2029) (%)
        • Data Table on ABS and SAN - Year-over-year growth (2024-2029) (%)
      • 8.4 Acrylic fibers - Market size and forecast (2024-2029)
        • Chart on Acrylic fibers - Market size and forecast (2024-2029) ($ million)
        • Data Table on Acrylic fibers - Market size and forecast (2024-2029) ($ million)
        • Chart on Acrylic fibers - Year-over-year growth (2024-2029) (%)
        • Data Table on Acrylic fibers - Year-over-year growth (2024-2029) (%)
      • 8.5 Polyacrylamide - Market size and forecast (2024-2029)
        • Chart on Polyacrylamide - Market size and forecast (2024-2029) ($ million)
        • Data Table on Polyacrylamide - Market size and forecast (2024-2029) ($ million)
        • Chart on Polyacrylamide - Year-over-year growth (2024-2029) (%)
        • Data Table on Polyacrylamide - Year-over-year growth (2024-2029) (%)
      • 8.6 Nitrile butadiene rubber - Market size and forecast (2024-2029)
        • Chart on Nitrile butadiene rubber - Market size and forecast (2024-2029) ($ million)
        • Data Table on Nitrile butadiene rubber - Market size and forecast (2024-2029) ($ million)
        • Chart on Nitrile butadiene rubber - Year-over-year growth (2024-2029) (%)
        • Data Table on Nitrile butadiene rubber - Year-over-year growth (2024-2029) (%)
      • 8.7 Others - Market size and forecast (2024-2029)
        • Chart on Others - Market size and forecast (2024-2029) ($ million)
        • Data Table on Others - Market size and forecast (2024-2029) ($ million)
        • Chart on Others - Year-over-year growth (2024-2029) (%)
        • Data Table on Others - Year-over-year growth (2024-2029) (%)
      • 8.8 Market opportunity by Application
        • Market opportunity by Application ($ million)
        • Data Table on Market opportunity by Application ($ million)

      9 Market Segmentation by End-user

      • 9.1 Market segments
        • Chart on End-user - Market share (2024-2029) (%)
        • Data Table on End-user - Market share (2024-2029) (%)
      • 9.2 Comparison by End-user
        • Chart on Comparison by End-user
        • Data Table on Comparison by End-user
      • 9.3 Electrical and electronics - Market size and forecast (2024-2029)
        • Chart on Electrical and electronics - Market size and forecast (2024-2029) ($ million)
        • Data Table on Electrical and electronics - Market size and forecast (2024-2029) ($ million)
        • Chart on Electrical and electronics - Year-over-year growth (2024-2029) (%)
        • Data Table on Electrical and electronics - Year-over-year growth (2024-2029) (%)
      • 9.4 Automotive - Market size and forecast (2024-2029)
        • Chart on Automotive - Market size and forecast (2024-2029) ($ million)
        • Data Table on Automotive - Market size and forecast (2024-2029) ($ million)
        • Chart on Automotive - Year-over-year growth (2024-2029) (%)
        • Data Table on Automotive - Year-over-year growth (2024-2029) (%)
      • 9.5 Construction - Market size and forecast (2024-2029)
        • Chart on Construction - Market size and forecast (2024-2029) ($ million)
        • Data Table on Construction - Market size and forecast (2024-2029) ($ million)
        • Chart on Construction - Year-over-year growth (2024-2029) (%)
        • Data Table on Construction - Year-over-year growth (2024-2029) (%)
      • 9.6 Packaging - Market size and forecast (2024-2029)
        • Chart on Packaging - Market size and forecast (2024-2029) ($ million)
        • Data Table on Packaging - Market size and forecast (2024-2029) ($ million)
        • Chart on Packaging - Year-over-year growth (2024-2029) (%)
        • Data Table on Packaging - Year-over-year growth (2024-2029) (%)
      • 9.7 Others - Market size and forecast (2024-2029)
        • Chart on Others - Market size and forecast (2024-2029) ($ million)
        • Data Table on Others - Market size and forecast (2024-2029) ($ million)
        • Chart on Others - Year-over-year growth (2024-2029) (%)
        • Data Table on Others - Year-over-year growth (2024-2029) (%)
      • 9.8 Market opportunity by End-user
        • Market opportunity by End-user ($ million)
        • Data Table on Market opportunity by End-user ($ million)

      10 Market Segmentation by Process Technology

      • 10.1 Market segments
        • Chart on Process Technology - Market share (2024-2029) (%)
        • Data Table on Process Technology - Market share (2024-2029) (%)
      • 10.2 Comparison by Process Technology
        • Chart on Comparison by Process Technology
        • Data Table on Comparison by Process Technology
      • 10.3 Ammoxidation Process - Market size and forecast (2024-2029)
        • Chart on Ammoxidation Process - Market size and forecast (2024-2029) ($ million)
        • Data Table on Ammoxidation Process - Market size and forecast (2024-2029) ($ million)
        • Chart on Ammoxidation Process - Year-over-year growth (2024-2029) (%)
        • Data Table on Ammoxidation Process - Year-over-year growth (2024-2029) (%)
      • 10.4 Others - Market size and forecast (2024-2029)
        • Chart on Others - Market size and forecast (2024-2029) ($ million)
        • Data Table on Others - Market size and forecast (2024-2029) ($ million)
        • Chart on Others - Year-over-year growth (2024-2029) (%)
        • Data Table on Others - Year-over-year growth (2024-2029) (%)
      • 10.5 Market opportunity by Process Technology
        • Market opportunity by Process Technology ($ million)
        • Data Table on Market opportunity by Process Technology ($ million)

      11 Customer Landscape

      • 11.1 Customer landscape overview
        • Analysis of price sensitivity, lifecycle, customer purchase basket, adoption rates, and purchase criteria

      12 Geographic Landscape

      • 12.1 Geographic segmentation
        • Chart on Market share by geography 2024-2029 (%)
        • Data Table on Market share by geography 2024-2029 (%)
      • 12.2 Geographic comparison
        • Chart on Geographic comparison
        • Data Table on Geographic comparison
      • 12.3 APAC - Market size and forecast 2024-2029
        • Chart on APAC - Market size and forecast 2024-2029 ($ million)
        • Data Table on APAC - Market size and forecast 2024-2029 ($ million)
        • Chart on APAC - Year-over-year growth 2024-2029 (%)
        • Data Table on APAC - Year-over-year growth 2024-2029 (%)
      • 12.4 North America - Market size and forecast 2024-2029
        • Chart on North America - Market size and forecast 2024-2029 ($ million)
        • Data Table on North America - Market size and forecast 2024-2029 ($ million)
        • Chart on North America - Year-over-year growth 2024-2029 (%)
        • Data Table on North America - Year-over-year growth 2024-2029 (%)
      • 12.5 Europe - Market size and forecast 2024-2029
        • Chart on Europe - Market size and forecast 2024-2029 ($ million)
        • Data Table on Europe - Market size and forecast 2024-2029 ($ million)
        • Chart on Europe - Year-over-year growth 2024-2029 (%)
        • Data Table on Europe - Year-over-year growth 2024-2029 (%)
      • 12.6 Middle East and Africa - Market size and forecast 2024-2029
        • Chart on Middle East and Africa - Market size and forecast 2024-2029 ($ million)
        • Data Table on Middle East and Africa - Market size and forecast 2024-2029 ($ million)
        • Chart on Middle East and Africa - Year-over-year growth 2024-2029 (%)
        • Data Table on Middle East and Africa - Year-over-year growth 2024-2029 (%)
      • 12.7 South America - Market size and forecast 2024-2029
        • Chart on South America - Market size and forecast 2024-2029 ($ million)
        • Data Table on South America - Market size and forecast 2024-2029 ($ million)
        • Chart on South America - Year-over-year growth 2024-2029 (%)
        • Data Table on South America - Year-over-year growth 2024-2029 (%)
      • 12.8 China - Market size and forecast 2024-2029
        • Chart on China - Market size and forecast 2024-2029 ($ million)
        • Data Table on China - Market size and forecast 2024-2029 ($ million)
        • Chart on China - Year-over-year growth 2024-2029 (%)
        • Data Table on China - Year-over-year growth 2024-2029 (%)
      • 12.9 US - Market size and forecast 2024-2029
        • Chart on US - Market size and forecast 2024-2029 ($ million)
        • Data Table on US - Market size and forecast 2024-2029 ($ million)
        • Chart on US - Year-over-year growth 2024-2029 (%)
        • Data Table on US - Year-over-year growth 2024-2029 (%)
      • 12.10 Japan - Market size and forecast 2024-2029
        • Chart on Japan - Market size and forecast 2024-2029 ($ million)
        • Data Table on Japan - Market size and forecast 2024-2029 ($ million)
        • Chart on Japan - Year-over-year growth 2024-2029 (%)
        • Data Table on Japan - Year-over-year growth 2024-2029 (%)
      • 12.11 South Korea - Market size and forecast 2024-2029
        • Chart on South Korea - Market size and forecast 2024-2029 ($ million)
        • Data Table on South Korea - Market size and forecast 2024-2029 ($ million)
        • Chart on South Korea - Year-over-year growth 2024-2029 (%)
        • Data Table on South Korea - Year-over-year growth 2024-2029 (%)
      • 12.12 Canada - Market size and forecast 2024-2029
        • Chart on Canada - Market size and forecast 2024-2029 ($ million)
        • Data Table on Canada - Market size and forecast 2024-2029 ($ million)
        • Chart on Canada - Year-over-year growth 2024-2029 (%)
        • Data Table on Canada - Year-over-year growth 2024-2029 (%)
      • 12.13 India - Market size and forecast 2024-2029
        • Chart on India - Market size and forecast 2024-2029 ($ million)
        • Data Table on India - Market size and forecast 2024-2029 ($ million)
        • Chart on India - Year-over-year growth 2024-2029 (%)
        • Data Table on India - Year-over-year growth 2024-2029 (%)
      • 12.14 Germany - Market size and forecast 2024-2029
        • Chart on Germany - Market size and forecast 2024-2029 ($ million)
        • Data Table on Germany - Market size and forecast 2024-2029 ($ million)
        • Chart on Germany - Year-over-year growth 2024-2029 (%)
        • Data Table on Germany - Year-over-year growth 2024-2029 (%)
      • 12.15 UK - Market size and forecast 2024-2029
        • Chart on UK - Market size and forecast 2024-2029 ($ million)
        • Data Table on UK - Market size and forecast 2024-2029 ($ million)
        • Chart on UK - Year-over-year growth 2024-2029 (%)
        • Data Table on UK - Year-over-year growth 2024-2029 (%)
      • 12.16 France - Market size and forecast 2024-2029
        • Chart on France - Market size and forecast 2024-2029 ($ million)
        • Data Table on France - Market size and forecast 2024-2029 ($ million)
        • Chart on France - Year-over-year growth 2024-2029 (%)
        • Data Table on France - Year-over-year growth 2024-2029 (%)
      • 12.17 Italy - Market size and forecast 2024-2029
        • Chart on Italy - Market size and forecast 2024-2029 ($ million)
        • Data Table on Italy - Market size and forecast 2024-2029 ($ million)
        • Chart on Italy - Year-over-year growth 2024-2029 (%)
        • Data Table on Italy - Year-over-year growth 2024-2029 (%)
      • 12.18 Market opportunity by geography
        • Market opportunity by geography ($ million)
        • Data Tables on Market opportunity by geography ($ million)
      • 12.19 Rest of World (ROW) - Market size and forecast (2024-2029)
        • Chart on Rest of World (ROW) - Market size and forecast (2024-2029) ($ million)
        • Data Table on Rest of World (ROW) - Market size and forecast (2024-2029) ($ million)
        • Chart on Rest of World (ROW) - Year-over-year growth (2024-2029) (%)
        • Data Table on Rest of World (ROW) - Year-over-year growth (2024-2029) (%)

      13 Drivers, Challenges, and Opportunity/Restraints

      • 13.1 Market drivers
        • 13.2 Market challenges
          • 13.3 Impact of drivers and challenges
            • Impact of drivers and challenges in 2024 and 2029
          • 13.4 Market opportunities/restraints

            14 Competitive Landscape

            • 14.1 Overview
              • 14.2 Competitive Landscape
                • Overview on criticality of inputs and factors of differentiation
              • 14.3 Landscape disruption
                • Overview on factors of disruption
              • 14.4 Industry risks
                • Impact of key risks on business

              15 Competitive Analysis

              • 15.1 Companies profiled
                • Companies covered
              • 15.2 Company ranking index
                • Company ranking index
              • 15.3 Market positioning of companies
                • Matrix on companies position and classification
              • 15.4 AnQore
                • AnQore - Overview
                • AnQore - Product / Service
                • AnQore - Key offerings
                • SWOT
              • 15.5 Asahi Kasei Corp.
                • Asahi Kasei Corp. - Overview
                • Asahi Kasei Corp. - Business segments
                • Asahi Kasei Corp. - Key news
                • Asahi Kasei Corp. - Key offerings
                • Asahi Kasei Corp. - Segment focus
                • SWOT
              • 15.6 Ascend Performance Materials
                • Ascend Performance Materials - Overview
                • Ascend Performance Materials - Product / Service
                • Ascend Performance Materials - Key news
                • Ascend Performance Materials - Key offerings
                • SWOT
              • 15.7 China National Petroleum Corp.
                • China National Petroleum Corp. - Overview
                • China National Petroleum Corp. - Product / Service
                • China National Petroleum Corp. - Key offerings
                • SWOT
              • 15.8 China Petrochemical Development Corp.
                • China Petrochemical Development Corp. - Overview
                • China Petrochemical Development Corp. - Product / Service
                • China Petrochemical Development Corp. - Key offerings
                • SWOT
              • 15.9 Formosa Plastics Corp.
                • Formosa Plastics Corp. - Overview
                • Formosa Plastics Corp. - Product / Service
                • Formosa Plastics Corp. - Key offerings
                • SWOT
              • 15.10 INEOS Group Holdings S.A.
                • INEOS Group Holdings S.A. - Overview
                • INEOS Group Holdings S.A. - Product / Service
                • INEOS Group Holdings S.A. - Key news
                • INEOS Group Holdings S.A. - Key offerings
                • SWOT
              • 15.11 Mitsubishi Chemical Group Corp.
                • Mitsubishi Chemical Group Corp. - Overview
                • Mitsubishi Chemical Group Corp. - Business segments
                • Mitsubishi Chemical Group Corp. - Key news
                • Mitsubishi Chemical Group Corp. - Key offerings
                • Mitsubishi Chemical Group Corp. - Segment focus
                • SWOT
              • 15.12 PJSC LUKOIL
                • PJSC LUKOIL - Overview
                • PJSC LUKOIL - Product / Service
                • PJSC LUKOIL - Key offerings
                • SWOT
              • 15.13 S.S.B.POLYMERS
                • S.S.B.POLYMERS - Overview
                • S.S.B.POLYMERS - Product / Service
                • S.S.B.POLYMERS - Key offerings
                • SWOT
              • 15.14 SOCAR Turkiye Enerji A.S.
                • SOCAR Turkiye Enerji A.S. - Overview
                • SOCAR Turkiye Enerji A.S. - Product / Service
                • SOCAR Turkiye Enerji A.S. - Key offerings
                • SWOT
              • 15.15 Sumitomo Chemical Co. Ltd.
                • Sumitomo Chemical Co. Ltd. - Overview
                • Sumitomo Chemical Co. Ltd. - Business segments
                • Sumitomo Chemical Co. Ltd. - Key offerings
                • Sumitomo Chemical Co. Ltd. - Segment focus
                • SWOT
              • 15.16 Taekwang Industrial Co. Ltd.
                • Taekwang Industrial Co. Ltd. - Overview
                • Taekwang Industrial Co. Ltd. - Product / Service
                • Taekwang Industrial Co. Ltd. - Key offerings
                • SWOT
              • 15.17 Thermo Fisher Scientific Inc.
                • Thermo Fisher Scientific Inc. - Overview
                • Thermo Fisher Scientific Inc. - Business segments
                • Thermo Fisher Scientific Inc. - Key news
                • Thermo Fisher Scientific Inc. - Key offerings
                • Thermo Fisher Scientific Inc. - Segment focus
                • SWOT
              • 15.18 Tokyo Chemical Industry Co. Ltd.
                • Tokyo Chemical Industry Co. Ltd. - Overview
                • Tokyo Chemical Industry Co. Ltd. - Product / Service
                • Tokyo Chemical Industry Co. Ltd. - Key offerings
                • SWOT

              16 Appendix

              • 16.1 Scope of the report
                • 16.2 Inclusions and exclusions checklist
                  • Inclusions checklist
                  • Exclusions checklist
                • 16.3 Currency conversion rates for US$
                  • Currency conversion rates for US$
                • 16.4 Research methodology
                  • Research methodology
                • 16.5 Data procurement
                  • Information sources
                • 16.6 Data validation
                  • Data validation
                • 16.7 Validation techniques employed for market sizing
                  • Validation techniques employed for market sizing
                • 16.8 Data synthesis
                  • Data synthesis
                • 16.9 360 degree market analysis
                  • 360 degree market analysis
                • 16.10 List of abbreviations
                  • List of abbreviations

                Research Methodology

                Technavio presents a detailed picture of the market by way of study, synthesis, and summation of data from multiple sources. The analysts have presented the various facets of the market with a particular focus on identifying the key industry influencers. The data thus presented is comprehensive, reliable, and the result of extensive research, both primary and secondary.

                INFORMATION SOURCES

                Primary sources

                • Manufacturers and suppliers
                • Channel partners
                • Industry experts
                • Strategic decision makers

                Secondary sources

                • Industry journals and periodicals
                • Government data
                • Financial reports of key industry players
                • Historical data
                • Press releases

                DATA ANALYSIS

                Data Synthesis

                • Collation of data
                • Estimation of key figures
                • Analysis of derived insights

                Data Validation

                • Triangulation with data models
                • Reference against proprietary databases
                • Corroboration with industry experts

                REPORT WRITING

                Qualitative

                • Market drivers
                • Market challenges
                • Market trends
                • Five forces analysis

                Quantitative

                • Market size and forecast
                • Market segmentation
                • Geographical insights
                • Competitive landscape

                Interested in this report?

                Get your sample now to see our research methodology and insights!

                Download Now

                Frequently Asked Questions

                Acrylonitrile market growth will increase by $ 2042.7 mn during 2025-2029 .

                The Acrylonitrile market is expected to grow at a CAGR of 3.2% during 2025-2029 .

                Acrylonitrile market is segmented by Application( ABS and SAN, Acrylic fibers, Polyacrylamide, Nitrile butadiene rubber, Others) End-user( Electrical and electronics, Automotive, Construction, Packaging, Others)

                AnQore, Asahi Kasei Corp., Ascend Performance Materials, China National Petroleum Corp., China Petrochemical Development Corp., Cornerstone Chemical Co., Formosa Plastics Corp., INEOS Group Holdings S.A., LG Chem Ltd., Mitsubishi Chemical Group Corp., PJSC LUKOIL, Polymir, S.S.B.POLYMERS, Sinopec Shanghai Petrochemical Co. Ltd., SOCAR Turkiye Enerji A.S., Sumitomo Chemical Co. Ltd., Taekwang Industrial Co. Ltd., Thermo Fisher Scientific Inc., Tokyo Chemical Industry Co. Ltd. are a few of the key vendors in the Acrylonitrile market.

                APAC will register the highest growth rate of 67% among the other regions. Therefore, the Acrylonitrile market in APAC is expected to garner significant business opportunities for the vendors during the forecast period.

                China, US, Japan, South Korea, Canada, India, Germany, UK, France, Italy

                • High demand for acrylonitrile from APACAPAC is a leading consumer of acrylonitrile. The demand for acrylonitrile in the region is expected to increase during the forecast period due to the extensive manufacturing of acrylic fibers and acrylonitrile butadiene styrene (ABS).The region has a strong acrylonitrile manufacturing base is the driving factor this market.
                • owing to factors such as the easy availability of raw materials (propylene and ammonia) is the driving factor this market.
                • inexpensive labor is the driving factor this market.
                • and favorable government policies for foreign direct investment (FDI) is the driving factor this market.
                • along with the presence of special economic zones (SEZs).Rapid growth in the construction is the driving factor this market.
                • automotive is the driving factor this market.
                • and consumer goods industries in China is the driving factor this market.
                • India is the driving factor this market.
                • Japan is the driving factor this market.
                • Singapore is the driving factor this market.
                • and South Korea is propelling the growth of the regional acrylonitrile market. Acrylonitrile is extensively used to manufacture acrylic fibers. The acrylic fibers segment accounts for approximately 33%-37% of the acrylonitrile market in APAC.Most of the global apparel is the driving factor this market.
                • textile is the driving factor this market.
                • and automobile manufacturing units have shifted from developed countries is the driving factor this market.
                • such as the US is the driving factor this market.
                • Germany is the driving factor this market.
                • and the UK is the driving factor this market.
                • to developing countries is the driving factor this market.
                • such as China is the driving factor this market.
                • India is the driving factor this market.
                • and other APAC countries. Acrylic fibers are one of the leading materials used in the apparel and textile industry in the region is the driving factor this market.
                • owing to a large consumer base and abundance of raw materials.Acrylic fibers are preferred in the textile industry as they are lightweight is the driving factor this market.
                • soft is the driving factor this market.
                • and warm is the driving factor this market.
                • with a structure similar to that of wool. These fibers exhibit properties such as excellent thermal stability and resistance to mineral acids is the driving factor this market.
                • moths is the driving factor this market.
                • and commonly used bleaching agents. Moreover is the driving factor this market.
                • they exhibit superior wick ability and quick drying.The increasing demand for textiles in the region will drive the consumption of acrylic fibers during the forecast period. Growth in end-user industries will support the demand for acrylonitrile is the driving factor this market.
                • thus boosting the growth of the market in focus during the forecast period. is the driving factor this market.

                The Acrylonitrile market vendors should focus on grabbing business opportunities from the ABS and SAN segment as it accounted for the largest market share in the base year.