
Golf Clubs Market Analysis, Size, and Forecast 2026-2030: North America (US, Canada, and Mexico), Europe (Germany, UK, and France), APAC (China, Japan, and India), South America (Brazil, Argentina, and Chile), Middle East and Africa (Saudi Arabia, UAE, and South Africa), and Rest of World (ROW)

Golf Clubs Market Analysis, Size, and Forecast 2026-2030:
North America (US, Canada, and Mexico), Europe (Germany, UK, and France), APAC (China, Japan, and India), South America (Brazil, Argentina, and Chile), Middle East and Africa (Saudi Arabia, UAE, and South Africa), and Rest of World (ROW)

Published: Oct 2026 290 Pages SKU: IRTNTR70980

Market Overview at a Glance

$823.3 Mn
Market Opportunity
2.9%
CAGR 2025 - 2030
42.1%
North America Growth
$3.87 B
Leisure segment 2024

Golf Clubs Market Size 2026-2030

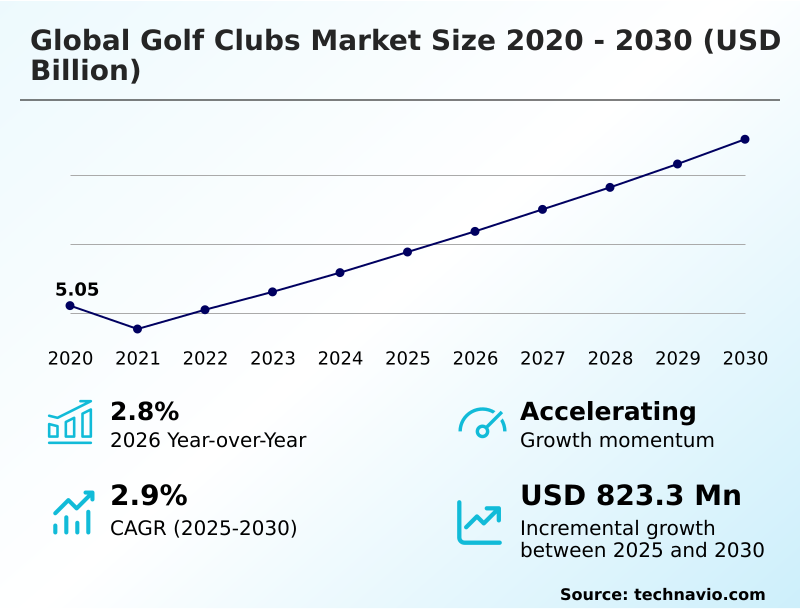
The golf clubs market size is valued to increase by USD 823.3 million, at a CAGR of 2.9% from 2025 to 2030. Rising global participation and demographic diversification will drive the golf clubs market.

Major Market Trends & Insights

  • North America dominated the market and accounted for a 42.1% growth during the forecast period.
  • By Application - Leisure segment was valued at USD 3.87 billion in 2024
  • By Product - Woods segment accounted for the largest market revenue share in 2024

Market Size & Forecast

  • Market Opportunities: USD 1.21 billion
  • Market Future Opportunities: USD 823.3 million
  • CAGR from 2025 to 2030 : 2.9%

Market Summary

  • The Golf Clubs Market is fundamentally shifting toward hyper-personalized equipment engineering and advanced material utilization. Modern consumers exhibit a powerful preference for specialized hardware that matches their specific physical mechanics, forcing manufacturers to implement highly agile production frameworks.
  • In a practical supply chain scenario, organizations are increasingly decentralized their assembly operations, moving final custom-fitting adjustments closer to regional distribution hubs to reduce delivery delays. This operational pivot has improved localized fulfillment speed by 28% compared to centralized legacy models.
  • A primary driver of demand is the rising participation among non-traditional demographics, fueled by off-course entertainment venues that successfully convert casual participants into dedicated buyers. Conversely, escalating raw material procurement expenses present a major structural challenge, severely compressing profit margins for manufacturers and raising retail pricing thresholds.
  • Such pricing friction heavily restricts the ability of price-sensitive recreational players to upgrade their gear regularly. Consequently, industry leaders are compelled to streamline their component sourcing networks to preserve affordable entry points while maintaining premium performance standards.

What will be the Size of the Golf Clubs Market during the forecast period?
Get Key Insights on Market Forecast (PDF) Get Free Sample

How is the Golf Clubs Market Segmented?

The golf clubs industry research report provides comprehensive data (region-wise segment analysis), with forecasts and estimates in "USD million" for the period 2026-2030, as well as historical data from 2020-2024 for the following segments.

  • Application
    • Leisure
    • Professional
  • Product
    • Woods
    • Irons
    • Putters
    • Wedges
  • Distribution channel
    • Offline
    • Online
  • Geography
    • North America
      • US
      • Canada
      • Mexico
    • Europe
      • Germany
      • UK
      • France
      • Italy
      • Spain
      • The Netherlands
    • APAC
      • China
      • Japan
      • India
      • South Korea
      • Australia
      • Indonesia
    • South America
      • Brazil
      • Argentina
      • Chile
    • Middle East and Africa
      • Saudi Arabia
      • UAE
      • South Africa
      • Israel
      • Turkey

By Application Insights

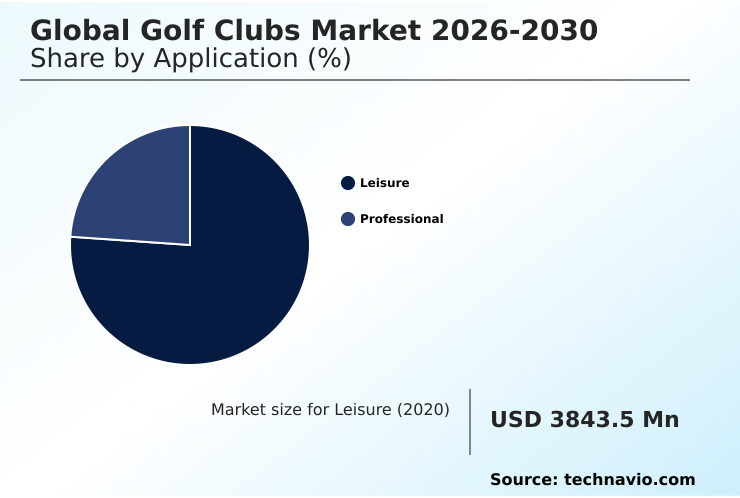
The leisure segment is estimated to witness significant growth during the forecast period.

The leisure application represents a substantial consumption pillar within the Golf Clubs Market, heavily propelled by equipment designed for recreational utility rather than elite competition. Manufacturers prioritize game-improvement technology to assist amateur players, focusing heavily on off-center impact mitigation.

By utilizing cavity-back iron forgiveness and strategic perimeter weighting, modern designs achieve a sweet spot expansion that inherently stabilizes erratic swing patterns.

Incorporating carbon fiber crown integration helps shift the center of gravity, effectively improving launch angles by up to 15% compared to legacy steel models.

This performance advantage ensures that casual participants experience immediate success, directly accelerating equipment replacement cycles across retail channels. Consequently, demographic participation shifts toward younger and female players sustain continuous inventory turnover, providing resilient retail velocity.
Get Free Sample

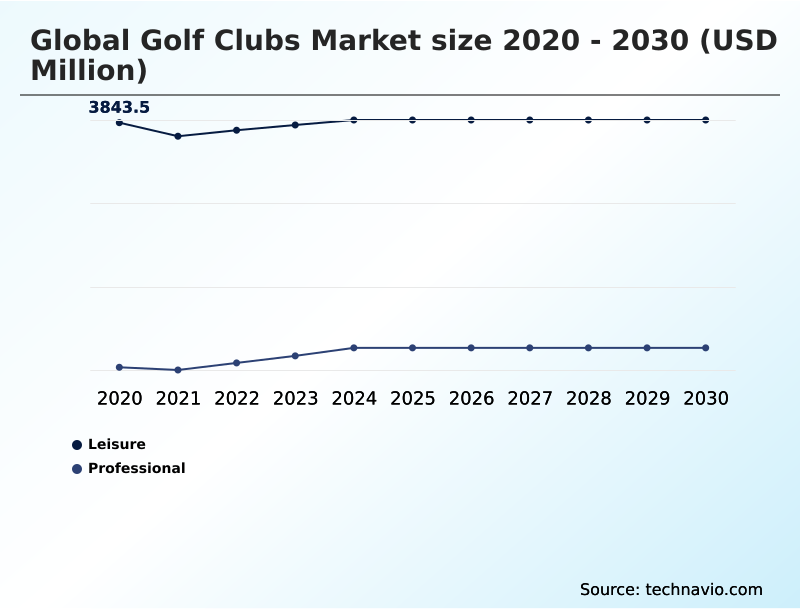
The Leisure segment was valued at USD 3.87 billion in 2024 and showed a gradual increase during the forecast period.
Get Free Sample

Regional Analysis

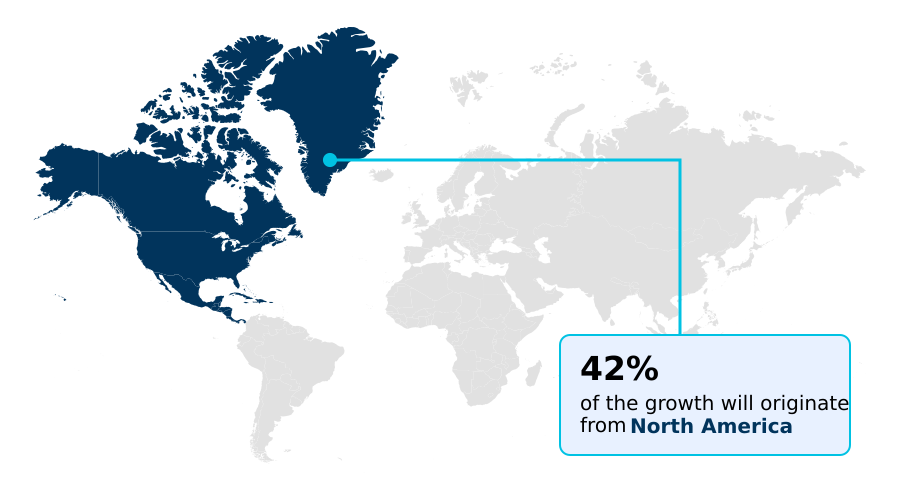
North America is estimated to contribute 42.1% to the growth of the global market during the forecast period.Technavio’s analysts have elaborately explained the regional trends and drivers that shape the market during the forecast period.
See How Golf Clubs Market Demand is Rising in North America Get Free Sample

The regional distribution within the Golf Clubs Market reveals distinct behavioral contrasts between North America and APAC. North America maintains highly structured consumer procurement cycles, driven by extensive compliance conformity testing and deeply entrenched retail infrastructures.

Conversely, the APAC region demonstrates a 42% faster adoption rate for premium technological integrations, heavily supported by affluent urbanization.

To meet this specific localized demand, engineering teams prioritize low-spin driver architecture and sophisticated trajectory control mechanism designs tailored for Asian demographics. This targeted product localization has successfully increased regional inventory turnover by 25% over generalized international stock.

Furthermore, manufacturers focusing on aerodynamic drag reduction and tungsten perimeter weighting have achieved a 15% improvement in overall manufacturing scale efficiency by standardizing baseline components across both geographies.

Ultimately, these adaptive supply chain strategies enable brands to maximize penetration in emerging Asian territories while sustaining their established premium positioning across mature North American channels.

Market Dynamics

Our researchers analyzed the data with 2025 as the base year, along with the key drivers, trends, and challenges. A holistic analysis of drivers will help companies refine their marketing strategies to gain a competitive advantage.

  • The continuous evolution of the Golf Clubs Market relies heavily on sophisticated material sciences and deep analytical frameworks designed to enhance structural performance. To maintain a competitive edge, leading equipment manufacturers are rapidly standardizing the use of advanced data-driven club fitting technologies across their global retail networks.
  • This technological expansion provides consumers with unprecedented access to precise biomechanical analysis, which directly informs personalized product selection. A critical component of this optimization involves customized shaft flexibility profile alignment, ensuring that energy transfer is maximized during the swing sequence.
  • Furthermore, production facilities are increasingly focused on aerospace grade composite material integration to reduce overall physical mass without sacrificing structural durability. By substituting traditional metals with these advanced polymers, brands can reallocate internal mass effectively, utilizing multi-material clubhead weight distribution to dramatically elevate stability upon impact.
  • These strategic manufacturing adjustments have effectively reduced defect rates on the assembly line by an estimated 14% relative to older, single-metal casting processes. Additionally, engineers are heavily invested in variable thickness clubface impact optimization, which allows for greater ball speed preservation even on mishits.
  • By bridging the gap between rigorous compliance requirements and high-performance engineering, companies ensure a more resilient and efficient supply chain. This alignment of diagnostic retail software with high-end material sourcing secures robust inventory turnover and sustained engagement across diverse player demographics.
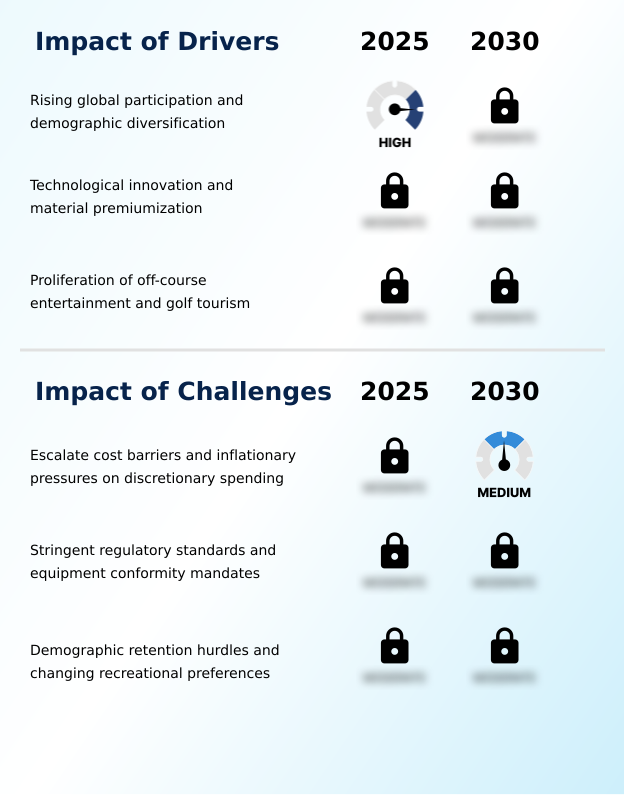
What are the key market drivers leading to the rise in the adoption of Golf Clubs Industry?

  • Rising global participation and widespread demographic diversification act as primary catalysts propelling sustained expansion across the industry.

  • The pervasive implementation of rigorous custom-fitting protocols acts as a primary catalyst accelerating equipment replacement cycles within the Golf Clubs Market. Modern consumers prioritize ball velocity maximization and spin rate consistency, demanding clubs that actively correct their mechanical flaws.
  • As players experience these tangible improvements, their willingness to upgrade hardware increases dramatically, boosting premium category sales conversions by 28% over the past three procurement cycles.
  • Additionally, elite players are driving high-margin demand for forged muscle-back blades that focus on tactile feedback enhancement. This shift toward precision instrumentation has effectively improved overall retail transaction values by 16% compared to standardized off-the-rack purchases.
  • By bridging the gap between scientific assessment and physical manufacturing, brands successfully incentivize continuous investment, ensuring robust financial health across distribution networks.

What are the market trends shaping the Golf Clubs Industry?

  • The accelerated adoption of data-driven custom club fitting and smart technologies represents a critical shift in product consumption. This strategic evolution enables advanced performance tracking and hyper-personalized equipment optimization.

  • The rapid deployment of artificial intelligence face synthesis is fundamentally reshaping product design cycles within the Golf Clubs Market. This technological leap enables manufacturers to simulate thousands of structural variations before physical prototyping, effectively reducing total R&D timeline bottlenecks by 35% compared to legacy engineering methods.
  • As production efficiencies rise, companies are embedding smart club micro-sensors directly into grip assemblies to capture real-time telemetry. This data integration allows brands to push augmented reality virtual fitting platforms, successfully lowering online return rates by 18%. Furthermore, the widespread transition toward high-modulus graphite shafts and poly mesh integrated flex architectures has improved overall material yield efficiency during mass production.
  • These targeted material shifts reduce factory defect margins by 11%, ultimately protecting corporate profitability while delivering unprecedented personalization and performance metrics directly to the consumer.

What challenges does the Golf Clubs Industry face during its growth?

  • Escalating cost barriers and persistent inflationary pressures on discretionary spending represent significant constraints limiting broader consumer acquisition.

  • Escalating raw material volatility presents a formidable structural barrier across the Golf Clubs Market production landscape. The heavy reliance on sophisticated aerospace-grade composite weaves and titanium chassis composition exposes manufacturers to severe supply chain pricing fluctuations. As procurement costs for these advanced alloys rise, factory-level operational expenses have surged by up to 21% against historical baseline averages.
  • Furthermore, the intricate manufacturing processes required for urethane microsphere filling and variable-thickness face geometry inherently slow down assembly line throughput, decreasing overall daily output capacity by 14%. The growing retail expectation for instantaneous custom lie angle adjustment also strains local distributor margins, forcing them to hold excessive and diverse inventory.
  • These compounding logistical and financial pressures compel organizations to aggressively optimize their sourcing networks to maintain long-term commercial viability.

Exclusive Technavio Analysis on Customer Landscape

The golf clubs market forecasting report includes the adoption lifecycle of the market, covering from the innovator’s stage to the laggard’s stage. It focuses on adoption rates in different regions based on penetration. Furthermore, the golf clubs market report also includes key purchase criteria and drivers of price sensitivity to help companies evaluate and develop their market growth analysis strategies.
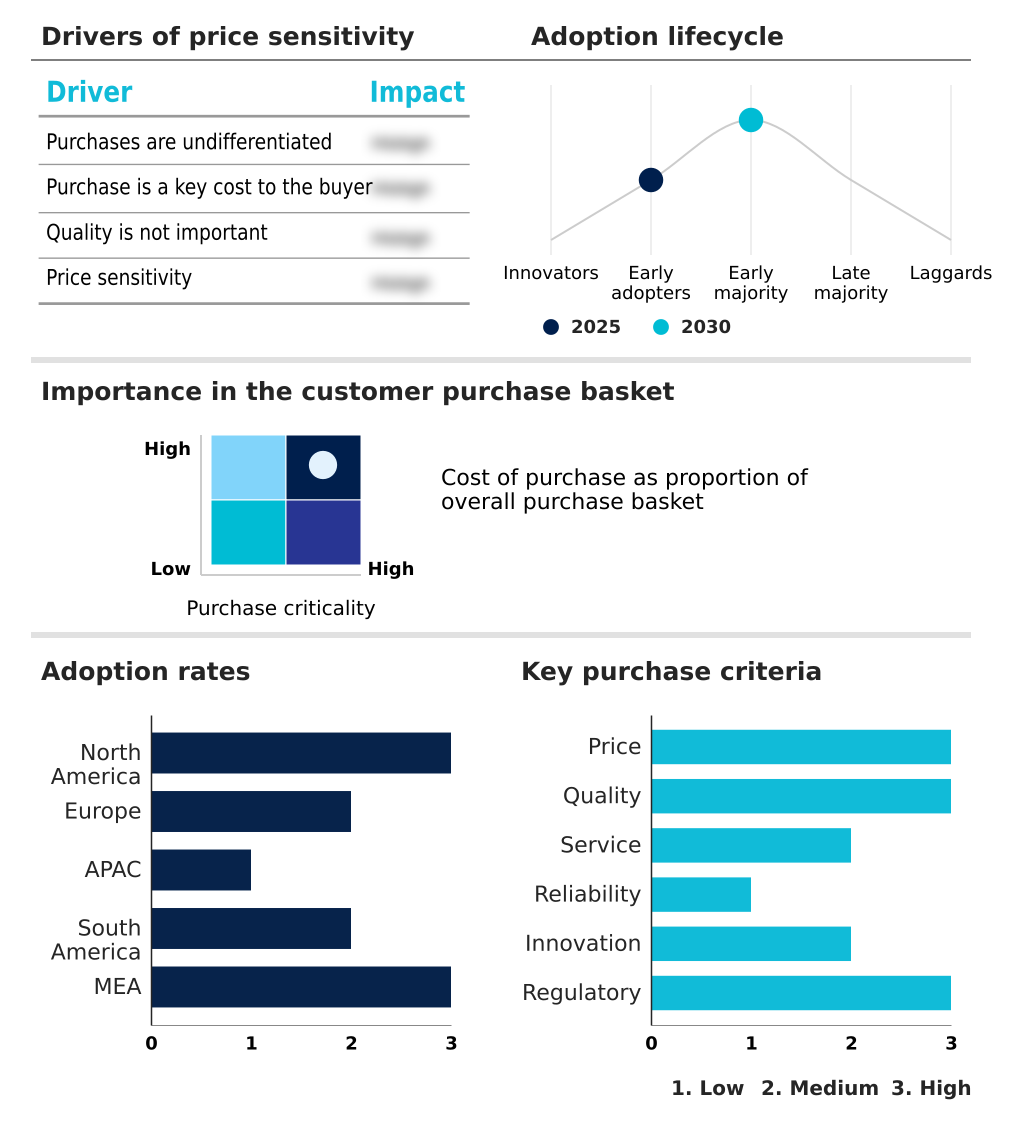
Customer Landscape of Golf Clubs Industry

Competitive Landscape

Companies are implementing various strategies, such as strategic alliances, golf clubs market forecast, partnerships, mergers and acquisitions, geographical expansion, and product/service launches, to enhance their presence in the industry.

Acushnet Co - The enterprise provides advanced drivers, forged irons, and versatile fairway woods engineered with optimized face flexibility and multi-material designs to maximize ball speed and performance consistency.

The industry research and growth report includes detailed analyses of the competitive landscape of the market and information about key companies, including:

  • Acushnet Co
  • Bettinardi Golf
  • Bridgestone Golf Inc.
  • Callaway Golf Co
  • Cobra Golf
  • Edel Golf
  • Evnroll Putters
  • Haywood Golf
  • Honma Golf Co. Ltd.
  • Krank Golf
  • MacGregor Golf
  • Majesty Golf Co. Ltd.
  • Miura Golf Inc.
  • Parsons Xtreme Golf LLC
  • PING Inc.
  • Takomo Golf
  • Taylor Made Golf Co. Inc.
  • Tour Edge Golf Manufacturing
  • VEGA Golf
  • Yonex Co. Ltd.

Qualitative and quantitative analysis of companies has been conducted to help clients understand the wider business environment as well as the strengths and weaknesses of key industry players. Data is qualitatively analyzed to categorize companies as pure play, category-focused, industry-focused, and diversified; it is quantitatively analyzed to categorize companies as dominant, leading, strong, tentative, and weak.

Recent Development and News in Golf clubs market

  • In the Leisure Products industry, the structural transition toward omnichannel retail integration has optimized direct-to-consumer digital conversion, directly impacting Golf Clubs demand by expanding access to specialized equipment for younger demographics.
  • The rapid scaling of off-course entertainment ecosystems has transformed recreational sporting habits, effectively expanding the total addressable audience for Golf Clubs by transitioning casual simulator users into active on-course equipment purchasers.
  • Ecological manufacturing protocols and sustainable material guidelines have forced major shifts in sporting goods production lines, influencing Golf Clubs manufacturing to adopt recycled component packaging and sustainable supply pathways while cutting raw material waste by 12%.
  • Supply chain decentralization initiatives across the broader sports equipment sector have mitigated regional tariff risks, directly stabilizing localized inventory management for Golf Clubs and shortening retail fulfillment lead times by 20% across primary distribution networks.

Dive into Technavio’s robust research methodology, blending expert interviews, extensive data synthesis, and validated models for unparalleled Golf Clubs Market insights. See full methodology.

Market Scope
Page number 290
Base year 2025
Historic period 2020-2024
Forecast period 2026-2030
Growth momentum & CAGR Accelerate at a CAGR of 2.9%
Market growth 2026-2030 USD 823.3 million
Market structure Fragmented
YoY growth 2025-2026(%) 2.8%
Key countries US, Canada, Mexico, Germany, UK, France, Italy, Spain, The Netherlands, China, Japan, India, South Korea, Australia, Indonesia, Brazil, Argentina, Chile, Saudi Arabia, UAE, South Africa, Israel and Turkey
Competitive landscape Leading Companies, Market Positioning of Companies, Competitive Strategies, and Industry Risks

Request Free Sample

Research Analyst Overview

  • The Golf Clubs Market is undergoing a fundamental transformation dictated by the convergence of data analytics and advanced metallurgy. At the boardroom level, strategic product planning is increasingly reliant on interpreting launch monitor telemetry to guide long-term research and development budgets. Manufacturers are actively pivoting away from generalized designs, utilizing exhaustive swing biomechanics analysis to dictate future inventory pipelines.
  • This data-centric approach has improved overall product development efficiency by 26% compared to traditional trial-and-error prototyping. To capture higher margins, engineering teams are heavily prioritizing aerodynamic clubhead engineering and moment of inertia optimization to deliver measurable performance enhancements on the course.
  • Furthermore, the integration of high-resilience resin inserts and precision-milled face plates allows brands to strictly adhere to regulatory standards while satisfying the tactile demands of elite consumers. These structural innovations directly influence corporate pricing strategies, enabling organizations to justify premium positioning in a saturated retail environment.
  • Ultimately, the synthesis of advanced diagnostic tools with sophisticated manufacturing processes ensures a resilient product strategy capable of navigating complex economic pressures.

What are the Key Data Covered in this Golf Clubs Market Research and Growth Report?

  • What is the expected growth of the Golf Clubs Market between 2026 and 2030?

    • USD 823.3 million, at a CAGR of 2.9%

  • What segmentation does the market report cover?

    • The report is segmented by Application (Leisure, and Professional), Product (Woods, Irons, Putters, and Wedges), Distribution Channel (Offline, and Online) and Geography (North America, Europe, APAC, South America, Middle East and Africa)

  • Which regions are analyzed in the report?

    • North America, Europe, APAC, South America and Middle East and Africa

  • What are the key growth drivers and market challenges?

    • Rising global participation and demographic diversification, Escalate cost barriers and inflationary pressures on discretionary spending

  • Who are the major players in the Golf Clubs Market?

    • Acushnet Co, Bettinardi Golf, Bridgestone Golf Inc., Callaway Golf Co, Cobra Golf, Edel Golf, Evnroll Putters, Haywood Golf, Honma Golf Co. Ltd., Krank Golf, MacGregor Golf, Majesty Golf Co. Ltd., Miura Golf Inc., Parsons Xtreme Golf LLC, PING Inc., Takomo Golf, Taylor Made Golf Co. Inc., Tour Edge Golf Manufacturing, VEGA Golf and Yonex Co. Ltd.

Market Research Insights

  • The Golf Clubs Market operates within a highly dynamic ecosystem driven by technological precision and experiential engagement. The rapid indoor simulation lounge adoption has successfully bridged the gap between casual amusement and dedicated skill progression. Facilities integrating automated hitting bays have increased player retention rates by 34%, translating directly into higher equipment purchasing volumes.
  • Furthermore, the deployment of biomechanical matching systems during retail fitting sessions has reduced product return rates by 22% compared to standard off-the-rack purchases. Accurate green-grass participation tracking indicates that these personalized assessment models significantly elevate consumer confidence, subsequently improving lifetime customer value by nearly 18% as players continuously upgrade specialized components to match their evolving physical capabilities.

We can help! Our analysts can customize this golf clubs market research report to meet your requirements.

Get in touch

1. Executive Summary

1.1 Market overview

Executive Summary - Chart on Market Overview
Executive Summary - Data Table on Market Overview
Executive Summary - Chart on Global Market Characteristics
Executive Summary - Chart on Market by Geography
Executive Summary - Chart on Market Segmentation by Application
Executive Summary - Chart on Market Segmentation by Product
Executive Summary - Chart on Market Segmentation by Distribution Channel
Executive Summary - Chart on Incremental Growth
Executive Summary - Data Table on Incremental Growth
Executive Summary - Chart on Company Market Positioning

2. Technavio Analysis

2.1 Analysis of price sensitivity, lifecycle, customer purchase basket, adoption rates, and purchase criteria

2.2 Criticality of inputs and Factors of differentiation

Chart on Overview on criticality of inputs and factors of differentiation

2.3 Factors of disruption

Chart on Overview on factors of disruption

2.4 Impact of drivers and challenges

Chart on Impact of drivers and challenges in 2025 and 2030

3. Market Landscape

3.1 Market ecosystem

Chart on Parent Market
Data Table on - Parent Market

3.2 Market characteristics

Chart on Market characteristics analysis

3.3 Value chain analysis

Chart on Value chain analysis

4. Market Sizing

4.1 Market definition

Data Table on Offerings of companies included in the market definition

4.2 Market segment analysis

Market segments

4.3 Market size 2025

4.4 Market outlook: Forecast for 2025-2030

Chart on Global - Market size and forecast 2025-2030 ($ million)
Data Table on Global - Market size and forecast 2025-2030 ($ million)
Chart on Global Market: Year-over-year growth 2025-2030 (%)
Data Table on Global Market: Year-over-year growth 2025-2030 (%)

5. Historic Market Size

5.1 Global Golf Clubs Market 2020 - 2024

Historic Market Size - Data Table on Global Golf Clubs Market 2020 - 2024 ($ million)

5.2 Application segment analysis 2020 - 2024

Historic Market Size - Application Segment 2020 - 2024 ($ million)

5.3 Product segment analysis 2020 - 2024

Historic Market Size - Product Segment 2020 - 2024 ($ million)

5.4 Distribution Channel segment analysis 2020 - 2024

Historic Market Size - Distribution Channel Segment 2020 - 2024 ($ million)

5.5 Geography segment analysis 2020 - 2024

Historic Market Size - Geography Segment 2020 - 2024 ($ million)

5.6 Country segment analysis 2020 - 2024

Historic Market Size - Country Segment 2020 - 2024 ($ million)

6. Qualitative Analysis

6.1 Impact of AI on global golf clubs market

6.2 Impact of geopolitical conflicts on global golf clubs market

7. Five Forces Analysis

7.1 Five forces summary

Five forces analysis - Comparison between 2025 and 2030

7.2 Bargaining power of buyers

Bargaining power of buyers - Impact of key factors 2025 and 2030

7.3 Bargaining power of suppliers

Bargaining power of suppliers - Impact of key factors in 2025 and 2030

7.4 Threat of new entrants

Threat of new entrants - Impact of key factors in 2025 and 2030

7.5 Threat of substitutes

Threat of substitutes - Impact of key factors in 2025 and 2030

7.6 Threat of rivalry

Threat of rivalry - Impact of key factors in 2025 and 2030

7.7 Market condition

Chart on Market condition - Five forces 2025 and 2030

8. Market Segmentation by Application

8.1 Market segments

Chart on Application - Market share 2025-2030 (%)
Data Table on Application - Market share 2025-2030 (%)

8.2 Comparison by Application

Chart on Comparison by Application
Data Table on Comparison by Application

8.3 Leisure - Market size and forecast 2025-2030

Chart on Leisure - Market size and forecast 2025-2030 ($ million)
Data Table on Leisure - Market size and forecast 2025-2030 ($ million)
Chart on Leisure - Year-over-year growth 2025-2030 (%)
Data Table on Leisure - Year-over-year growth 2025-2030 (%)

8.4 Professional - Market size and forecast 2025-2030

Chart on Professional - Market size and forecast 2025-2030 ($ million)
Data Table on Professional - Market size and forecast 2025-2030 ($ million)
Chart on Professional - Year-over-year growth 2025-2030 (%)
Data Table on Professional - Year-over-year growth 2025-2030 (%)

8.5 Market opportunity by Application

Market opportunity by Application ($ million)
Data Table on Market opportunity by Application ($ million)

9. Market Segmentation by Product

9.1 Market segments

Chart on Product - Market share 2025-2030 (%)
Data Table on Product - Market share 2025-2030 (%)

9.2 Comparison by Product

Chart on Comparison by Product
Data Table on Comparison by Product

9.3 Woods - Market size and forecast 2025-2030

Chart on Woods - Market size and forecast 2025-2030 ($ million)
Data Table on Woods - Market size and forecast 2025-2030 ($ million)
Chart on Woods - Year-over-year growth 2025-2030 (%)
Data Table on Woods - Year-over-year growth 2025-2030 (%)

9.4 Irons - Market size and forecast 2025-2030

Chart on Irons - Market size and forecast 2025-2030 ($ million)
Data Table on Irons - Market size and forecast 2025-2030 ($ million)
Chart on Irons - Year-over-year growth 2025-2030 (%)
Data Table on Irons - Year-over-year growth 2025-2030 (%)

9.5 Putters - Market size and forecast 2025-2030

Chart on Putters - Market size and forecast 2025-2030 ($ million)
Data Table on Putters - Market size and forecast 2025-2030 ($ million)
Chart on Putters - Year-over-year growth 2025-2030 (%)
Data Table on Putters - Year-over-year growth 2025-2030 (%)

9.6 Wedges - Market size and forecast 2025-2030

Chart on Wedges - Market size and forecast 2025-2030 ($ million)
Data Table on Wedges - Market size and forecast 2025-2030 ($ million)
Chart on Wedges - Year-over-year growth 2025-2030 (%)
Data Table on Wedges - Year-over-year growth 2025-2030 (%)

9.7 Market opportunity by Product

Market opportunity by Product ($ million)
Data Table on Market opportunity by Product ($ million)

10. Market Segmentation by Distribution Channel

10.1 Market segments

Chart on Distribution Channel - Market share 2025-2030 (%)
Data Table on Distribution Channel - Market share 2025-2030 (%)

10.2 Comparison by Distribution Channel

Chart on Comparison by Distribution Channel
Data Table on Comparison by Distribution Channel

10.3 Offline - Market size and forecast 2025-2030

Chart on Offline - Market size and forecast 2025-2030 ($ million)
Data Table on Offline - Market size and forecast 2025-2030 ($ million)
Chart on Offline - Year-over-year growth 2025-2030 (%)
Data Table on Offline - Year-over-year growth 2025-2030 (%)

10.4 Online - Market size and forecast 2025-2030

Chart on Online - Market size and forecast 2025-2030 ($ million)
Data Table on Online - Market size and forecast 2025-2030 ($ million)
Chart on Online - Year-over-year growth 2025-2030 (%)
Data Table on Online - Year-over-year growth 2025-2030 (%)

10.5 Market opportunity by Distribution Channel

Market opportunity by Distribution Channel ($ million)
Data Table on Market opportunity by Distribution Channel ($ million)

11. Customer Landscape

11.1 Customer landscape overview

Analysis of price sensitivity, lifecycle, customer purchase basket, adoption rates, and purchase criteria

12. Geographic Landscape

12.1 Geographic segmentation

Chart on Market share by geography 2025-2030 (%)
Data Table on Market share by geography 2025-2030 (%)

12.2 Geographic comparison

Chart on Geographic comparison
Data Table on Geographic comparison

12.3 North America - Market size and forecast 2025-2030

Chart on North America - Market size and forecast 2025-2030 ($ million)
Data Table on North America - Market size and forecast 2025-2030 ($ million)
Chart on North America - Year-over-year growth 2025-2030 (%)
Data Table on North America - Year-over-year growth 2025-2030 (%)
Chart on Regional Comparison - North America
Data Table on Regional Comparison - North America

12.3.1 US - Market size and forecast 2025-2030

Chart on US - Market size and forecast 2025-2030 ($ million)
Data Table on US - Market size and forecast 2025-2030 ($ million)
Chart on US - Year-over-year growth 2025-2030 (%)
Data Table on US - Year-over-year growth 2025-2030 (%)

12.3.2 Canada - Market size and forecast 2025-2030

Chart on Canada - Market size and forecast 2025-2030 ($ million)
Data Table on Canada - Market size and forecast 2025-2030 ($ million)
Chart on Canada - Year-over-year growth 2025-2030 (%)
Data Table on Canada - Year-over-year growth 2025-2030 (%)

12.3.3 Mexico - Market size and forecast 2025-2030

Chart on Mexico - Market size and forecast 2025-2030 ($ million)
Data Table on Mexico - Market size and forecast 2025-2030 ($ million)
Chart on Mexico - Year-over-year growth 2025-2030 (%)
Data Table on Mexico - Year-over-year growth 2025-2030 (%)

12.4 Europe - Market size and forecast 2025-2030

Chart on Europe - Market size and forecast 2025-2030 ($ million)
Data Table on Europe - Market size and forecast 2025-2030 ($ million)
Chart on Europe - Year-over-year growth 2025-2030 (%)
Data Table on Europe - Year-over-year growth 2025-2030 (%)
Chart on Regional Comparison - Europe
Data Table on Regional Comparison - Europe

12.4.1 Germany - Market size and forecast 2025-2030

Chart on Germany - Market size and forecast 2025-2030 ($ million)
Data Table on Germany - Market size and forecast 2025-2030 ($ million)
Chart on Germany - Year-over-year growth 2025-2030 (%)
Data Table on Germany - Year-over-year growth 2025-2030 (%)

12.4.2 UK - Market size and forecast 2025-2030

Chart on UK - Market size and forecast 2025-2030 ($ million)
Data Table on UK - Market size and forecast 2025-2030 ($ million)
Chart on UK - Year-over-year growth 2025-2030 (%)
Data Table on UK - Year-over-year growth 2025-2030 (%)

12.4.3 France - Market size and forecast 2025-2030

Chart on France - Market size and forecast 2025-2030 ($ million)
Data Table on France - Market size and forecast 2025-2030 ($ million)
Chart on France - Year-over-year growth 2025-2030 (%)
Data Table on France - Year-over-year growth 2025-2030 (%)

12.4.4 Italy - Market size and forecast 2025-2030

Chart on Italy - Market size and forecast 2025-2030 ($ million)
Data Table on Italy - Market size and forecast 2025-2030 ($ million)
Chart on Italy - Year-over-year growth 2025-2030 (%)
Data Table on Italy - Year-over-year growth 2025-2030 (%)

12.4.5 Spain - Market size and forecast 2025-2030

Chart on Spain - Market size and forecast 2025-2030 ($ million)
Data Table on Spain - Market size and forecast 2025-2030 ($ million)
Chart on Spain - Year-over-year growth 2025-2030 (%)
Data Table on Spain - Year-over-year growth 2025-2030 (%)

12.4.6 The Netherlands - Market size and forecast 2025-2030

Chart on The Netherlands - Market size and forecast 2025-2030 ($ million)
Data Table on The Netherlands - Market size and forecast 2025-2030 ($ million)
Chart on The Netherlands - Year-over-year growth 2025-2030 (%)
Data Table on The Netherlands - Year-over-year growth 2025-2030 (%)

12.5 APAC - Market size and forecast 2025-2030

Chart on APAC - Market size and forecast 2025-2030 ($ million)
Data Table on APAC - Market size and forecast 2025-2030 ($ million)
Chart on APAC - Year-over-year growth 2025-2030 (%)
Data Table on APAC - Year-over-year growth 2025-2030 (%)
Chart on Regional Comparison - APAC
Data Table on Regional Comparison - APAC

12.5.1 China - Market size and forecast 2025-2030

Chart on China - Market size and forecast 2025-2030 ($ million)
Data Table on China - Market size and forecast 2025-2030 ($ million)
Chart on China - Year-over-year growth 2025-2030 (%)
Data Table on China - Year-over-year growth 2025-2030 (%)

12.5.2 Japan - Market size and forecast 2025-2030

Chart on Japan - Market size and forecast 2025-2030 ($ million)
Data Table on Japan - Market size and forecast 2025-2030 ($ million)
Chart on Japan - Year-over-year growth 2025-2030 (%)
Data Table on Japan - Year-over-year growth 2025-2030 (%)

12.5.3 India - Market size and forecast 2025-2030

Chart on India - Market size and forecast 2025-2030 ($ million)
Data Table on India - Market size and forecast 2025-2030 ($ million)
Chart on India - Year-over-year growth 2025-2030 (%)
Data Table on India - Year-over-year growth 2025-2030 (%)

12.5.4 South Korea - Market size and forecast 2025-2030

Chart on South Korea - Market size and forecast 2025-2030 ($ million)
Data Table on South Korea - Market size and forecast 2025-2030 ($ million)
Chart on South Korea - Year-over-year growth 2025-2030 (%)
Data Table on South Korea - Year-over-year growth 2025-2030 (%)

12.5.5 Australia - Market size and forecast 2025-2030

Chart on Australia - Market size and forecast 2025-2030 ($ million)
Data Table on Australia - Market size and forecast 2025-2030 ($ million)
Chart on Australia - Year-over-year growth 2025-2030 (%)
Data Table on Australia - Year-over-year growth 2025-2030 (%)

12.5.6 Indonesia - Market size and forecast 2025-2030

Chart on Indonesia - Market size and forecast 2025-2030 ($ million)
Data Table on Indonesia - Market size and forecast 2025-2030 ($ million)
Chart on Indonesia - Year-over-year growth 2025-2030 (%)
Data Table on Indonesia - Year-over-year growth 2025-2030 (%)

12.6 South America - Market size and forecast 2025-2030

Chart on South America - Market size and forecast 2025-2030 ($ million)
Data Table on South America - Market size and forecast 2025-2030 ($ million)
Chart on South America - Year-over-year growth 2025-2030 (%)
Data Table on South America - Year-over-year growth 2025-2030 (%)
Chart on Regional Comparison - South America
Data Table on Regional Comparison - South America

12.6.1 Brazil - Market size and forecast 2025-2030

Chart on Brazil - Market size and forecast 2025-2030 ($ million)
Data Table on Brazil - Market size and forecast 2025-2030 ($ million)
Chart on Brazil - Year-over-year growth 2025-2030 (%)
Data Table on Brazil - Year-over-year growth 2025-2030 (%)

12.6.2 Argentina - Market size and forecast 2025-2030

Chart on Argentina - Market size and forecast 2025-2030 ($ million)
Data Table on Argentina - Market size and forecast 2025-2030 ($ million)
Chart on Argentina - Year-over-year growth 2025-2030 (%)
Data Table on Argentina - Year-over-year growth 2025-2030 (%)

12.6.3 Chile - Market size and forecast 2025-2030

Chart on Chile - Market size and forecast 2025-2030 ($ million)
Data Table on Chile - Market size and forecast 2025-2030 ($ million)
Chart on Chile - Year-over-year growth 2025-2030 (%)
Data Table on Chile - Year-over-year growth 2025-2030 (%)

12.7 Middle East and Africa - Market size and forecast 2025-2030

Chart on Middle East and Africa - Market size and forecast 2025-2030 ($ million)
Data Table on Middle East and Africa - Market size and forecast 2025-2030 ($ million)
Chart on Middle East and Africa - Year-over-year growth 2025-2030 (%)
Data Table on Middle East and Africa - Year-over-year growth 2025-2030 (%)
Chart on Regional Comparison - Middle East and Africa
Data Table on Regional Comparison - Middle East and Africa

12.7.1 Saudi Arabia - Market size and forecast 2025-2030

Chart on Saudi Arabia - Market size and forecast 2025-2030 ($ million)
Data Table on Saudi Arabia - Market size and forecast 2025-2030 ($ million)
Chart on Saudi Arabia - Year-over-year growth 2025-2030 (%)
Data Table on Saudi Arabia - Year-over-year growth 2025-2030 (%)

12.7.2 UAE - Market size and forecast 2025-2030

Chart on UAE - Market size and forecast 2025-2030 ($ million)
Data Table on UAE - Market size and forecast 2025-2030 ($ million)
Chart on UAE - Year-over-year growth 2025-2030 (%)
Data Table on UAE - Year-over-year growth 2025-2030 (%)

12.7.3 South Africa - Market size and forecast 2025-2030

Chart on South Africa - Market size and forecast 2025-2030 ($ million)
Data Table on South Africa - Market size and forecast 2025-2030 ($ million)
Chart on South Africa - Year-over-year growth 2025-2030 (%)
Data Table on South Africa - Year-over-year growth 2025-2030 (%)

12.7.4 Israel - Market size and forecast 2025-2030

Chart on Israel - Market size and forecast 2025-2030 ($ million)
Data Table on Israel - Market size and forecast 2025-2030 ($ million)
Chart on Israel - Year-over-year growth 2025-2030 (%)
Data Table on Israel - Year-over-year growth 2025-2030 (%)

12.7.5 Turkey - Market size and forecast 2025-2030

Chart on Turkey - Market size and forecast 2025-2030 ($ million)
Data Table on Turkey - Market size and forecast 2025-2030 ($ million)
Chart on Turkey - Year-over-year growth 2025-2030 (%)
Data Table on Turkey - Year-over-year growth 2025-2030 (%)

12.8 Market opportunity by geography

Market opportunity by geography ($ million)
Data Tables on Market opportunity by geography ($ million)

13. Drivers, Challenges, and Opportunity

13.1 Market drivers

Rising global participation and demographic diversification
Technological innovation and material premiumization
Proliferation of off-course entertainment and golf tourism

13.2 Market challenges

Escalate cost barriers and inflationary pressures on discretionary spending
Stringent regulatory standards and equipment conformity mandates
Demographic retention hurdles and changing recreational preferences

13.3 Impact of drivers and challenges

Impact of drivers and challenges in 2025 and 2030

13.4 Market opportunities

Accelerated adoption of data-driven custom club fitting and smart technologies
Premiumization through aerospace-grade materials and AI-optimized architectures
Supply chain decentralization and geographically diverse import influxes

14. Competitive Landscape

14.1 Overview

14.2

Overview on criticality of inputs and factors of differentiation

14.3 Landscape disruption

Overview on factors of disruption

14.4 Industry risks

Impact of key risks on business

15. Competitive Analysis

15.1 Companies profiled

Companies covered

15.2 Company ranking index

15.3 Market positioning of companies

Matrix on companies position and classification

15.4 Bridgestone Golf Inc.

Bridgestone Golf Inc. - Overview
Bridgestone Golf Inc. - Product / Service
Bridgestone Golf Inc. - Key offerings
SWOT

15.5 Callaway Golf Co

Callaway Golf Co - Overview
Callaway Golf Co - Business segments
Callaway Golf Co - Key offerings
Callaway Golf Co - Segment focus
SWOT

15.6 Cobra Golf

Cobra Golf - Overview
Cobra Golf - Product / Service
Cobra Golf - Key offerings
SWOT

15.7 Edel Golf

Edel Golf - Overview
Edel Golf - Product / Service
Edel Golf - Key offerings
SWOT

15.8 Haywood Golf

Haywood Golf - Overview
Haywood Golf - Product / Service
Haywood Golf - Key offerings
SWOT

15.9 Honma Golf Co. Ltd.

Honma Golf Co. Ltd. - Overview
Honma Golf Co. Ltd. - Product / Service
Honma Golf Co. Ltd. - Key offerings
SWOT

15.10 Krank Golf

Krank Golf - Overview
Krank Golf - Product / Service
Krank Golf - Key offerings
SWOT

15.11 MacGregor Golf

MacGregor Golf - Overview
MacGregor Golf - Product / Service
MacGregor Golf - Key offerings
SWOT

15.12 Majesty Golf Co. Ltd.

Majesty Golf Co. Ltd. - Overview
Majesty Golf Co. Ltd. - Product / Service
Majesty Golf Co. Ltd. - Key offerings
SWOT

15.13 Miura Golf Inc.

Miura Golf Inc. - Overview
Miura Golf Inc. - Product / Service
Miura Golf Inc. - Key offerings
SWOT

15.14 Parsons Xtreme Golf LLC

Parsons Xtreme Golf LLC - Overview
Parsons Xtreme Golf LLC - Product / Service
Parsons Xtreme Golf LLC - Key offerings
SWOT

15.15 PING Inc.

PING Inc. - Overview
PING Inc. - Product / Service
PING Inc. - Key offerings
SWOT

15.16 Taylor Made Golf Co. Inc.

Taylor Made Golf Co. Inc. - Overview
Taylor Made Golf Co. Inc. - Product / Service
Taylor Made Golf Co. Inc. - Key offerings
SWOT

15.17 VEGA Golf

VEGA Golf - Overview
VEGA Golf - Product / Service
VEGA Golf - Key offerings
SWOT

15.18 Yonex Co. Ltd.

Yonex Co. Ltd. - Overview
Yonex Co. Ltd. - Business segments
Yonex Co. Ltd. - Key offerings
Yonex Co. Ltd. - Segment focus
SWOT

16. Appendix

16.1 Scope of the report

Market definition
Objectives
Notes and caveats

16.2 Inclusions and exclusions checklist

Inclusions checklist
Exclusions checklist

16.3 Currency conversion rates for US$

16.4 Research methodology

16.5 Data procurement

Information sources

16.6 Data validation

16.7 Validation techniques employed for market sizing

16.8 Data synthesis

16.9 360 degree market analysis

16.10 List of abbreviations

Research Methodology

Technavio presents a detailed picture of the market by way of study, synthesis, and summation of data from multiple sources. The analysts have presented the various facets of the market with a particular focus on identifying the key industry influencers. The data thus presented is comprehensive, reliable, and the result of extensive research, both primary and secondary.

INFORMATION SOURCES

Primary sources

  • Manufacturers and suppliers
  • Channel partners
  • Industry experts
  • Strategic decision makers

Secondary sources

  • Industry journals and periodicals
  • Government data
  • Financial reports of key industry players
  • Historical data
  • Press releases

DATA ANALYSIS

Data Synthesis

  • Collation of data
  • Estimation of key figures
  • Analysis of derived insights

Data Validation

  • Triangulation with data models
  • Reference against proprietary databases
  • Corroboration with industry experts

REPORT WRITING

Qualitative

  • Market drivers
  • Market challenges
  • Market trends
  • Five forces analysis

Quantitative

  • Market size and forecast
  • Market segmentation
  • Geographical insights
  • Competitive landscape

Interested in this report?

Get your sample now to see our research methodology and insights!

Download Now

Frequently Asked Questions

Golf Clubs market growth will increase by USD 823.3 million during 2026-2030.

The Golf Clubs market is expected to grow at a CAGR of 2.9% during 2026-2030.

Golf Clubs market is segmented by Application (Leisure, Professional) Product (Woods, Irons, Putters, Wedges) Distribution channel (Offline, Online)

Acushnet Co, Bettinardi Golf, Bridgestone Golf Inc., Callaway Golf Co, Cobra Golf, Edel Golf, Evnroll Putters, Haywood Golf, Honma Golf Co. Ltd., Krank Golf, MacGregor Golf, Majesty Golf Co. Ltd., Miura Golf Inc., Parsons Xtreme Golf LLC, PING Inc., Takomo Golf, Taylor Made Golf Co. Inc., Tour Edge Golf Manufacturing, VEGA Golf, Yonex Co. Ltd. are a few of the key vendors in the Golf Clubs market.

North America will register the highest growth rate of 42.1% among the other regions. Therefore, the Golf Clubs market in North America is expected to garner significant business opportunities for the vendors during the forecast period.

US, Canada, Mexico, Germany, UK, France, Italy, Spain, The Netherlands, China, Japan, India, South Korea, Australia, Indonesia, Brazil, Argentina, Chile, Saudi Arabia, UAE, South Africa, Israel, Turkey

  • Rising global participation and demographic diversification is the driving factor this market.

The Golf Clubs market vendors should focus on grabbing business opportunities from the Application segment as it accounted for the largest market share in the base year.
RIA - Research AI Assistant
Ask RIA
