Activated Carbon Filters Market Size 2024-2028
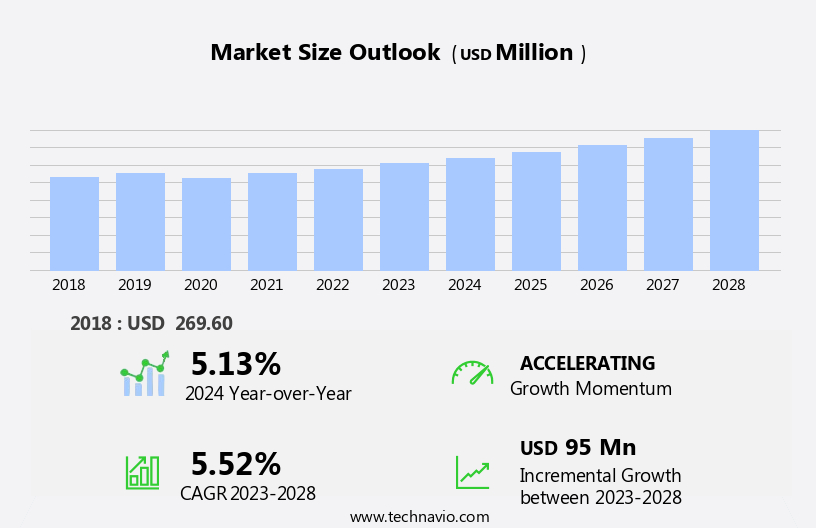
The activated carbon filters market size is forecast to increase by USD 95 million, at a CAGR of 5.52% between 2023 and 2028.
- The market is driven by the surging demand for water purification applications in various industries, including pharmaceuticals, food and beverage, and oil and gas. This need arises from the increasing awareness of water quality and the stringent regulations imposed by governments to ensure clean water supply. Another key trend is the expanding application of activated carbon filters in pollution control, as industries strive to minimize their carbon footprint and comply with environmental regulations. However, the market faces technical challenges, such as the limited adsorption capacity and the regeneration requirements of activated carbon filters.
- These constraints necessitate continuous research and development efforts to improve the efficiency and longevity of these filters. Companies in the market can capitalize on the growing demand by focusing on innovation and addressing the technical limitations, ensuring they provide cost-effective and high-performance solutions to their clients.
What will be the Size of the Activated Carbon Filters Market during the forecast period?
Explore in-depth regional segment analysis with market size data - historical 2018-2022 and forecasts 2024-2028 - in the full report.
Request Free Sample
Activated carbon filters continue to be a dynamic and evolving market, with ongoing advancements in technology and applications across various sectors. These filters play a crucial role in odor control, disposal methods, and water treatment, among others. The supply chain for activated carbon filters is intricately linked to the manufacturing process, with pressure drop and material selection being key considerations. Block filters, cartridge filters, and granular activated carbon are commonly used in applications such as chlorine removal, automotive filters, and air purification. The residential market also presents significant opportunities, with growing demand for sustainable practices and longer filter service life.
The material selection and manufacturing process of activated carbon filters are critical to ensuring filtration efficiency, adsorption capacity, and surface area. Life cycle assessment, cost analysis, and regulatory compliance are also essential factors in the evolving market dynamics. Testing standards continue to evolve, with a focus on particle filtration, mercury removal, and VOC removal. Distribution networks and quality control are also crucial components of the market, ensuring timely delivery and consistent product performance. Gas adsorption and pharmaceutical applications are emerging areas of growth for activated carbon filters. HVAC systems and filtration efficiency are also gaining importance, as the need for clean air and water becomes increasingly critical.
The ongoing unfolding of market activities and evolving patterns in the market reflect the continuous demand for effective and sustainable filtration solutions. The market's dynamism is driven by advancements in technology, regulatory requirements, and changing consumer preferences.
How is this Activated Carbon Filters Industry segmented?
The activated carbon filters industry research report provides comprehensive data (region-wise segment analysis), with forecasts and estimates in "USD million" for the period 2024-2028, as well as historical data from 2018-2022 for the following segments.
- Type
- Stainless steel shell
- Carbon steel shell
- Geography
- North America
- US
- Europe
- Germany
- APAC
- China
- India
- Japan
- Rest of World (ROW)
- North America
By Type Insights
The stainless steel shell segment is estimated to witness significant growth during the forecast period.
Activated carbon filters experienced significant growth in various industries, including water treatment, automotive, and air purification, in 2023. The market's dynamics were driven by the increasing demand for effective odor control and regulatory compliance. In water treatment applications, activated carbon filters effectively removed chlorine and volatile organic compounds (VOCs), ensuring safe drinking water. In the automotive sector, activated carbon filters were integral to air purification systems, eliminating harmful pollutants and ensuring passenger comfort. The disposal methods for spent activated carbon filters posed a challenge, with an emphasis on sustainable practices and life cycle assessment. The supply chain for activated carbon filters involved careful material selection and manufacturing processes to optimize adsorption capacity, surface area, and filtration efficiency.
Carbon granules and block filters were popular choices due to their high adsorption capacity and filtration efficiency. Pressure drop and service life were critical factors in the selection of filter media, with cartridge filters offering ease of replacement and cost-effective solutions. Regulatory compliance and quality control were essential in pharmaceutical applications, where mercury removal and particle filtration were crucial. The manufacturing process for activated carbon involved careful pore size distribution and sustainable practices to minimize environmental impact. Commercial applications ranged from HVAC systems to gas adsorption, with the latter gaining traction due to its ability to remove harmful gases.
In conclusion, the market showcased robust growth in 2023, with stainless steel shell filters leading the way due to their durability and anti-corrosion properties. The market's trends focused on improving filtration efficiency, ensuring regulatory compliance, and promoting sustainable practices.
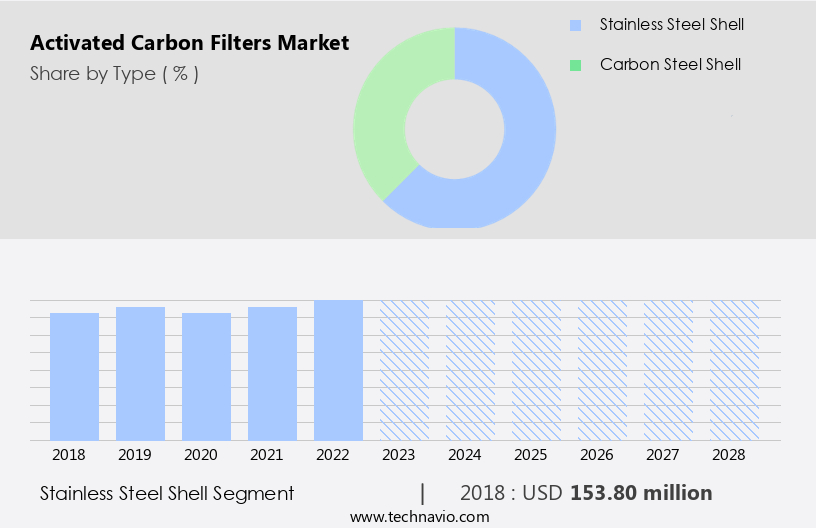
The Stainless steel shell segment was valued at USD 153.80 million in 2018 and showed a gradual increase during the forecast period.
Regional Analysis
APAC is estimated to contribute 52% to the growth of the global market during the forecast period.Technavio's analysts have elaborately explained the regional trends and drivers that shape the market during the forecast period.
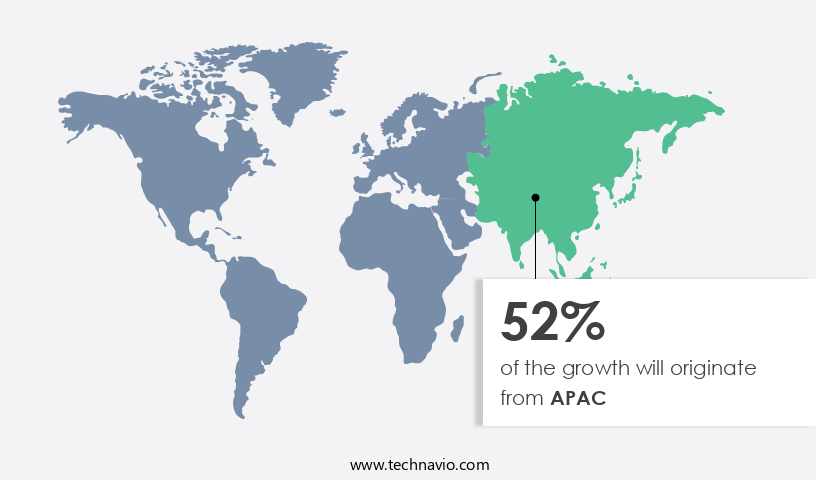
The market is experiencing significant growth, particularly in the Asia Pacific region. Fueled by rising urbanization and industrialization, China and India are leading consumers of these filters, primarily for water and wastewater treatment applications. The increasing construction sector and heavy metal waste generation in the region contribute to the market's expansion. In China, the industry's value-added accounted for 39.9% of its GDP in 2022. As part of its 13th five-year plan, China intends to invest USD82 billion in environmental protection, further boosting the demand for activated carbon filters. Activated carbon filters are essential in odor control and chlorine removal processes.
Their use extends to residential applications, HVAC systems, and commercial applications, including automotive filters and pharmaceutical applications. Material selection and life cycle assessment are crucial factors in the supply chain, ensuring regulatory compliance and maintaining quality control. Cartridge filters and block filters are popular choices due to their filtration efficiency and adsorption capacity. The manufacturing process involves careful control of pore size distribution and surface area to optimize adsorption capacity. Sustainable practices, such as carbon granules and gas adsorption, are gaining importance in the market. Pressure drop and cost analysis are essential considerations in the market, with distribution networks playing a vital role in ensuring timely delivery and customer satisfaction.
Testing standards ensure the filters' effectiveness in removing volatile organic compounds (VOCs) and other pollutants, including mercury and particulate matter. The market's trends include the increasing use of activated carbon filters in air purification systems and the growing demand for filters with higher filtration efficiency and longer service life. Overall, the market is poised for continued growth, driven by the increasing demand for cleaner water, air, and industrial processes.
Market Dynamics
Our researchers analyzed the data with 2023 as the base year, along with the key drivers, trends, and challenges. A holistic analysis of drivers will help companies refine their marketing strategies to gain a competitive advantage.
The global activated carbon filters market size and forecast projects growth, driven by activated carbon filters market trends 2024-2028. B2B filter supply solutions leverage advanced filtration technologies for efficiency. Activated carbon filters market growth opportunities 2025 include filters for water treatment and air purification filters, meeting demand. Filter supply chain software optimizes operations, while activated carbon filters market competitive analysis highlights key manufacturers. Sustainable filter production practices align with eco-friendly filtration trends. Activated carbon filters regulations 2024-2028 shapes filter demand in Europe 2025. High-efficiency filter solutions and premium filter market insights boost adoption. Filters for industrial use and customized filter designs target niches. Activated carbon filters market challenges and solutions address cost, with direct procurement strategies for filters and filter pricing optimization enhancing profitability. Data-driven filter market analytics and smart filtration trends drive innovation.
What are the key market drivers leading to the rise in the adoption of Activated Carbon Filters Industry?
- The water purification industry experiences significant market growth due to escalating demand for water treatment solutions in various sectors.
- Activated carbon filters have gained significant importance in various industries due to their high adsorption capacity for contaminants and impurities. The primary applications of these filters are in water and air purification processes. With the increasing global population and rapid industrialization, particularly in developing countries, there is a growing demand for clean water and air. The World Bank Group reports a 13% increase in the global population between 2010 and 2022. This population growth, coupled with industrialization, has led to the pollution of freshwater sources and the depletion or scarcity of freshwater resources. Activated carbon filters, with their large surface area and pore size distribution, effectively address these concerns.
- Sustainable manufacturing processes are increasingly being adopted in the production of filter media to minimize environmental impact. The commercial applications of activated carbon filters extend beyond water and air purification, making them a versatile and essential filter media in various industries.
What are the market trends shaping the Activated Carbon Filters Industry?
- The increasing concern for pollution control is a notable market trend. This growing demand reflects the need for advanced technologies and solutions to mitigate environmental impacts.
- Activated carbon filters are essential components in odor control and pollutant removal systems, particularly for industrial applications. The growing need to comply with stringent emission regulations, such as those set by the US Environmental Protection Agency (EPA), is driving the demand for these filters. Mercury control technology is a key application area, with many large manufacturing facilities, including coal-fired power plants and cement plants, required to adopt the best available techniques (BAT) to reduce mercury and other hazardous air pollutants. Activated carbon filters are effective in chlorine removal and are also used in residential applications. The supply chain for activated carbon filters involves the production of activated carbon from raw materials like coconut shells, coal, and wood.
- The material selection and manufacturing process significantly impact the filter's performance, including its service life and pressure drop. Block filters are a popular design due to their high filtration capacity and ease of replacement. Proper disposal methods for spent activated carbon are essential to minimize environmental impact. The increasing focus on sustainability and circular economy principles may lead to innovations in the reuse and recycling of spent activated carbon.
What challenges does the Activated Carbon Filters Industry face during its growth?
- The growth of the industry is constrained by the technical limitations associated with activated carbon products. Specifically, these limitations pose significant challenges that must be addressed in order to drive industry advancements.
- Activated carbon filters play a significant role in water and air purification applications. However, their performance depends on the optimal use of activated carbon, which is not a universal solution for removing all contaminants. These filters are ineffective against certain chemicals, such as nitrates and heavy metals, and some pathogenic bacteria and viruses. Furthermore, activated carbon filters can clog and channel impurities, leading to reduced efficiency and increased maintenance costs. Consequently, the limitations of activated carbon filters may hinder their market growth during the forecast period. In the realm of water treatment, cartridge filters employing activated carbon are subjected to rigorous testing standards to ensure their effectiveness and efficiency.
- Cost analysis is a crucial factor in determining the market potential of activated carbon filters, as their high initial cost and replacement frequency can be a deterrent for some consumers. Establishing robust distribution networks is essential for market penetration, as activated carbon filters are used in various industries, including automotive and air purification. Gas adsorption is the primary mechanism of activated carbon filters, making them an attractive option for removing volatile organic compounds and other impurities. Despite their limitations, the market for activated carbon filters continues to grow due to their proven effectiveness in addressing a wide range of contaminants and their ability to improve overall water and air quality.
Exclusive Customer Landscape
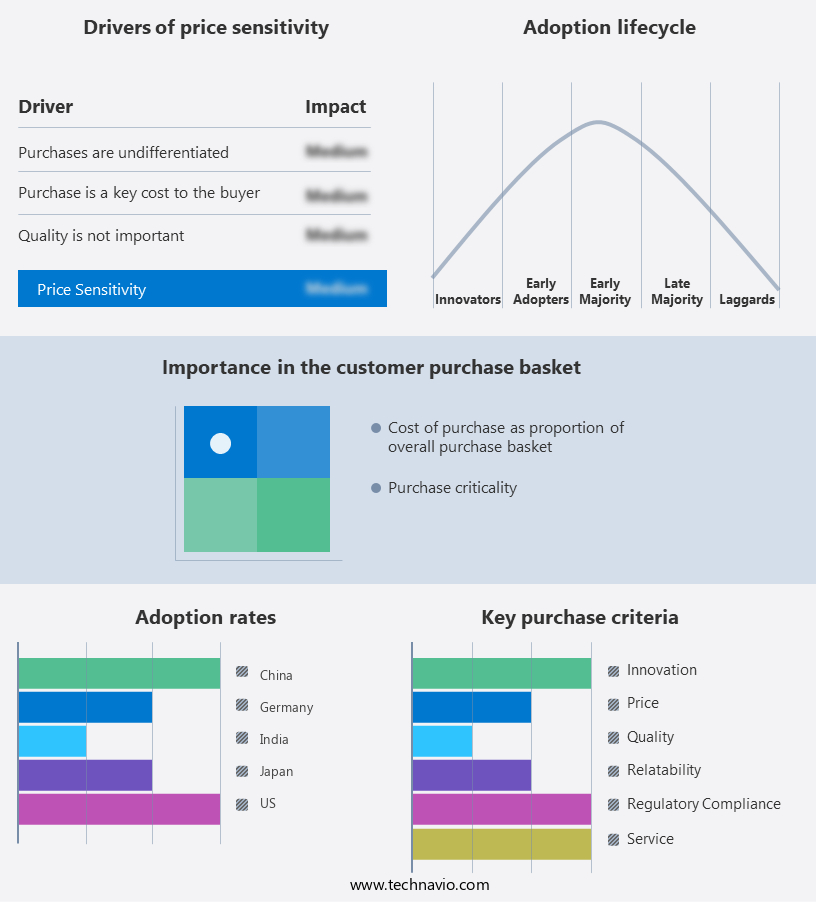
The activated carbon filters market forecasting report includes the adoption lifecycle of the market, covering from the innovator's stage to the laggard's stage. It focuses on adoption rates in different regions based on penetration. Furthermore, the activated carbon filters market report also includes key purchase criteria and drivers of price sensitivity to help companies evaluate and develop their market growth analysis strategies.
Customer Landscape
Key Companies & Market Insights
Companies are implementing various strategies, such as strategic alliances, activated carbon filters market forecast, partnerships, mergers and acquisitions, geographical expansion, and product/service launches, to enhance their presence in the industry.
ARQ Inc. - The company specializes in providing activated carbon filters, specifically the PowerPAC and PowerPAC WS models. These filters effectively remove impurities from various industrial and water applications through a proven adsorption process.
The industry research and growth report includes detailed analyses of the competitive landscape of the market and information about key companies, including:
- ARQ Inc.
- Bionics Consortium Pvt. Ltd.
- Cabot Corp.
- Carbtrol Corp.
- Condorchem Envitech SL
- Donau Carbon GmbH
- Ecologix Environmental Systems LLC
- Eureka Forbes Ltd.
- General Carbon Corp.
- Haycarb PLC
- KURARAY Co. Ltd.
- Kureha Corp.
- Lenntech BV
- Newterra Ltd.
- ProMinent GmbH
- Puragen Activated Carbons
- SERECO Srl
- Silcarbon Aktivkohle GmbH
- WesTech Engineering LLC
- Wolftechnik Filtersysteme GmbH and Co. KG
Qualitative and quantitative analysis of companies has been conducted to help clients understand the wider business environment as well as the strengths and weaknesses of key industry players. Data is qualitatively analyzed to categorize companies as pure play, category-focused, industry-focused, and diversified; it is quantitatively analyzed to categorize companies as dominant, leading, strong, tentative, and weak.
Recent Development and News in Activated Carbon Filters Market
- In January 2024, 3M, a leading industrial company, announced the launch of its new line of advanced activated carbon filters, the Granular Activated Carbon (GAC) X-Series, designed for enhanced water treatment applications (3M Press Release, 2024). This innovative product line offers improved adsorption capacity and longer service life, addressing the growing demand for more efficient water filtration solutions.
- In March 2024, DuPont Water & Process Solutions and Kuraray Co. Ltd. Entered into a strategic partnership to develop and commercialize advanced activated carbon materials for water and air purification applications (DuPont Press Release, 2024). This collaboration combines DuPont's expertise in activated carbon technology with Kuraray's innovative manufacturing capabilities, aiming to create high-performance filters that cater to various industries.
- In May 2024, Carbon Activated Filters Inc. (CAFI), a leading activated carbon filter manufacturer, completed a USD15 million Series B funding round, led by Siemens Energy and Air Liquide (CAFI Press Release, 2024). The investment will support the expansion of CAFI's production capacity and the development of new, technologically advanced filters for various industries, including oil and gas, power generation, and water treatment.
- In April 2025, the European Union (EU) approved the use of activated carbon filters in the removal of per- and polyfluoroalkyl substances (PFAS) from drinking water (EU Commission Press Release, 2025). This regulatory approval marks a significant milestone in the fight against PFAS contamination and is expected to drive demand for activated carbon filters in the European water treatment market.
Research Analyst Overview
- The market encompasses various types of activated carbon, including powdered and granular forms derived from coconut shells, coal, and wood. Market dynamics are influenced by factors such as particle size, breakthrough curve, and chemical and physical activation methods. Thermal regeneration techniques, like steam activation, are commonly used to restore spent carbon's adsorption capacity. Kinetic studies on iodine number, methylene blue number, moisture content, and ash content impact the carbon's performance. Consumer preferences lean towards high-performing, cost-effective filters with optimal flow rates.
- Product development focuses on enhancing bulk density, improving chemical regeneration processes, and reducing waste management challenges. Pricing strategies play a crucial role in market competitiveness, with chemical regeneration and coal-based carbon offering cost advantages over physical activation and coconut shell carbon.
Dive into Technavio's robust research methodology, blending expert interviews, extensive data synthesis, and validated models for unparalleled Activated Carbon Filters Market insights. See full methodology.
|
Market Scope |
|
|
Report Coverage |
Details |
|
Page number |
132 |
|
Base year |
2023 |
|
Historic period |
2018-2022 |
|
Forecast period |
2024-2028 |
|
Growth momentum & CAGR |
Accelerate at a CAGR of 5.52% |
|
Market growth 2024-2028 |
USD 95 million |
|
Market structure |
Fragmented |
|
YoY growth 2023-2024(%) |
5.13 |
|
Key countries |
China, US, Germany, Japan, and India |
|
Competitive landscape |
Leading Companies, Market Positioning of Companies, Competitive Strategies, and Industry Risks |
What are the Key Data Covered in this Activated Carbon Filters Market Research and Growth Report?
- CAGR of the Activated Carbon Filters industry during the forecast period
- Detailed information on factors that will drive the growth and forecasting between 2024 and 2028
- Precise estimation of the size of the market and its contribution of the industry in focus to the parent market
- Accurate predictions about upcoming growth and trends and changes in consumer behaviour
- Growth of the market across APAC, North America, Europe, South America, and Middle East and Africa
- Thorough analysis of the market's competitive landscape and detailed information about companies
- Comprehensive analysis of factors that will challenge the activated carbon filters market growth of industry companies
We can help! Our analysts can customize this activated carbon filters market research report to meet your requirements.
 RIA -
RIA - 
