
Volatile Organic Compound Gas Sensor Market Size 2024-2028
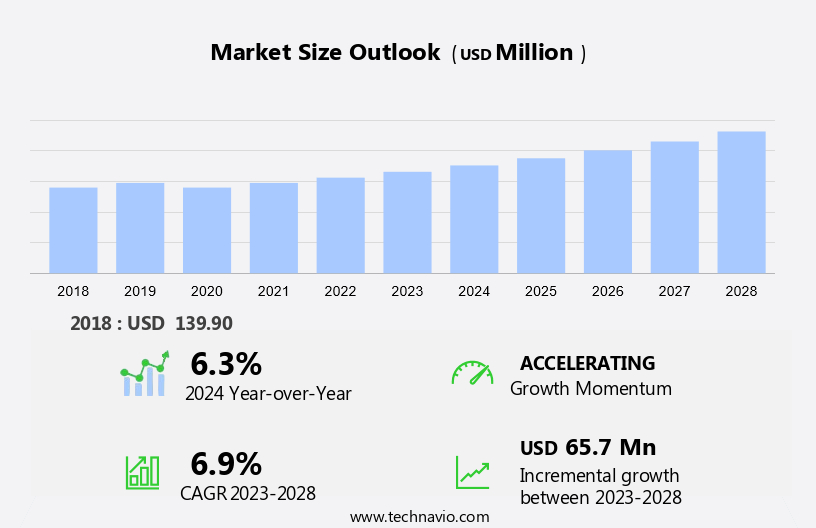
The volatile organic compound gas sensor market size is forecast to increase by USD 65.7 million at a CAGR of 6.9% between 2023 and 2028.
- The market is experiencing significant growth due to various driving factors. One of the primary drivers is the increasing demand for real-time monitoring in industries such as water and wastewater treatment, where VOCs pose health risks and negatively impact indoor air quality. Photoionization Detectors (PID) and Metal-Oxide Semiconductor (MOS) sensors are commonly used for VOC detection. Infrared sensors are another technology gaining popularity due to their ability to detect a wide range of VOCs. Moreover, the rise in LNG trade and price volatility in the oil and gas industry have led to an increased focus on VOC monitoring to ensure safety and compliance. The health risks associated with VOCs, particularly in indoor environments, have also raised awareness and concern among consumers and regulatory bodies. As a result, the market is expected to continue its growth trajectory in the coming years. In summary, the VOC gas sensor market is witnessing growth due to the increasing demand for real-time monitoring in various industries, the health risks associated with VOCs, and the regulatory requirements for indoor air quality.
What will be the Size of the Market During the Forecast Period?
- The market is witnessing significant traction due to the increasing awareness of indoor and outdoor air quality. VOCs are harmful gases emitted from various sources, including industrial processes, building materials, and consumer products. These gases can pose health risks and contribute to air pollution. Sensor technology plays a crucial role in detecting and monitoring VOCs. Technologies such as Photoionization Detectors (PID), Metal-Oxide Semiconductors (MOS), and Infrared Sensors are widely used in VOC gas sensing. PID sensors use ultraviolet light to ionize VOCs, while MOS sensors rely on the oxidation of VOCs to change their electrical conductivity. Infrared sensors detect VOCs based on their infrared radiation. Industrial safety and emissions monitoring are the primary applications of VOC gas sensors.
- Furthermore, the demand for these sensors is driven by stringent regulations and growing concerns over health and environmental risks. The integration of VOC gas sensors with smart technologies, such as the Internet of Things (IoT), is enabling real-time monitoring and predictive maintenance. Indoor air monitoring is another growing application area for VOC gas sensors. Harmful VOCs can accumulate indoors due to inadequate ventilation, leading to health issues. Sensing technology, such as infrared detection, is used to monitor indoor air quality and maintain optimal levels. Smart cities are also adopting VOC gas sensors for outdoor air quality monitoring. These sensors help in detecting and mitigating air pollution caused by industrial emissions and vehicular traffic.
How is this market segmented and which is the largest segment?
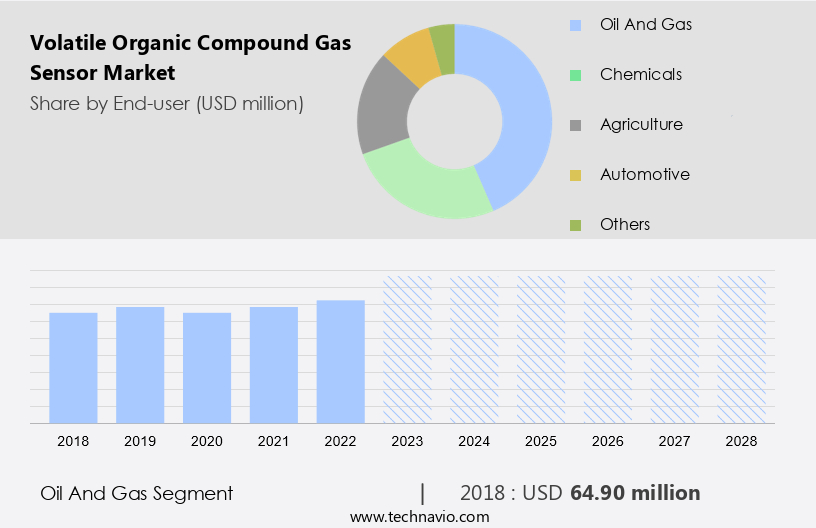
The market research report provides comprehensive data (region-wise segment analysis), with forecasts and estimates in "USD million" for the period 2024-2028, as well as historical data from 2018-2022 for the following segments.
- End-user
- Oil and gas
- Chemicals
- Agriculture
- Automotive
- Others
- Geography
- North America
- Canada
- Mexico
- US
- Europe
- Germany
- UK
- France
- APAC
- China
- India
- Japan
- South Korea
- Middle East and Africa
- South America
- North America
By End-user Insights
- The oil and gas segment is estimated to witness significant growth during the forecast period.
The volatile organic compound (VOC) gas sensor market is experiencing significant growth in 2023, particularly in the oil and gas industry. VOC sensors play a vital role in this sector for emissions control, safety measures, and process optimization. Upstream operations, including drilling platforms, midstream processes such as pipelines and tanker vessels, and downstream activities like refining and storage facilities all rely on VOC sensors. The increasing energy demand and regulatory requirements to monitor and regulate VOC emissions are fueling the adoption of these sensors. VOC gas sensors are essential for detecting leaks and maintaining safety in potentially hazardous environments, preventing accidents and environmental contamination.
Furthermore, photoionization Detectors (PID) and Metal-Oxide Semiconductor (MOS) sensors are commonly used technologies for VOC gas sensing. Infrared sensors are also gaining popularity for real-time monitoring applications. The health risks associated with VOCs and the importance of maintaining good indoor air quality further increase the demand for these sensors. VOC sensors are crucial for ensuring regulatory compliance and maintaining a safe and healthy working environment. As the oil and gas industry continues to expand, the demand for VOC gas sensors is expected to grow. Companies specializing in VOC gas sensors, such as Honeywell, Thermo Fisher Scientific, and ABB, are well-positioned to capitalize on this trend.
Get a glance at the market report of share of various segments Request Free Sample
The oil and gas segment was valued at USD 64.90 million in 2018 and showed a gradual increase during the forecast period.
Regional Analysis
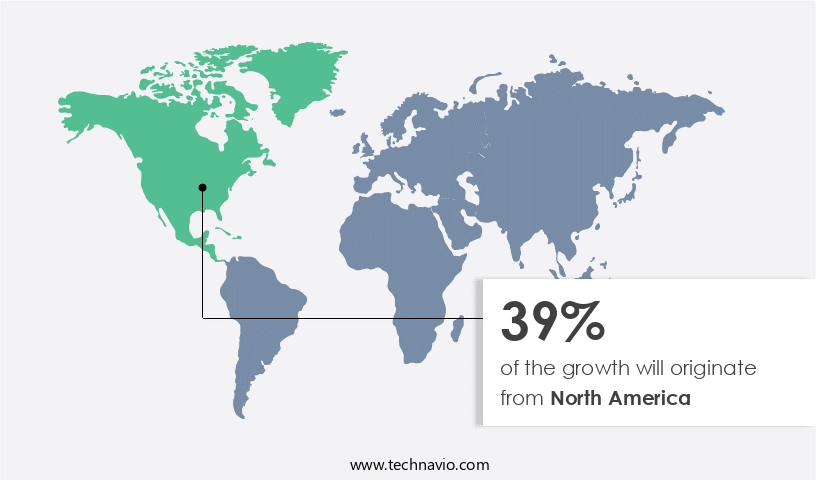
- North America is estimated to contribute 39% to the growth of the global market during the forecast period.
Technavio's analysts have elaborately explained the regional trends and drivers that shape the market during the forecast period.
For more insights on the market share of various regions Request Free Sample
In the United States, the implementation of stringent regulations by regional governments necessitates optimal performance from utility companies providing essential services such as water, sewage, electricity, dams, and natural gas. These utilities form the foundation of modern civilization, and their uninterrupted operation is crucial for societal functioning beyond financial aspects. Consequently, ensuring workplace safety is of paramount importance, creating a significant market potential for manufacturers of Volatile Organic Compound (VOC) gas sensors. Advancements in technology are driving the development of cost-effective retrofits, including air management systems, integrated sensors, and cloud-connected control systems. These innovations aim to minimize emissions, particularly in industries such as Oil and Gas, Food and Beverages, Air Quality Monitoring, and Environmental Monitoring.
Furthermore, the integration of smart sensing technology, such as Infrared Detection Technology and Nanostructured Sensing Materials, further enhances the efficiency and accuracy of VOC gas sensors. These advancements are expected to boost market growth in the coming years. VOC gas sensors play a vital role in maintaining a clean and healthy environment by continuously monitoring air quality and identifying potential hazards. By providing real-time data, these sensors enable prompt action to be taken, ensuring the safety and well-being of workers and the public. As the demand for cleaner air and stricter environmental regulations continues to grow, the market for VOC gas sensors is poised for substantial expansion.
Market Dynamics
Our researchers analyzed the data with 2023 as the base year, along with the key drivers, trends, and challenges. A holistic analysis of drivers will help companies refine their marketing strategies to gain a competitive advantage.
What are the key market drivers leading to the rise in adoption of Volatile Organic Compound Gas Sensor Market?
The burgeoning water and wastewater treatment industry is the key driver of the market.
-
The market plays a crucial role in addressing the challenges posed by air pollution, both indoors and outdoors. VOCs are emitted from various sources, including industrial processes, transportation, and household products. These compounds can cause health issues and act as disease biomarkers. Therefore, the demand for VOC gas sensors is increasing for applications in air monitoring and leak detection devices. The Environmental Protection Agency (EPA) and the Food and Agriculture Organization (FAO) have established regulations to limit the emission levels of VOCs into the environment. Industries such as chemicals, pesticides, rare metals, and petroleum contribute significantly to VOC emissions. Chloroform and other disinfection by-products from water treatment, as well as components of petroleum fuels, hydraulic fluids, paint thinners, and dry-cleaning agents, are major contributors.
-
Furthermore, to ensure compliance with these regulations, industries, and consumers are investing in VOC gas sensors for continuous monitoring of indoor and outdoor air quality. These sensors enable early detection and prevention of potential health hazards and environmental damage. As the importance of maintaining good indoor and outdoor air quality continues to grow, the VOC Gas Sensor Market is expected to expand significantly. To mitigate the adverse effects of VOCs on human health and the environment, regulatory bodies like the US EPA and FAO have set emission limits. Industries such as chemicals, pesticides, rare metals, and petroleum contribute significantly to VOC emissions through their processes. Chloroform and other disinfection by-products from water treatment, as well as components of petroleum fuels, hydraululic fluids, paint thinners, and dry-cleaning agents, are major contributors.
What are the market trends shaping the Volatile Organic Compound Gas Sensor Market?
An increase in LNG trade is the upcoming trend in the market.
-
The market is experiencing significant growth due to the increasing emphasis on air quality and emissions monitoring across various industries. This market is driven by the need for industrial safety and the implementation of advanced sensor technology, including smart technologies and the Internet of Things (IoT). VOC gas sensors play a crucial role in ensuring clean air and reducing harmful emissions, making them essential for industries such as manufacturing, healthcare, and automotive. As these industries continue to evolve, the demand for VOC gas sensors is expected to increase.
Furthermore, with the growing focus on environmental sustainability and regulatory compliance, the use of VOC gas sensors is becoming increasingly important for businesses to maintain a good reputation and avoid potential legal issues. The integration of VOC gas sensors into IoT systems allows for real-time monitoring and analysis of air quality data, providing valuable insights for businesses to optimize their operations and improve overall efficiency. Thus, such trends will shape the growth of the market during the forecast period.
What challenges does Volatile Organic Compound Gas Sensor Market face during its growth?
Price volatility in oil and gas industry is a key challenge affecting the market growth.
- The market witnesses substantial application across various industries, including chemical, industrial, medical, water treatment, and wastewater treatment. In the chemical industry, VOC sensors are utilized for detecting and measuring the concentration of VOCs in air and water. In industrial settings, these sensors play a crucial role in monitoring the emission of VOCs during manufacturing processes to ensure compliance with environmental regulations. In the medical sector, VOC sensors are employed in the detection of pathogens and sewage treatment plants for monitoring the efficacy of treatment processes. Despite the market's growth potential, the VOC gas sensor industry faces challenges due to the volatility of crude oil prices.
- The oil and gas industry is a significant consumer of VOC sensors, particularly in the upstream, midstream, and downstream sectors. The industry's growth has been impacted by the recent price volatility, with crude oil prices experiencing significant fluctuations due to economic contractions, supply level changes, and geopolitical tensions. However, despite these challenges, the global oil demand is projected to reach record highs, driven by resilient demand in regions like China.
Exclusive Customer Landscape
The market forecasting report includes the adoption lifecycle of the market, covering from the innovator's stage to the laggard's stage. It focuses on adoption rates in different regions based on penetration. Furthermore, the market report also includes key purchase criteria and drivers of price sensitivity to help companies evaluate and develop their market growth analysis strategies.

Customer Landscape
Key Companies & Market Insights
Companies are implementing various strategies, such as strategic alliances, market forecast, partnerships, mergers and acquisitions, geographical expansion, and product/service launches, to enhance their presence in the market.
The market research and growth report includes detailed analyses of the competitive landscape of the market and information about key companies, including:
- Aeroqual Ltd.
- Amphenol Corp.
- ams OSRAM AG
- Chongqing Gearbox Co. Ltd.
- Dragerwerk AG and Co. KGaA
- Dynament Ltd.
- Figaro Engineering Inc.
- GfG Ltd.
- Global Detection Systems Corp.
- Honeywell International Inc.
- Ion Science Ltd.
- KWJ Engineering Inc.
- MEMBRAPOR AG
- Nemoto Sensor Engineering Co. Ltd.
- NGK Insulators Ltd
- Renesas Electronics Corp.
- Robert Bosch GmbH
- Siemens AG
- Trolex Ltd.
- Yokogawa Electric Corp.
Qualitative and quantitative analysis of companies has been conducted to help clients understand the wider business environment as well as the strengths and weaknesses of key market players. Data is qualitatively analyzed to categorize companies as pure play, category-focused, industry-focused, and diversified; it is quantitatively analyzed to categorize companies as dominant, leading, strong, tentative, and weak.
Research Analyst Overview
- The market is witnessing significant growth due to the increasing demand for air quality monitoring in various industries and applications. VOCs are harmful gases emitted from a wide range of sources, including industrial processes, emissions from vehicles, and indoor sources such as cleaning products and cooking. The need for real-time monitoring of VOC levels in industrial settings for safety and emission reduction purposes is driving the market. Advanced sensor solutions based on technologies such as Metal-Oxide Semiconductor (MOS) and Infrared Detection Technology are gaining popularity due to their high sensitivity and accuracy. Smart technologies such as the Internet of Things (IoT) and photoionization detectors are also being increasingly used for VOC sensing in industrial safety, emissions monitoring, and indoor air quality applications.
- The market is also witnessing growth in sectors such as oil and gas, food and beverages, and water treatment due to the need for VOC monitoring in these industries. Moreover, the growing awareness of health risks associated with indoor air quality and the increasing focus on smart cities are also contributing to the growth of the VOC gas sensor market. The market is expected to witness significant growth in the coming years due to the increasing demand for advanced sensor solutions for air pollution monitoring, emission levels measurement, and disease biomarker detection.
|
Market Scope |
|
|
Report Coverage |
Details |
|
Page number |
163 |
|
Base year |
2023 |
|
Historic period |
2018-2022 |
|
Forecast period |
2024-2028 |
|
Growth momentum & CAGR |
Accelerate at a CAGR of 6.9% |
|
Market Growth 2024-2028 |
USD 65.7 million |
|
Market structure |
Fragmented |
|
YoY growth 2023-2024(%) |
6.3 |
|
Key countries |
US, Germany, UK, China, France, Japan, Canada, Mexico, India, and South Korea |
|
Competitive landscape |
Leading Companies, Market Positioning of Companies, Competitive Strategies, and Industry Risks |
What are the Key Data Covered in this Market Research and Growth Report?
- CAGR of the market during the forecast period
- Detailed information on factors that will drive the market growth and forecasting between 2024 and 2028
- Precise estimation of the size of the market and its contribution of the market in focus to the parent market
- Accurate predictions about upcoming market growth and trends and changes in consumer behaviour
- Growth of the market across North America, Europe, APAC, Middle East and Africa, and South America
- Thorough analysis of the market's competitive landscape and detailed information about companies
- Comprehensive analysis of factors that will challenge the growth of market companies
We can help! Our analysts can customize this market research report to meet your requirements. Get in touch
 RIA -
RIA - 
