Aerospace Composite Market Analysis North America, Europe, APAC, South America, Middle East and Africa - US, China, Japan, Germany, France - Size and Forecast 2024-2028

Aerospace Composite Market Analysis North America, Europe, APAC, South America, Middle East and Africa - US, China, Japan, Germany, France - Size and Forecast 2024-2028

Published: Mar 2024 160 Pages SKU: IRTNTR77655

Market Overview at a Glance

$17.41 B
Market Opportunity
9.5%
CAGR
9.0
YoY growth 2023-2024(%)

Aerospace Composite Market Size 2024-2028

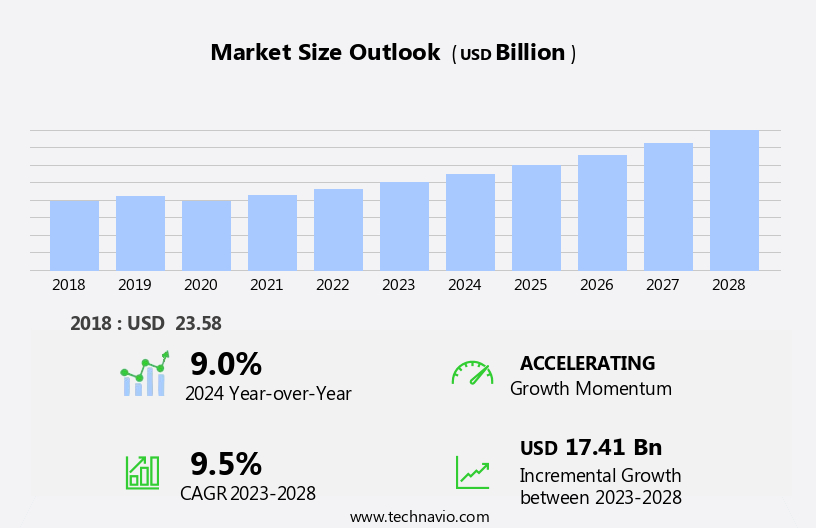
The aerospace composite market size is forecast to increase by USD 17.41 billion, at a CAGR of 9.5% between 2023 and 2028.

  • The market is driven by the increasing demand for weight reduction and fuel efficiency in aircraft. This trend is propelled by the growing focus on reducing carbon emissions and improving overall aircraft performance. Another key driver is the rising adoption of carbon fiber-reinforced plastic composites in aircraft components. These materials offer superior strength-to-weight ratio, making them an ideal choice for manufacturing lightweight and durable aircraft parts. However, the market faces challenges as well. Complexity issues related to repair and maintenance of composite materials pose a significant obstacle. The intricate nature of these materials makes it difficult to identify and address damages, leading to prolonged downtime and increased operational costs for airlines.
  • Companies seeking to capitalize on market opportunities must invest in developing innovative solutions for the repair and maintenance of composite materials. This will not only help them meet the growing demand for fuel-efficient and lightweight aircraft but also provide a competitive edge in the market.

What will be the Size of the Aerospace Composite Market during the forecast period?

Aerospace Composite Market Size

Explore in-depth regional segment analysis with market size data - historical 2018-2022 and forecasts 2024-2028 - in the full report.  
Request Free Sample

The market continues to evolve, driven by the relentless pursuit of performance enhancement and innovation in this dynamic industry. Vacuum bagging and high-modulus materials are essential tools in the production of aircraft fuselages, pushing the boundaries of corrosion resistance, fuel efficiency, and airworthiness certification. The integration of bio-based composites and smart composites adds a new dimension to this sector, with thermal stability and high-strength materials ensuring the longevity and reliability of components. In the realm of commercial aircraft, lightweight materials such as carbon fiber composites and epoxy resins are increasingly utilized, contributing to weight reduction and improved fuel efficiency.

Meanwhile, the aerospace supply chain benefits from design optimization and structural bonding, ensuring the efficient production of complex components. Satellite components, rotor blades, and aircraft wings are all reaping the benefits of advanced materials, with thermoset resins, thermoplastic resins, and aramid fiber composites playing crucial roles. The integration of resin transfer molding, filament winding, and layup techniques further enhances the versatility of these materials. The aerospace manufacturing landscape is characterized by rigorous testing, including mechanical testing, fatigue testing, and non-destructive testing, to ensure structural integrity and adherence to aerospace regulations. The ongoing development of recycling technologies and sustainability considerations underscores the industry's commitment to environmental responsibility.

Unmanned aerial vehicles, business jets, and aircraft tail sections are all part of the diverse applications of high-performance composites, pushing the boundaries of innovation and performance in the aerospace sector. The future of this market is marked by continuous evolution and the integration of new technologies and materials, ensuring its ongoing relevance and importance in the global economy.

How is this Aerospace Composite Industry segmented?

The aerospace composite industry research report provides comprehensive data (region-wise segment analysis), with forecasts and estimates in "USD billion" for the period 2024-2028, as well as historical data from 2018-2022 for the following segments.

  • Type
    • Exteriors
    • Interiors
  • Application
    • Commercial aircraft
    • Military aircraft
    • Business and general aviation
    • Civil helicopters
  • Fiber Type
    • Carbon Fiber
    • Glass Fiber
    • Aramid Fiber
    • Others
  • Manufacturing Process
    • ATL or AFP
    • Filament Winding
    • Resin Transfer Molding
    • Hand Layup
    • Others
  • Geography
    • North America
      • US
    • Europe
      • France
      • Germany
    • APAC
      • China
      • Japan
    • Rest of World (ROW). 

By Type Insights

The exteriors segment is estimated to witness significant growth during the forecast period.

Composites are a crucial element in enhancing the exterior structures of aircraft, leading to increased efficiency, performance, and durability. Carbon fiber-reinforced composites, with their high strength-to-weight ratio, are extensively utilized in fuselages, such as Boeing's 787 Dreamliner. These advanced composite materials significantly reduce overall aircraft weight, contributing to improved fuel efficiency. Composites also find extensive applications in wings and wing components, like Airbus' A350 XWB, which boasts a substantial percentage of composite materials. This application ensures the necessary structural strength while maintaining lightweight wings. Moreover, composites are frequently employed in aircraft tail sections, including horizontal and vertical stabilizers, due to their structural benefits, contributing to enhanced overall performance and fuel efficiency.

Additionally, composites are utilized in various other aerospace components, such as rotor blades, satellite components, and aircraft repair, among others. Innovations in composites include high-modulus materials, self-healing composites, smart composites, and recycling technologies, which further expand their applications in the aerospace industry. The aerospace supply chain relies on design optimization, structural bonding, and non-destructive testing to ensure the highest standards of airworthiness certification. Composites undergo rigorous mechanical testing, including fatigue testing, impact testing, and environmental testing, to maintain structural integrity. The aerospace manufacturing process incorporates advanced techniques like resin transfer molding, autoclave processing, filament winding, and 3D printing to create high-performance composites.

The use of composites in commercial and military aircraft, business jets, and unmanned aerial vehicles continues to evolve, with a focus on sustainability considerations and weight reduction.

Aerospace Composite Market Size

Request Free Sample

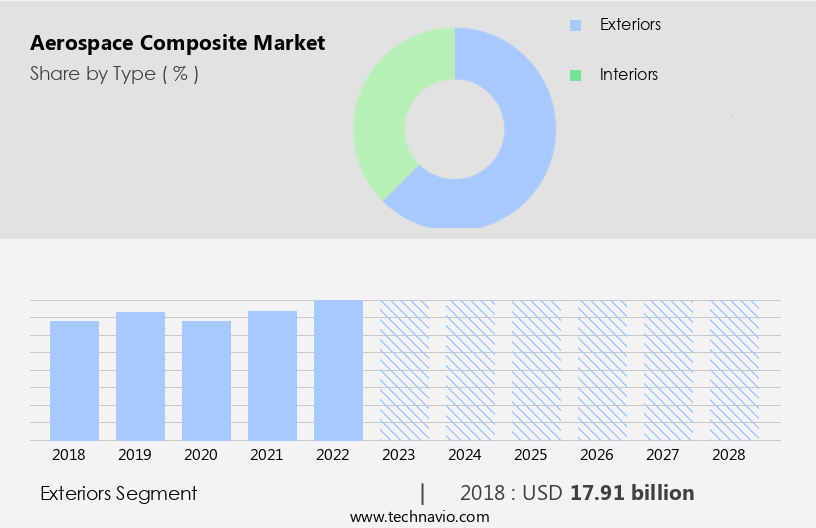
The Exteriors segment was valued at USD 17.91 billion in 2018 and showed a gradual increase during the forecast period.

Regional Analysis

North America is estimated to contribute 37% to the growth of the global market during the forecast period.Technavio's analysts have elaborately explained the regional trends and drivers that shape the market during the forecast period.

Aerospace Composite Market Share by Geography

 Request Free Sample

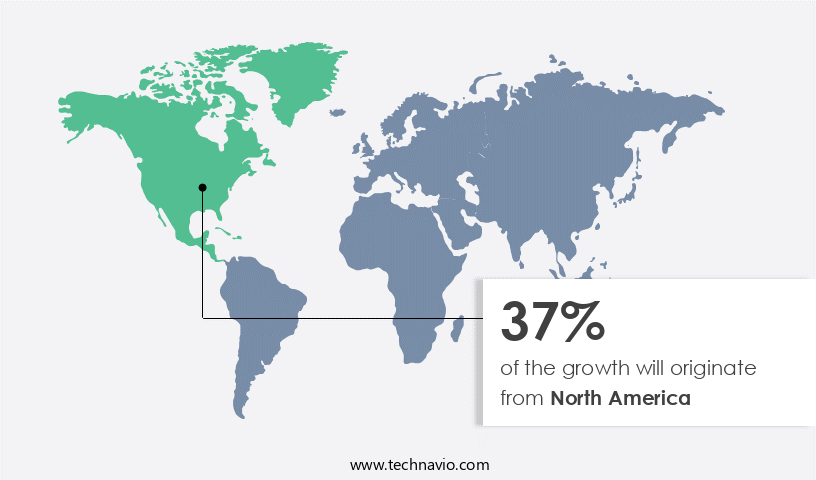
The market is driven by the widespread adoption of composite materials in the production of aircraft and spacecraft components. North America, specifically the US and Canada, lead this market due to the emphasis on lightweight, high-strength composites for improved fuel efficiency and performance in aviation. Key players in the region, such as Boeing and Lockheed Martin, are major consumers of composite materials, with Boeing's B787 Dreamliner being a prime example. This aircraft utilizes extensive composite usage, contributing to its structural integrity, thermal stability, and reduced weight. The aerospace industry in North America is at the forefront of technological innovation, with advancements in high-modulus materials, prepreg technologies, and vacuum bagging techniques.

Additionally, the use of smart composites, self-healing materials, and recycling technologies is gaining traction. The market also encompasses the manufacturing of satellite components, rotor blades for helicopters and wind turbines, and aircraft tail sections. Aerospace regulations mandate rigorous testing for airworthiness certification, including fatigue testing, impact testing, and environmental testing, to ensure structural integrity. Innovation in composites continues through processes like resin transfer molding, compression molding, filament winding, and 3D printing. The integration of bio-based composites and thermoplastic resins further expands the market's scope. Sustainability considerations are increasingly important, with a focus on reducing weight and optimizing design for fuel efficiency.

Market Dynamics

Our researchers analyzed the data with 2023 as the base year, along with the key drivers, trends, and challenges. A holistic analysis of drivers will help companies refine their marketing strategies to gain a competitive advantage.

What are the key market drivers leading to the rise in the adoption of Aerospace Composite Industry?

  • The escalating need for weight reduction and enhanced fuel efficiency in the aviation industry serves as the primary market driver. 
  • The market is experiencing significant growth due to the increasing demand for lighter and more fuel-efficient aircraft. This trend is driven by the need to comply with environmental regulations and reduce the environmental impact of air travel. Aerospace composites, such as glass fiber and aramid fiber composites, offer superior strength-to-weight ratios, making them ideal for manufacturing lighter aircraft components while maintaining structural integrity. Performance enhancement is a key focus area, with composite materials being used in the production of aircraft fuselages, rotor blades, and other critical components. Mechanical testing and life cycle analysis are essential in ensuring the durability and airworthiness certification of these components.
  • Prepreg materials are widely used in the production of aerospace composites due to their consistency and ease of use. Additionally, composite repair technologies are gaining popularity for their ability to extend the life of existing aircraft components and reduce the need for costly replacements. Overall, the market is expected to continue growing as manufacturers seek to improve the fuel efficiency and sustainability of their aircraft offerings.

What are the market trends shaping the Aerospace Composite Industry?

  • The use of carbon fiber-reinforced plastic composites in aircraft components is a significant market trend, gaining increasing adoption due to their lightweight and high-strength properties. This material's growing popularity is expected to drive market growth in the aerospace industry.
  • The market is experiencing significant growth due to the increasing adoption of carbon fiber-reinforced polymer (CFRP) composites in aircraft manufacturing. CFRP composites offer superior thermal stability and high strength, making them an ideal choice for producing lightweight and durable components for commercial aircraft. These composites provide design flexibility, enabling the creation of complex and aerodynamic structures that optimize component efficiency and performance. Moreover, the use of CFRP composites contributes to weight reduction, which is a critical factor in reducing fuel consumption and emissions. This aligns with the aviation industry's focus on environmental sustainability.
  • Additionally, the development of advanced materials such as high-modulus fibers, smart composites, and bio-based composites is further driving market growth. These materials offer enhanced properties, such as self-healing capabilities and improved thermal stability, making them suitable for use in satellite components and other aerospace applications. Structural bonding and vacuum bagging techniques are also gaining popularity in the aerospace supply chain, as they enable the production of high-quality, strong bonds between composite materials. The use of these techniques facilitates the production of complex components with intricate geometries and high-performance requirements. Overall, the market is expected to continue growing due to the increasing demand for lightweight, high-performance materials in the aviation industry.

What challenges does the Aerospace Composite Industry face during its growth?

  • The growth of the industry is impeded by the intricate complexities surrounding the repair and maintenance of composite materials. These challenges, which are of significant concern to professionals, necessitate ongoing research and innovation to ensure efficient and effective solutions are implemented. 
  • The market faces complexities in repair and maintenance due to the intricate structure of composite materials, such as carbon fiber composites and epoxy resins, used in aerospace manufacturing for high-performance applications. These materials offer advantages like high strength-to-weight ratios and corrosion resistance, but their non-destructive testing poses challenges. Unlike metals, composites can conceal internal damage, including delamination and cracks, which may go undetected without advanced inspection techniques like ultrasonic or thermographic methods. This complicates the maintenance process in the aerospace industry.
  • Aerospace regulations mandate strict structural integrity for aircraft wings and spacecraft structures, necessitating rigorous fatigue testing and environmental testing to ensure safety. Hybrid composites, which combine the benefits of multiple materials, are gaining popularity to address these challenges. Innovation in composites continues to drive advancements in the industry, with ongoing research focused on improving inspection techniques and developing more durable and sustainable materials.

Exclusive Customer Landscape

The aerospace composite market forecasting report includes the adoption lifecycle of the market, covering from the innovator's stage to the laggard's stage. It focuses on adoption rates in different regions based on penetration. Furthermore, the aerospace composite market report also includes key purchase criteria and drivers of price sensitivity to help companies evaluate and develop their market growth analysis strategies.

Aerospace Composite Market Share by Geography

 Customer Landscape

Key Companies & Market Insights

Companies are implementing various strategies, such as strategic alliances, aerospace composite market forecast, partnerships, mergers and acquisitions, geographical expansion, and product/service launches, to enhance their presence in the industry.

Albany International Corp. - The company specializes in the production of advanced aerospace composite materials. Our product portfolio encompasses Composite Cans and Tubes, Fan Blade Platforms, Fan Blades, Fan Cases, Fuselage Frames, Waste Tanks, Airstrut, and Hydraulic Pressure Accumulators. These components cater to the aviation industry's demanding requirements for lightweight, durable, and high-performance solutions. Our commitment to innovation drives US to continually refine and improve our offerings, enhancing their functionality and contributing to the overall efficiency of aircraft designs.

The industry research and growth report includes detailed analyses of the competitive landscape of the market and information about key companies, including:

  • Albany International Corp.
  • Bally Ribbon Mills
  • General Electric Co.
  • Hexcel Corp.
  • Kineco Kaman Composites
  • Lee Aerospace Inc.
  • Materion Corp.
  • Mitsubishi Chemical Group Corp.
  • Owens Corning
  • Plastic Reinforcement Fabrics Ltd.
  • Renegade Materials Corp.
  • Rolls Royce Holdings Plc
  • SGL Carbon SE
  • Sunshield Chemicals Ltd.
  • Spirit AeroSystems Inc.
  • Teijin Ltd.
  • Toray TCAC Holding B.V.
  • Victrex Plc

Qualitative and quantitative analysis of companies has been conducted to help clients understand the wider business environment as well as the strengths and weaknesses of key industry players. Data is qualitatively analyzed to categorize companies as pure play, category-focused, industry-focused, and diversified; it is quantitatively analyzed to categorize companies as dominant, leading, strong, tentative, and weak.

Recent Development and News in Aerospace Composite Market

  • In February 2024, Boeing and Hexcel Corporation announced a significant collaboration to increase the production capacity of composite materials for Boeing's 787 Dreamliner aircraft. This strategic partnership aimed to enhance Boeing's supply chain resilience and meet the growing demand for composite materials in the aerospace industry (Boeing Press Release, 2024).
  • In May 2024, Airbus and Safran announced the successful first flight of their new-generation regional jet, the A220, featuring advanced composite materials in its fuselage and wings. This technological advancement reduced the aircraft's weight, improved fuel efficiency, and increased passenger comfort (Airbus Press Release, 2024).
  • In August 2024, Teijin Limited, a leading Japanese composite materials manufacturer, announced a strategic investment of USD100 million in its US subsidiary, Teijin Carbon Fibers, Inc. This investment aimed to expand the company's carbon fiber production capacity and strengthen its position in the North American the market (Teijin Limited Press Release, 2024).

Research Analyst Overview

  • The market experiences continuous evolution, driven by stringent safety regulations and the pursuit of lighter, stronger, and more sustainable materials. Quality control plays a crucial role in ensuring consistency and reliability in manufacturing processes, while environmental impact and sustainability assessment are increasingly important considerations. Maintenance procedures, including vibration analysis and life cycle management, are essential for optimizing fleet performance and reducing downtime. Failure analysis and damage tolerance are critical for understanding the root causes of composite part failures and designing safer, more robust structures. Safety regulations mandate rigorous testing and certification, driving the adoption of advanced simulation tools, manufacturing automation, and joining technologies.
  • Carbon footprint reduction is a key focus, with industry standards promoting the use of circular economy principles, fatigue life prediction, and production efficiency. Manufacturing cost optimization is achieved through process automation, material characterization, and the implementation of industry-standard stress analysis and composite design software. Surface finishing, acoustic analysis, and thermal analysis are essential for optimizing composite part performance and reducing noise and heat emissions. Fastening systems and joining technologies are continually evolving to meet the demands of high-performance aerospace applications, while sustainability initiatives are driving the development of new, eco-friendly manufacturing methods. Overall, the market is characterized by dynamic innovation and a relentless focus on safety, efficiency, and sustainability.

Dive into Technavio's robust research methodology, blending expert interviews, extensive data synthesis, and validated models for unparalleled Aerospace Composite Market insights. See full methodology.

Market Scope

Report Coverage

Details

Page number

160

Base year

2023

Historic period

2018-2022

Forecast period

2024-2028

Growth momentum & CAGR

Accelerate at a CAGR of 9.5%

Market growth 2024-2028

USD 17.41 billion

Market structure

Fragmented

YoY growth 2023-2024(%)

9.0

Key countries

US, China, Japan, Germany, and France

Competitive landscape

Leading Companies, Market Positioning of Companies, Competitive Strategies, and Industry Risks

Request Free Sample

What are the Key Data Covered in this Aerospace Composite Market Research and Growth Report?

  • CAGR of the Aerospace Composite industry during the forecast period
  • Detailed information on factors that will drive the growth and forecasting between 2024 and 2028
  • Precise estimation of the size of the market and its contribution of the industry in focus to the parent market
  • Accurate predictions about upcoming growth and trends and changes in consumer behaviour
  • Growth of the market across North America, Europe, APAC, South America, and Middle East and Africa
  • Thorough analysis of the market's competitive landscape and detailed information about companies
  • Comprehensive analysis of factors that will challenge the aerospace composite market growth of industry companies

We can help! Our analysts can customize this aerospace composite market research report to meet your requirements.

Get in touch

1 Executive Summary

  • 1.1 Market overview
    • Exhibit 01: Executive Summary – Chart on Market Overview
    • Exhibit 02: Executive Summary – Data Table on Market Overview
    • Exhibit 03: Executive Summary – Chart on Global Market Characteristics
    • Exhibit 04: Executive Summary – Chart on Market by Geography
    • Exhibit 05: Executive Summary – Chart on Market Segmentation by Type
    • Exhibit 06: Executive Summary – Chart on Market Segmentation by Application
    • Exhibit 07: Executive Summary – Chart on Incremental Growth
    • Exhibit 08: Executive Summary – Data Table on Incremental Growth
    • Exhibit 09: Executive Summary – Chart on Vendor Market Positioning

2 Market Landscape

  • 2.1 Market ecosystem
    • Exhibit 10: Parent market
    • Exhibit 11: Market Characteristics

3 Market Sizing

  • 3.1 Market definition
    • Exhibit 12: Offerings of vendors included in the market definition
  • 3.2 Market segment analysis
    • Exhibit 13: Market segments
  • 3.3 Market size 2023
    • 3.4 Market outlook: Forecast for 2023-2028
      • Exhibit 14: Chart on Global - Market size and forecast 2023-2028 ($ million)
      • Exhibit 15: Data Table on Global - Market size and forecast 2023-2028 ($ million)
      • Exhibit 16: Chart on Global Market: Year-over-year growth 2023-2028 (%)
      • Exhibit 17: Data Table on Global Market: Year-over-year growth 2023-2028 (%)

    4 Historic Market Size

    • 4.1 Global aerospace composites market 2018 - 2022
      • Exhibit 18: Historic Market Size – Data Table on global aerospace composites market 2018 - 2022 ($ million)
    • 4.2 Type Segment Analysis 2018 - 2022
      • Exhibit 19: Historic Market Size – Type Segment 2018 - 2022 ($ million)
    • 4.3 Application Segment Analysis 2018 - 2022
      • Exhibit 20: Historic Market Size – Application Segment 2018 - 2022 ($ million)
    • 4.4 Geography Segment Analysis 2018 - 2022
      • Exhibit 21: Historic Market Size – Geography Segment 2018 - 2022 ($ million)
    • 4.5 Country Segment Analysis 2018 - 2022
      • Exhibit 22: Historic Market Size – Country Segment 2018 - 2022 ($ million)

    5 Five Forces Analysis

    • 5.1 Five forces summary
      • Exhibit 23: Five forces analysis - Comparison between 2023 and 2028
    • 5.2 Bargaining power of buyers
      • Exhibit 24: Chart on Bargaining power of buyers – Impact of key factors 2023 and 2028
    • 5.3 Bargaining power of suppliers
      • Exhibit 25: Bargaining power of suppliers – Impact of key factors in 2023 and 2028
    • 5.4 Threat of new entrants
      • Exhibit 26: Threat of new entrants – Impact of key factors in 2023 and 2028
    • 5.5 Threat of substitutes
      • Exhibit 27: Threat of substitutes – Impact of key factors in 2023 and 2028
    • 5.6 Threat of rivalry
      • Exhibit 28: Threat of rivalry – Impact of key factors in 2023 and 2028
    • 5.7 Market condition
      • Exhibit 29: Chart on Market condition - Five forces 2023 and 2028

    6 Market Segmentation by Type

    • 6.1 Market segments
      • Exhibit 30: Chart on Type - Market share 2023-2028 (%)
      • Exhibit 31: Data Table on Type - Market share 2023-2028 (%)
    • 6.2 Comparison by Type
      • Exhibit 32: Chart on Comparison by Type
      • Exhibit 33: Data Table on Comparison by Type
    • 6.3 Exteriors - Market size and forecast 2023-2028
      • Exhibit 34: Chart on Exteriors - Market size and forecast 2023-2028 ($ million)
      • Exhibit 35: Data Table on Exteriors - Market size and forecast 2023-2028 ($ million)
      • Exhibit 36: Chart on Exteriors - Year-over-year growth 2023-2028 (%)
      • Exhibit 37: Data Table on Exteriors - Year-over-year growth 2023-2028 (%)
    • 6.4 Interiors - Market size and forecast 2023-2028
      • Exhibit 38: Chart on Interiors - Market size and forecast 2023-2028 ($ million)
      • Exhibit 39: Data Table on Interiors - Market size and forecast 2023-2028 ($ million)
      • Exhibit 40: Chart on Interiors - Year-over-year growth 2023-2028 (%)
      • Exhibit 41: Data Table on Interiors - Year-over-year growth 2023-2028 (%)
    • 6.5 Market opportunity by Type
      • Exhibit 42: Market opportunity by Type ($ million)
      • Exhibit 43: Data Table on Market opportunity by Type ($ million)

    7 Market Segmentation by Application

    • 7.1 Market segments
      • Exhibit 44: Chart on Application - Market share 2023-2028 (%)
      • Exhibit 45: Data Table on Application - Market share 2023-2028 (%)
    • 7.2 Comparison by Application
      • Exhibit 46: Chart on Comparison by Application
      • Exhibit 47: Data Table on Comparison by Application
    • 7.3 Commercial aircraft - Market size and forecast 2023-2028
      • Exhibit 48: Chart on Commercial aircraft - Market size and forecast 2023-2028 ($ million)
      • Exhibit 49: Data Table on Commercial aircraft - Market size and forecast 2023-2028 ($ million)
      • Exhibit 50: Chart on Commercial aircraft - Year-over-year growth 2023-2028 (%)
      • Exhibit 51: Data Table on Commercial aircraft - Year-over-year growth 2023-2028 (%)
    • 7.4 Military aircraft - Market size and forecast 2023-2028
      • Exhibit 52: Chart on Military aircraft - Market size and forecast 2023-2028 ($ million)
      • Exhibit 53: Data Table on Military aircraft - Market size and forecast 2023-2028 ($ million)
      • Exhibit 54: Chart on Military aircraft - Year-over-year growth 2023-2028 (%)
      • Exhibit 55: Data Table on Military aircraft - Year-over-year growth 2023-2028 (%)
    • 7.5 Business and general aviation - Market size and forecast 2023-2028
      • Exhibit 56: Chart on Business and general aviation - Market size and forecast 2023-2028 ($ million)
      • Exhibit 57: Data Table on Business and general aviation - Market size and forecast 2023-2028 ($ million)
      • Exhibit 58: Chart on Business and general aviation - Year-over-year growth 2023-2028 (%)
      • Exhibit 59: Data Table on Business and general aviation - Year-over-year growth 2023-2028 (%)
    • 7.6 Civil helicopters - Market size and forecast 2023-2028
      • Exhibit 60: Chart on Civil helicopters - Market size and forecast 2023-2028 ($ million)
      • Exhibit 61: Data Table on Civil helicopters - Market size and forecast 2023-2028 ($ million)
      • Exhibit 62: Chart on Civil helicopters - Year-over-year growth 2023-2028 (%)
      • Exhibit 63: Data Table on Civil helicopters - Year-over-year growth 2023-2028 (%)
    • 7.7 Market opportunity by Application
      • Exhibit 64: Market opportunity by Application ($ million)
      • Exhibit 65: Data Table on Market opportunity by Application ($ million)

    8 Market Segmentation by Fiber Type

    • 8.1 Market segments
      • Chart on Fiber Type - Market share (2023-2028) (%)
      • Data Table on Fiber Type - Market share (2023-2028) (%)
    • 8.2 Comparison by Fiber Type
      • Chart on Comparison by Fiber Type
      • Data Table on Comparison by Fiber Type
    • 8.3 Carbon Fiber - Market size and forecast (2023-2028)
      • Chart on Carbon Fiber - Market size and forecast (2023-2028) ($ million)
      • Data Table on Carbon Fiber - Market size and forecast (2023-2028) ($ million)
      • Chart on Carbon Fiber - Year-over-year growth (2023-2028) (%)
      • Data Table on Carbon Fiber - Year-over-year growth (2023-2028) (%)
    • 8.4 Glass Fiber - Market size and forecast (2023-2028)
      • Chart on Glass Fiber - Market size and forecast (2023-2028) ($ million)
      • Data Table on Glass Fiber - Market size and forecast (2023-2028) ($ million)
      • Chart on Glass Fiber - Year-over-year growth (2023-2028) (%)
      • Data Table on Glass Fiber - Year-over-year growth (2023-2028) (%)
    • 8.5 Aramid Fiber - Market size and forecast (2023-2028)
      • Chart on Aramid Fiber - Market size and forecast (2023-2028) ($ million)
      • Data Table on Aramid Fiber - Market size and forecast (2023-2028) ($ million)
      • Chart on Aramid Fiber - Year-over-year growth (2023-2028) (%)
      • Data Table on Aramid Fiber - Year-over-year growth (2023-2028) (%)
    • 8.6 Others - Market size and forecast (2023-2028)
      • Chart on Others - Market size and forecast (2023-2028) ($ million)
      • Data Table on Others - Market size and forecast (2023-2028) ($ million)
      • Chart on Others - Year-over-year growth (2023-2028) (%)
      • Data Table on Others - Year-over-year growth (2023-2028) (%)
    • 8.7 Market opportunity by Fiber Type
      • Market opportunity by $segment_name ($ million)
      • Data Table on Market opportunity by $segment_name ($ million)

    9 Market Segmentation by Manufacturing Process

    • 9.1 Market segments
      • Chart on Manufacturing Process - Market share (2023-2028) (%)
      • Data Table on Manufacturing Process - Market share (2023-2028) (%)
    • 9.2 Comparison by Manufacturing Process
      • Chart on Comparison by Manufacturing Process
      • Data Table on Comparison by Manufacturing Process
    • 9.3 ATL or AFP - Market size and forecast (2023-2028)
      • Chart on ATL or AFP - Market size and forecast (2023-2028) ($ million)
      • Data Table on ATL or AFP - Market size and forecast (2023-2028) ($ million)
      • Chart on ATL or AFP - Year-over-year growth (2023-2028) (%)
      • Data Table on ATL or AFP - Year-over-year growth (2023-2028) (%)
    • 9.4 Filament Winding - Market size and forecast (2023-2028)
      • Chart on Filament Winding - Market size and forecast (2023-2028) ($ million)
      • Data Table on Filament Winding - Market size and forecast (2023-2028) ($ million)
      • Chart on Filament Winding - Year-over-year growth (2023-2028) (%)
      • Data Table on Filament Winding - Year-over-year growth (2023-2028) (%)
    • 9.5 Resin Transfer Molding - Market size and forecast (2023-2028)
      • Chart on Resin Transfer Molding - Market size and forecast (2023-2028) ($ million)
      • Data Table on Resin Transfer Molding - Market size and forecast (2023-2028) ($ million)
      • Chart on Resin Transfer Molding - Year-over-year growth (2023-2028) (%)
      • Data Table on Resin Transfer Molding - Year-over-year growth (2023-2028) (%)
    • 9.6 Hand Layup - Market size and forecast (2023-2028)
      • Chart on Hand Layup - Market size and forecast (2023-2028) ($ million)
      • Data Table on Hand Layup - Market size and forecast (2023-2028) ($ million)
      • Chart on Hand Layup - Year-over-year growth (2023-2028) (%)
      • Data Table on Hand Layup - Year-over-year growth (2023-2028) (%)
    • 9.7 Others - Market size and forecast (2023-2028)
      • Chart on Others - Market size and forecast (2023-2028) ($ million)
      • Data Table on Others - Market size and forecast (2023-2028) ($ million)
      • Chart on Others - Year-over-year growth (2023-2028) (%)
      • Data Table on Others - Year-over-year growth (2023-2028) (%)
    • 9.8 Market opportunity by Manufacturing Process
      • Market opportunity by $segment_name ($ million)
      • Data Table on Market opportunity by $segment_name ($ million)

    8 Customer Landscape

    • 8.1 Customer landscape overview
      • Exhibit 66: Analysis of price sensitivity, lifecycle, customer purchase basket, adoption rates, and purchase criteria

    9 Geographic Landscape

    • 9.1 Geographic segmentation
      • Exhibit 67: Chart on Market share by geography 2023-2028 (%)
      • Exhibit 68: Data Table on Market share by geography 2023-2028 (%)
    • 9.2 Geographic comparison
      • Exhibit 69: Chart on Geographic comparison
      • Exhibit 70: Data Table on Geographic comparison
    • 9.3 North America - Market size and forecast 2023-2028
      • Exhibit 71: Chart on North America - Market size and forecast 2023-2028 ($ million)
      • Exhibit 72: Data Table on North America - Market size and forecast 2023-2028 ($ million)
      • Exhibit 73: Chart on North America - Year-over-year growth 2023-2028 (%)
      • Exhibit 74: Data Table on North America - Year-over-year growth 2023-2028 (%)
    • 9.4 Europe - Market size and forecast 2023-2028
      • Exhibit 75: Chart on Europe - Market size and forecast 2023-2028 ($ million)
      • Exhibit 76: Data Table on Europe - Market size and forecast 2023-2028 ($ million)
      • Exhibit 77: Chart on Europe - Year-over-year growth 2023-2028 (%)
      • Exhibit 78: Data Table on Europe - Year-over-year growth 2023-2028 (%)
    • 9.5 APAC - Market size and forecast 2023-2028
      • Exhibit 79: Chart on APAC - Market size and forecast 2023-2028 ($ million)
      • Exhibit 80: Data Table on APAC - Market size and forecast 2023-2028 ($ million)
      • Exhibit 81: Chart on APAC - Year-over-year growth 2023-2028 (%)
      • Exhibit 82: Data Table on APAC - Year-over-year growth 2023-2028 (%)
    • 9.6 South America - Market size and forecast 2023-2028
      • Exhibit 83: Chart on South America - Market size and forecast 2023-2028 ($ million)
      • Exhibit 84: Data Table on South America - Market size and forecast 2023-2028 ($ million)
      • Exhibit 85: Chart on South America - Year-over-year growth 2023-2028 (%)
      • Exhibit 86: Data Table on South America - Year-over-year growth 2023-2028 (%)
    • 9.7 Middle East and Africa - Market size and forecast 2023-2028
      • Exhibit 87: Chart on Middle East and Africa - Market size and forecast 2023-2028 ($ million)
      • Exhibit 88: Data Table on Middle East and Africa - Market size and forecast 2023-2028 ($ million)
      • Exhibit 89: Chart on Middle East and Africa - Year-over-year growth 2023-2028 (%)
      • Exhibit 90: Data Table on Middle East and Africa - Year-over-year growth 2023-2028 (%)
    • 9.8 US - Market size and forecast 2023-2028
      • Exhibit 91: Chart on US - Market size and forecast 2023-2028 ($ million)
      • Exhibit 92: Data Table on US - Market size and forecast 2023-2028 ($ million)
      • Exhibit 93: Chart on US - Year-over-year growth 2023-2028 (%)
      • Exhibit 94: Data Table on US - Year-over-year growth 2023-2028 (%)
    • 9.9 China - Market size and forecast 2023-2028
      • Exhibit 95: Chart on China - Market size and forecast 2023-2028 ($ million)
      • Exhibit 96: Data Table on China - Market size and forecast 2023-2028 ($ million)
      • Exhibit 97: Chart on China - Year-over-year growth 2023-2028 (%)
      • Exhibit 98: Data Table on China - Year-over-year growth 2023-2028 (%)
    • 9.10 Germany - Market size and forecast 2023-2028
      • Exhibit 99: Chart on Germany - Market size and forecast 2023-2028 ($ million)
      • Exhibit 100: Data Table on Germany - Market size and forecast 2023-2028 ($ million)
      • Exhibit 101: Chart on Germany - Year-over-year growth 2023-2028 (%)
      • Exhibit 102: Data Table on Germany - Year-over-year growth 2023-2028 (%)
    • 9.11 France - Market size and forecast 2023-2028
      • Exhibit 103: Chart on France - Market size and forecast 2023-2028 ($ million)
      • Exhibit 104: Data Table on France - Market size and forecast 2023-2028 ($ million)
      • Exhibit 105: Chart on France - Year-over-year growth 2023-2028 (%)
      • Exhibit 106: Data Table on France - Year-over-year growth 2023-2028 (%)
    • 9.12 Japan - Market size and forecast 2023-2028
      • Exhibit 107: Chart on Japan - Market size and forecast 2023-2028 ($ million)
      • Exhibit 108: Data Table on Japan - Market size and forecast 2023-2028 ($ million)
      • Exhibit 109: Chart on Japan - Year-over-year growth 2023-2028 (%)
      • Exhibit 110: Data Table on Japan - Year-over-year growth 2023-2028 (%)
    • 9.13 Market opportunity by geography
      • Exhibit 111: Market opportunity by geography ($ million)
      • Exhibit 112: Data Tables on Market opportunity by geography ($ million)

    10 Drivers, Challenges, and Trends

    • 10.1 Market drivers
      • 10.2 Market challenges
        • 10.3 Impact of drivers and challenges
          • Exhibit 113: Impact of drivers and challenges in 2023 and 2028
        • 10.4 Market trends

          11 Vendor Landscape

          • 11.1 Overview
            • 11.2 Vendor landscape
              • Exhibit 114: Overview on Criticality of inputs and Factors of differentiation
            • 11.3 Landscape disruption
              • Exhibit 115: Overview on factors of disruption
            • 11.4 Industry risks
              • Exhibit 116: Impact of key risks on business

            12 Vendor Analysis

            • 12.1 Vendors covered
              • Exhibit 117: Vendors covered
            • 12.2 Market positioning of vendors
              • Exhibit 118: Matrix on vendor position and classification
            • 12.3 Albany International Corp.
              • Exhibit 119: Albany International Corp. - Overview
              • Exhibit 120: Albany International Corp. - Key offerings
            • 12.4 Bally Ribbon Mills
              • Exhibit 121: Bally Ribbon Mills - Overview
              • Exhibit 122: Bally Ribbon Mills - Product / Service
              • Exhibit 123: Bally Ribbon Mills - Key offerings
            • 12.5 General Electric Co.
              • Exhibit 124: General Electric Co. - Overview
              • Exhibit 125: General Electric Co. - Business segments
              • Exhibit 126: General Electric Co. - Key news
              • Exhibit 127: General Electric Co. - Key offerings
              • Exhibit 128: General Electric Co. - Segment focus
            • 12.6 Hexcel Corp.
              • Exhibit 129: Hexcel Corp. - Overview
              • Exhibit 130: Hexcel Corp. - Business segments
              • Exhibit 131: Hexcel Corp. - Key news
              • Exhibit 132: Hexcel Corp. - Key offerings
              • Exhibit 133: Hexcel Corp. - Segment focus
            • 12.7 Kineco Kaman Composites
              • Exhibit 134: Kineco Kaman Composites - Overview
              • Exhibit 135: Kineco Kaman Composites - Product / Service
              • Exhibit 136: Kineco Kaman Composites - Key offerings
            • 12.8 Lee Aerospace Inc.
              • Exhibit 137: Lee Aerospace Inc. - Overview
              • Exhibit 138: Lee Aerospace Inc. - Product / Service
              • Exhibit 139: Lee Aerospace Inc. - Key offerings
            • 12.9 Materion Corp.
              • Exhibit 140: Materion Corp. - Overview
              • Exhibit 141: Materion Corp. - Business segments
              • Exhibit 142: Materion Corp. - Key offerings
              • Exhibit 143: Materion Corp. - Segment focus
            • 12.10 Mitsubishi Chemical Group Corp.
              • Exhibit 144: Mitsubishi Chemical Group Corp. - Overview
              • Exhibit 145: Mitsubishi Chemical Group Corp. - Business segments
              • Exhibit 146: Mitsubishi Chemical Group Corp. - Key offerings
              • Exhibit 147: Mitsubishi Chemical Group Corp. - Segment focus
            • 12.11 Owens Corning
              • Exhibit 148: Owens Corning - Overview
              • Exhibit 149: Owens Corning - Business segments
              • Exhibit 150: Owens Corning - Key news
              • Exhibit 151: Owens Corning - Key offerings
              • Exhibit 152: Owens Corning - Segment focus
            • 12.12 Plastic Reinforcement Fabrics Ltd.
              • Exhibit 153: Plastic Reinforcement Fabrics Ltd. - Overview
              • Exhibit 154: Plastic Reinforcement Fabrics Ltd. - Product / Service
              • Exhibit 155: Plastic Reinforcement Fabrics Ltd. - Key offerings
            • 12.13 Rolls Royce Holdings Plc
              • Exhibit 156: Rolls Royce Holdings Plc - Overview
              • Exhibit 157: Rolls Royce Holdings Plc - Business segments
              • Exhibit 158: Rolls Royce Holdings Plc - Key news
              • Exhibit 159: Rolls Royce Holdings Plc - Key offerings
              • Exhibit 160: Rolls Royce Holdings Plc - Segment focus
            • 12.14 Spirit AeroSystems Inc.
              • Exhibit 161: Spirit AeroSystems Inc. - Overview
              • Exhibit 162: Spirit AeroSystems Inc. - Business segments
              • Exhibit 163: Spirit AeroSystems Inc. - Key offerings
              • Exhibit 164: Spirit AeroSystems Inc. - Segment focus
            • 12.15 Teijin Ltd.
              • Exhibit 165: Teijin Ltd. - Overview
              • Exhibit 166: Teijin Ltd. - Business segments
              • Exhibit 167: Teijin Ltd. - Key offerings
              • Exhibit 168: Teijin Ltd. - Segment focus
            • 12.16 Toray TCAC Holding B.V.
              • Exhibit 169: Toray TCAC Holding B.V. - Overview
              • Exhibit 170: Toray TCAC Holding B.V. - Product / Service
              • Exhibit 171: Toray TCAC Holding B.V. - Key offerings
            • 12.17 Victrex Plc
              • Exhibit 172: Victrex Plc - Overview
              • Exhibit 173: Victrex Plc - Business segments
              • Exhibit 174: Victrex Plc - Key offerings
              • Exhibit 175: Victrex Plc - Segment focus

            13 Appendix

            • 13.1 Scope of the report
              • 13.2 Inclusions and exclusions checklist
                • Exhibit 176: Inclusions checklist
                • Exhibit 177: Exclusions checklist
              • 13.3 Currency conversion rates for US$
                • Exhibit 178: Currency conversion rates for US$
              • 13.4 Research methodology
                • Exhibit 179: Research methodology
                • Exhibit 180: Validation techniques employed for market sizing
                • Exhibit 181: Information sources
              • 13.5 List of abbreviations
                • Exhibit 182: List of abbreviations

              Research Methodology

              Technavio presents a detailed picture of the market by way of study, synthesis, and summation of data from multiple sources. The analysts have presented the various facets of the market with a particular focus on identifying the key industry influencers. The data thus presented is comprehensive, reliable, and the result of extensive research, both primary and secondary.

              INFORMATION SOURCES

              Primary sources

              • Manufacturers and suppliers
              • Channel partners
              • Industry experts
              • Strategic decision makers

              Secondary sources

              • Industry journals and periodicals
              • Government data
              • Financial reports of key industry players
              • Historical data
              • Press releases

              DATA ANALYSIS

              Data Synthesis

              • Collation of data
              • Estimation of key figures
              • Analysis of derived insights

              Data Validation

              • Triangulation with data models
              • Reference against proprietary databases
              • Corroboration with industry experts

              REPORT WRITING

              Qualitative

              • Market drivers
              • Market challenges
              • Market trends
              • Five forces analysis

              Quantitative

              • Market size and forecast
              • Market segmentation
              • Geographical insights
              • Competitive landscape

              Interested in this report?

              Get your sample now to see our research methodology and insights!

              Download Now

              Frequently Asked Questions

              Aerospace Composite market growth will increase by $ 17.41 bn during 2024-2028 .

              The Aerospace Composite market is expected to grow at a CAGR of 9.5% during 2024-2028 .

              Aerospace Composite market is segmented by Type( Exteriors, Interiors) Application( Commercial aircraft, Military aircraft, Business and general aviation, Civil helicopters)

              Albany International Corp., Bally Ribbon Mills, General Electric Co., Hexcel Corp., Kineco Kaman Composites, Lee Aerospace Inc., Materion Corp., Mitsubishi Chemical Group Corp., Owens Corning, Plastic Reinforcement Fabrics Ltd., Renegade Materials Corp., Rolls Royce Holdings Plc, SGL Carbon SE, Sunshield Chemicals Ltd., Spirit AeroSystems Inc., Teijin Ltd., Toray TCAC Holding B.V., Victrex Plc are a few of the key vendors in the Aerospace Composite market.

              North America will register the highest growth rate of 37% among the other regions. Therefore, the Aerospace Composite market in North America is expected to garner significant business opportunities for the vendors during the forecast period.

              US, China, Japan, Germany, France

              • Increasing demand for weight reduction and fuel efficiency in aircraftThe growing demand for weight reduction and fuel efficiency in aircraft is a major driver of the global aerospace composite market. This trend is being driven by a number of critical factors that affect both commercial and military aviation. To comply with stringent environmental regulations and achieve sustainability goals is the driving factor this market.
              • the aviation industry must continually improve fuel efficiency and reduce overall aircraft weight. Aerospace composites is the driving factor this market.
              • particularly carbon fiber-reinforced materials is the driving factor this market.
              • have an impressive strength-to-weight ratio is the driving factor this market.
              • allowing manufacturers to design and produce aircraft components that are significantly lighter while maintaining structural integrity. This weight reduction is critical for reducing fuel consumption is the driving factor this market.
              • operating costs is the driving factor this market.
              • and the environmental impact of air travel. As air travel continues to grow at an exponential rate is the driving factor this market.
              • airlines and aircraft manufacturers are focusing more on optimizing fuel efficiency to address rising fuel costs and ensure economic viability. Composite materials play an important role in achieving this optimization by replacing traditional materials such as aluminum with lighter alternatives. The aerospace industrys commitment to technological innovation and advancements promotes the use of aerospace composites. These materials enable more aerodynamic designs and innovative engineering solutions is the driving factor this market.
              • ultimately improving fuel efficiency and performance. As the demand for more efficient and environmentally friendly air transportation grows is the driving factor this market.
              • the global aerospace composite market is expected to expand significantly is the driving factor this market.
              • owing to the critical role of composites in addressing the industrys pressing challenges. These factors will drive the growth of the global aerospace composite market during the forecast period. is the driving factor this market.

              The Aerospace Composite market vendors should focus on grabbing business opportunities from the Exteriors segment as it accounted for the largest market share in the base year.