Agricultural Surfactants Market Size 2024-2028
The agricultural surfactants market size is forecast to increase by USD 509.8 million at a CAGR of 5.87% between 2024 and 2028. The market is experiencing significant growth due to several key trends and drivers. One of the primary factors fueling market growth is the increasing awareness of sustainable agriculture. Farmers are increasingly adopting eco-friendly farming practices, which include the use of agricultural surfactants to enhance the efficiency of agrochemicals and reduce their environmental impact. Another trend shaping the market is the shift towards bio-based surfactants. These surfactants are derived from renewable sources and offer several advantages, including reduced toxicity and improved biodegradability. Additionally, regulatory compliance is a major driver for the market, as governments worldwide are implementing stringent regulations to ensure the safety and efficacy of agricultural inputs, including surfactants.
Market Analysis

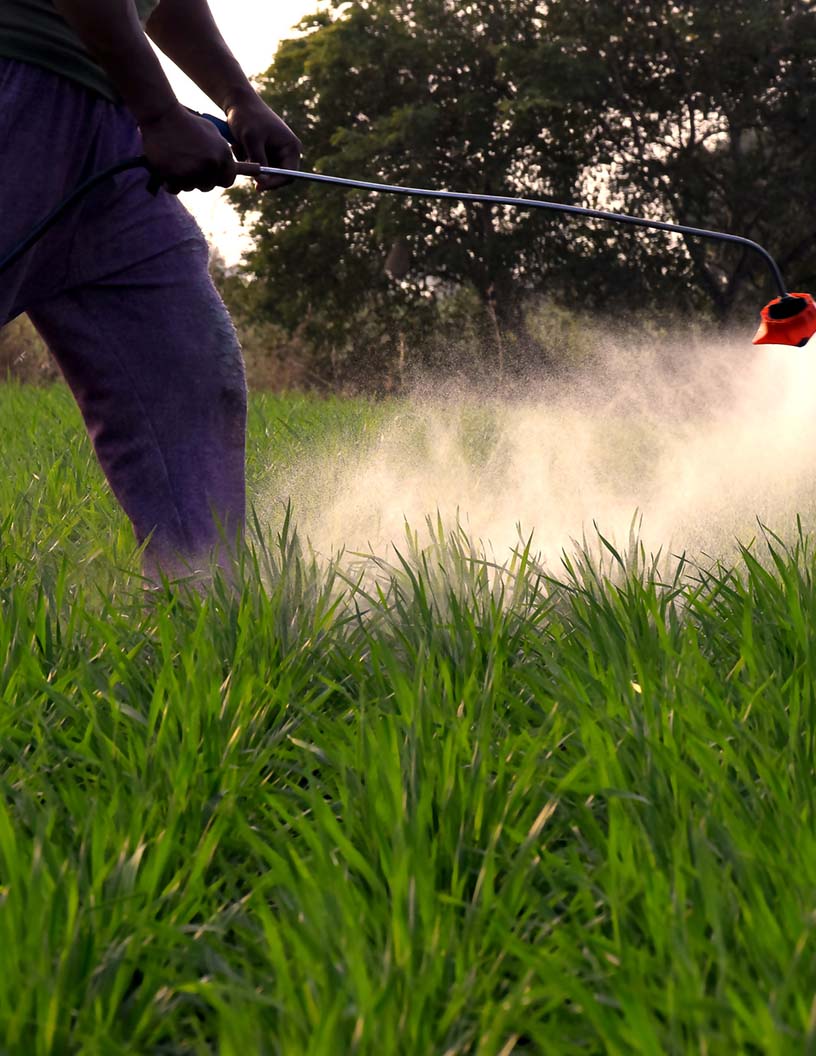
The global market is anticipated to experience significant growth due to the increasing demand for crop protection products in agricultural production. These surfactants, which function as additives, play a crucial role in enhancing the efficacy of agrochemicals such as herbicides, insecticides, and fungicides. The market is particularly driven by the need to protect crops grown in agricultural areas, including cereals and grains like coarse grains and wheat, as well as cereals and grains alternatives such as oilseeds and pulses. Carboxylates and sulfates are the most commonly used surfactants in the agricultural industry due to their effectiveness in improving substrate penetration and increasing the bioavailability of agrochemicals.
Fungi are a significant concern for various crop types, leading to a high demand for fungicides and surfactants that enhance their performance. The market also caters to the needs of fruits and vegetables, as well as crops grown for oilseeds and pulses. Plant regulators and plant growth additives are other areas of growth, as farmers seek to optimize productivity and ensure healthy plant growth.
Market Segmentation
The market research report provides comprehensive data (region-wise segment analysis), with forecasts and estimates in "USD million" for the period 2024-2028, as well as historical data from 2018 - 2022 for the following segments.
- Type
- Synthetic
- Bio-based
- Crop Type
- Cereals and grains
- Oilseeds and pulses
- Fruits and vegetables
- Others
- Geography
- North America
- The U.S.
- Canada
- South America
- Brazil.
- Chile
- Europe
- The U.K.
- Germany
- France
- Rest of Europe
- APAC
- China
- India
- Middle East & Africa
- Saudi Arabia
- South Africa
- Rest of the Middle East & Africa
- North America
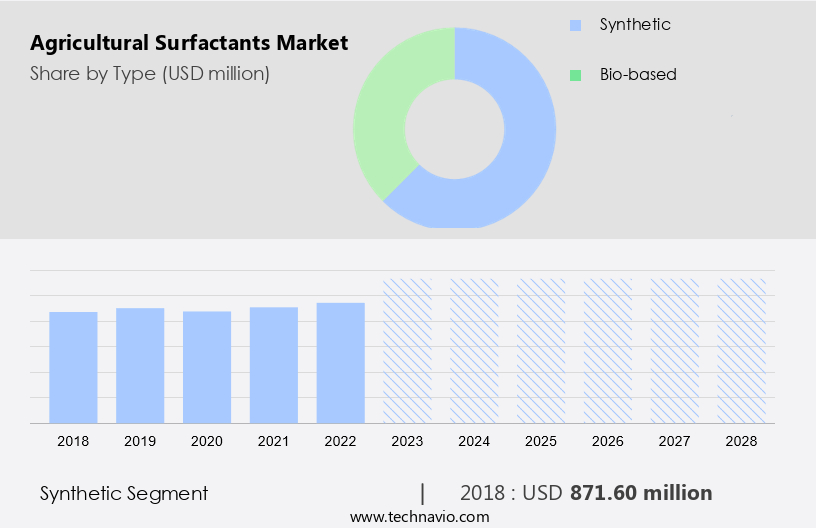
By Type Insights
The Synthetic segment is estimated to witness significant growth during the forecast period. In the realm of agricultural production, surfactants serve as essential additives that augment the efficacy of crop protection products. These compounds, engineered for agricultural applications, enhance the performance of herbicides, insecticides, fungicides, and other agrochemicals. By improving the spread and penetration of these substances on plant surfaces, surfactants ensure optimal plant growth and productivity in various crops, including coarse grains, wheat, pulses and oilseeds, fruits and vegetables, and grains and cereals. The agricultural landscape is characterized by a diverse array of pests, insects, and diseases that pose constant threats to crops. Surfactants play a crucial role in mitigating these challenges by increasing the efficiency of pesticides, thereby reducing yields lost to insect infestations and crop destruction.
With a low toxicity profile, these surfactants prioritize safety while ensuring high crop output. Synthetic surfactants, derived primarily from petroleum raw materials, have long dominated the market. However, the growing demand for sustainable agricultural practices and eco-conscious consumer preferences have led to the emergence of bio-based surfactants. Derived from plant-based oils, these sustainable surfactants cater to the customer desire for eco-friendly solutions while adhering to safety and sustainability standards. Anionic and cationic surfactants are the most commonly used types in agricultural applications. These surfactants exhibit unique properties that make them indispensable in the realm of crop protection. As the global agricultural industry continues to evolve, the market for agricultural surfactants is poised for significant growth, driven by the need for effective, eco-friendly, and sustainable crop protection solutions.
Get a glance at the market share of various segments Request Free Sample
The Synthetic segment accounted for USD 871.60 million in 2018 - 2022 and showed a gradual increase during the forecast period.
Regional Insights
APAC is estimated to contribute 44% to the growth of the global market during the forecast period. Technavio's analysts have elaborately explained the regional trends and drivers that shape the market during the forecast period.

For more insights on the market share of various regions Request Free Sample
Amphoteric and non-ionic surfactants are widely used in the agricultural industry due to their unique properties, including hydrophilic and hydrophobic characteristics. These surfactants play a crucial role in crop wetting, spreading, and emulsifying agents, reducing surface tension and enhancing the penetration of agrochemicals into the substrate. They act as dispersants, ensuring the stability of pesticides and fertilizers in runoff water, thereby preventing environmental hazards. The substrate type, whether synthetic or bio-based, influences the choice of surfactants. Bio-based surfactants derived from yeasts, bacteria, and fungi are gaining popularity due to their eco-friendliness and consumer focus on health and wellness. In pesticide-consuming countries, precision farming methods are increasingly adopted to optimize the use of arable land, leading to a higher demand for surfactants in the agricultural economy.
Cereals and grains, oilseeds and pulses, and various crop types require specific surfactants for effective agrochemical application. Sulfonates and carboxylates, such as sulfates, are commonly used for fungicides, while surfactants like glufosinate and glyphosate are essential for herbicides. The agricultural economy's shift towards sustainable and efficient farming practices continues to drive the demand for advanced surfactant technologies.
Market Dynamics
Our agricultural surfactants market researchers analyzed the data with 2023 as the base year, along with the key drivers, trends, and challenges. A holistic analysis of drivers will help companies refine their marketing strategies to gain a competitive advantage.
Agricultural Surfactants Market Driver
Cultivating understanding and appreciation for sustainable agriculture is the key driver. This involves implementing methods that minimize environmental impact, promote soil health, and support local communities. By fostering this awareness, we can contribute to a more sustainable food system. In the agricultural sector, there is a growing emphasis on sustainable practices to enhance crop productivity while minimizing environmental impact. Crop protection products, including herbicides, insecticides, and fungicides, are essential for optimal agricultural production. Surfactants, as additives, play a crucial role in enhancing the efficiency of these agrochemicals. By improving the spread and penetration of pesticides on crops, surfactants ensure uniform coverage and distribution, ultimately leading to higher yields and better crop health. Sustainability is a key consideration in modern agriculture, with a focus on reducing the use of petroleum raw materials and increasing the adoption of plant-based oils and bio-based surfactants.
Consumers are increasingly desirous of eco-friendly and safe food production methods. Sustainable surfactants, such as anionic and cationic types, meet these demands by offering low toxicity, high biodegradability, and eco-friendly properties. These surfactants contribute significantly to the sustainability of crop protection solutions, enabling farmers to combat agricultural illnesses, insect infestations, and pests while adhering to safety standards. The use of sustainable surfactants is essential for the production of grains and cereals, including coarse grains, wheat, pulses, and oilseeds, as well as fruits and vegetables. The adoption of these eco-friendly additives is expected to continue growing as the demand for sustainable agricultural practices increases.
Agricultural Surfactants Market Trends
Adherence to environmental sustainability initiatives is the key trend. To adhere to environmental sustainability initiatives, it is recommended to transition towards the utilization of bio-based surfactants in industrial applications. These surfactants, derived from renewable sources, offer a more eco-friendly alternative to their petroleum-based counterparts. The market is witnessing a significant shift towards the use of eco-friendly additives in crop protection products. Bio-based surfactants, derived from renewable sources such as plant-based oils and microbial fermentation, are gaining popularity in agricultural areas due to their sustainability and safety standards. These surfactants enhance the efficiency of herbicides, insecticides, and fungicides by improving their spread and penetration in crops like coarse grains, wheat, pulses and oilseeds, fruits, and vegetables. By reducing the reliance on petroleum raw materials, bio-based surfactants offer a more sustainable alternative to traditional surfactants. Moreover, they have a lower toxicity profile, ensuring safety for both farmers and the environment.
With increasing consumer demand for sustainably produced food and agricultural products, the use of bio-based surfactants as crop protection solutions is expected to continue growing. These surfactants are also more effective in controlling insect infestations and agricultural illnesses, leading to higher yields and improved crop output. Anionic and cationic surfactants are commonly used in the agricultural industry, and the trend towards sustainable surfactants is driving innovation in the development of new, eco-friendly formulations.
Agricultural Surfactants Market Challenge
Complexities and high cost pose as a major challenge to the market. Surfactants play a crucial role in improving the productivity of crops such as coarse grains, wheat, grains and cereals, pulses and oilseeds, fruits and vegetables, by increasing the spread and penetration of these agrochemicals. However, the use of surfactants in agriculture is subject to stringent regulations due to concerns over safety, environmental impact, and product labeling. These regulations necessitate a registration and approval process, which can be costly, time-consuming, and complex, involving extensive testing and data submissions to demonstrate safety and efficacy.
Moreover, the use of surfactants in combination with pesticides may impact the establishment of maximum residue limits (MRLs) for pesticide residues on crops. The industry is witnessing a shift towards the use of sustainable surfactants, such as those derived from plant-based oils and bio-based raw materials, to meet the growing customer desire for eco-friendly and safe crop protection solutions. Sustainability, safety standards, and eco-toxicological considerations are key factors influencing the market's growth trajectory. Anionic and cationic surfactants are the most commonly used types in the agricultural surfactant market.
Exclusive Customer Landscape
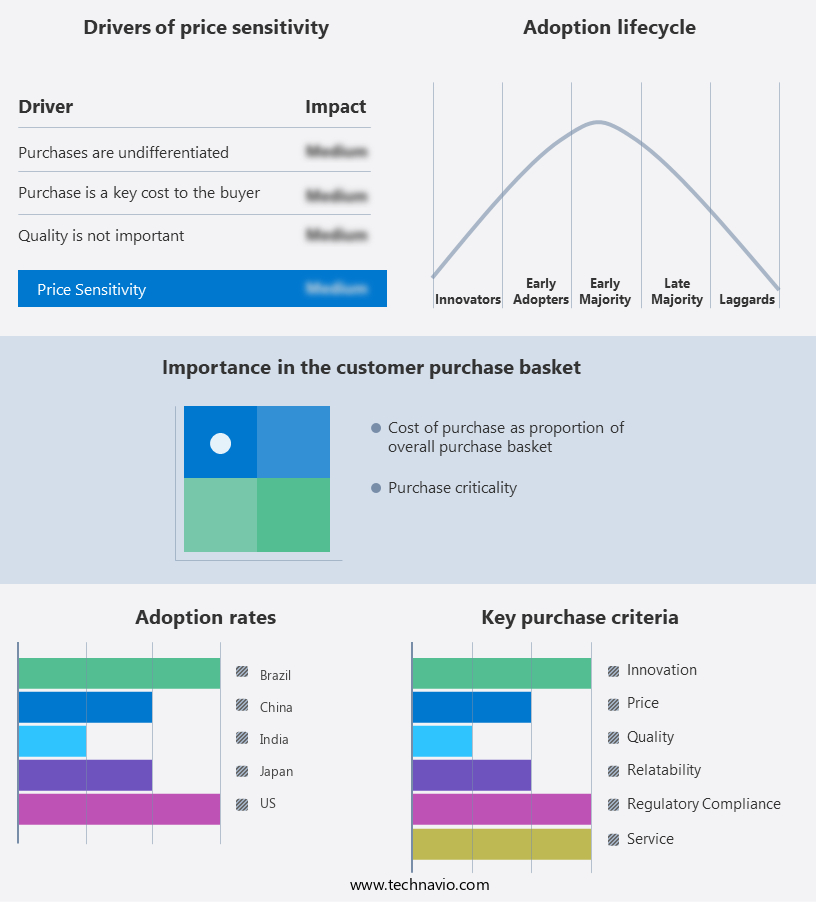
The agricultural surfactants market forecasting report includes the adoption lifecycle of the market, covering from the innovator's stage to the laggard's stage. It focuses on adoption rates in different regions based on penetration. Furthermore, the report also includes key purchase criteria and drivers of price sensitivity to help companies evaluate and develop their market growth analysis strategies.
Customer Landscape
Key Companies & Market Insights
Companies are implementing various strategies, such as strategic alliances, partnerships, mergers and acquisitions, geographical expansion, and product/service launches, to enhance their presence in the market.
Air Products and Chemicals Inc: The company is committed to delivering high-performing surfactants for optimal crop production.
The market research and growth report includes detailed analyses of the competitive landscape of the market and information about key companies, including:
- Akzo Nobel NV
- BASF SE
- Bayer AG
- BRANDT Inc.
- Clariant International Ltd.
- Corteva Inc.
- Croda International Plc
- Dow Chemical Co.
- Evonik Industries AG
- GarrCo Products Inc.
- Helena Agri Enterprises LLC
- Huntsman International LLC
- Interagro UK Ltd.
- Kao Corp.
- Lamberti SpA
- Lankem Ltd.
- Nufarm Ltd.
- Solvay SA
- Wilbur Ellis Holdings Inc.
Qualitative and quantitative analysis of companies has been conducted to help clients understand the wider business environment as well as the strengths and weaknesses of key market players. Data is qualitatively analyzed to categorize companies as pure play, category-focused, industry-focused, and diversified; it is quantitatively analyzed to categorize companies as dominant, leading, strong, tentative, and weak.
Research Analyst Overview
Agricultural production in various agricultural areas relies heavily on crop protection products such as herbicides, insecticides, and fungicides to ensure high yields and productivity. Surfactants play a crucial role in enhancing the efficiency of these crop protection products by improving their spread and penetration into plant surfaces. Anionic and cationic surfactants are commonly used in the agriculture industry as additives in pesticides. Coarse grains, wheat, pulses and oilseeds, fruits, and vegetables are among the major crops that benefit from surfactant use. These agricultural illnesses, insect infestations, and pests can significantly impact crop output and lead to crop destruction. Surfactants help mitigate these issues by improving pesticide efficiency and reducing the amount of active ingredient required.
The use of bio-based surfactants derived from plant-based oils and sustainable surfactants made from petroleum raw materials is gaining popularity due to customer desire for eco-friendly and sustainable crop protection solutions. These surfactants not only meet safety and sustainability standards but also offer low toxicity and improved plant growth. The market is expected to grow significantly due to the increasing demand for high-performing, eco-friendly, and cost-effective crop protection solutions.
|
Market Scope |
|
|
Report Coverage |
Details |
|
Page number |
167 |
|
Base year |
2023 |
|
Historic period |
2018-2022 |
|
Forecast period |
2024-2028 |
|
Growth momentum & CAGR |
Accelerate at a CAGR of 5.87% |
|
Market growth 2024-2028 |
USD 509.8 million |
|
Market structure |
Fragmented |
|
YoY growth 2023-2024(%) |
5.2 |
|
Regional analysis |
APAC, Europe, North America, South America, and Middle East and Africa |
|
Performing market contribution |
APAC at 44% |
|
Key countries |
China, US, India, Brazil, and Japan |
|
Competitive landscape |
Leading Companies, Market Positioning of Companies, Competitive Strategies, and Industry Risks |
|
Key companies profiled |
Air Products and Chemicals Inc., Akzo Nobel NV, BASF SE, Bayer AG, BRANDT Inc., Clariant International Ltd., Corteva Inc., Croda International Plc, Dow Chemical Co., Evonik Industries AG, GarrCo Products Inc., Helena Agri Enterprises LLC, Huntsman International LLC, Interagro UK Ltd., Kao Corp., Lamberti SpA, Lankem Ltd., Nufarm Ltd., Solvay SA, and Wilbur Ellis Holdings Inc. |
|
Market dynamics |
Parent market analysis, market growth inducers and obstacles, market forecast, fast-growing and slow-growing segment analysis, COVID-19 impact and recovery analysis and future consumer dynamics, market condition analysis for the forecast period |
|
Customization purview |
If our market report has not included the data that you are looking for, you can reach out to our analysts and get segments customized. |
What are the Key Data Covered in this Market Research and Growth Report?
- CAGR of the market during the forecast period
- Detailed information on factors that will drive the market growth and forecasting between 2024 and 2028
- Precise estimation of the size of the market and its contribution of the market in focus to the parent market
- Accurate predictions about upcoming market growth and trends and changes in consumer behaviour
- Growth of the market across APAC, Europe, North America, South America, and Middle East and Africa
- Thorough analysis of the market's competitive landscape and detailed information about companies
- Comprehensive analysis of factors that will challenge the growth of market companies
We can help! Our analysts can customize this market research report to meet your requirements. Get in touch
 RIA -
RIA - 
