
AI Agent Platform Market Size 2026-2030
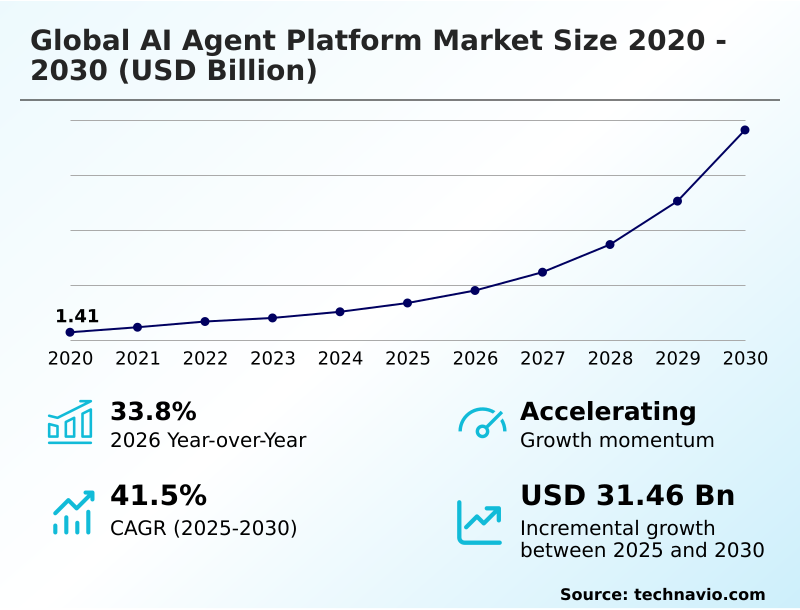
The ai agent platform market size is valued to increase by USD 31.46 billion, at a CAGR of 41.5% from 2025 to 2030. Rapid advancements in foundational AI models and reasoning capabilities will drive the ai agent platform market.
Major Market Trends & Insights
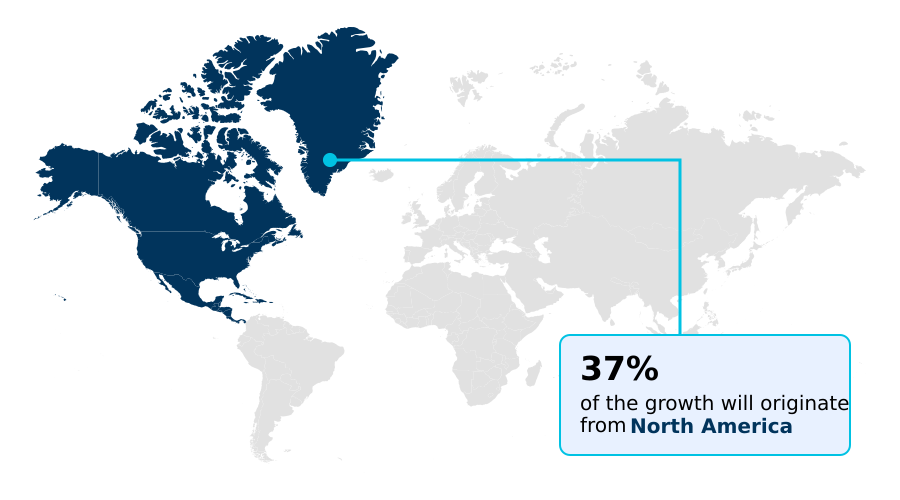
- North America dominated the market and accounted for a 36.9% growth during the forecast period.
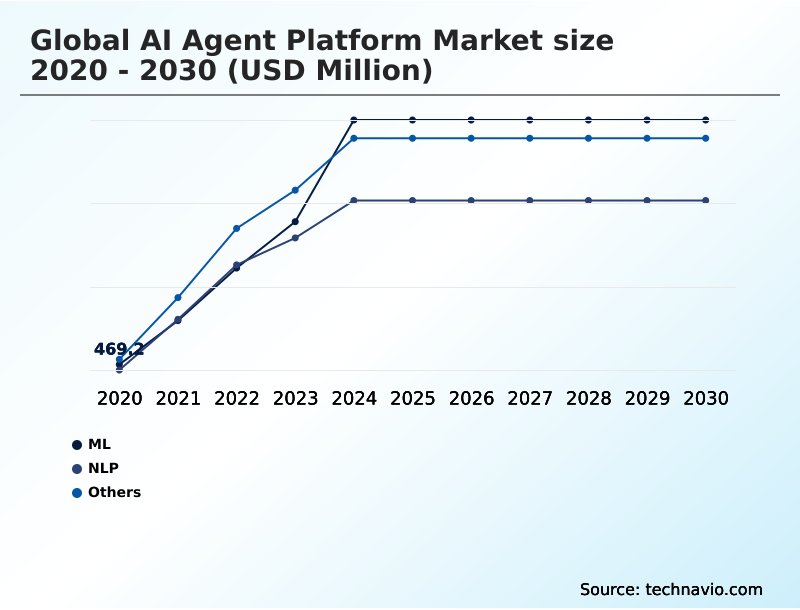
- By Technology - ML segment was valued at USD 1.90 billion in 2024
- By Type - Single agent systems segment accounted for the largest market revenue share in 2024
Market Size & Forecast
- Market Opportunities: USD 36.78 billion
- Market Future Opportunities: USD 31.46 billion
- CAGR from 2025 to 2030 : 41.5%
Market Summary
- The AI agent platform market is defined by software frameworks designed for creating, deploying, and managing autonomous agents. Growth is propelled by advancements in foundational AI models, which provide the reasoning capabilities necessary for complex task automation and hyper-automation. A prominent trend is the shift toward multi-functional agents capable of handling diverse, interconnected tasks, moving beyond single-purpose bots.
- For instance, in supply chain management, an autonomous agent can monitor inventory levels, predict stockouts using historical data, and execute API calls to reorder supplies, all while communicating with logistics partners. However, the market faces challenges related to agentic hallucinations and unreliability, which can lead to unauthorized or destructive actions, particularly in mission-critical environments.
- Addressing this requires robust guardrails and verification layers to ensure predictable performance. The proliferation of APIs further fuels the market by creating an interconnected ecosystem where agents can orchestrate various digital tools, acting as a unified interface for complex software stacks. This synergy between model intelligence, enterprise demand, and digital connectivity is reshaping operational efficiency across industries.
What will be the Size of the AI Agent Platform Market during the forecast period?
Get Key Insights on Market Forecast (PDF) Get Free Sample
How is the AI Agent Platform Market Segmented?
The ai agent platform industry research report provides comprehensive data (region-wise segment analysis), with forecasts and estimates in "USD million" for the period 2026-2030, as well as historical data from 2020-2024 for the following segments.
- Technology
- ML
- NLP
- Others
- Type
- Single agent systems
- Multi agent systems
- End-user
- Financial services
- Retail and e-commerce
- IT and telecommunication
- Healthcare
- Others
- Geography
- North America
- US
- Canada
- Mexico
- Europe
- Germany
- UK
- France
- APAC
- China
- Japan
- India
- South America
- Brazil
- Argentina
- Middle East and Africa
- Saudi Arabia
- UAE
- South Africa
- Rest of World (ROW)
- North America
By Technology Insights
The ml segment is estimated to witness significant growth during the forecast period.
Market segmentation reveals the foundational role of machine learning as the analytical engine driving agent performance. This technology enables autonomous decision-making through predictive modeling, allowing agents to learn from data and improve task execution.
As a result, enterprises have achieved up to a 50% improvement in local processing speeds for on-device applications.
The market is divided between single agent systems, optimized for specialized tasks, and multi-agent systems, which use collaborative agent-based modeling for complex challenges.
The evolution toward neural reasoning frameworks and explainable architectures is critical, supported by AI safety research to ensure reliability. This facilitates end-to-end automation with self-evolving models that utilize reinforcement learning and advanced predictive analytics for continuous improvement.
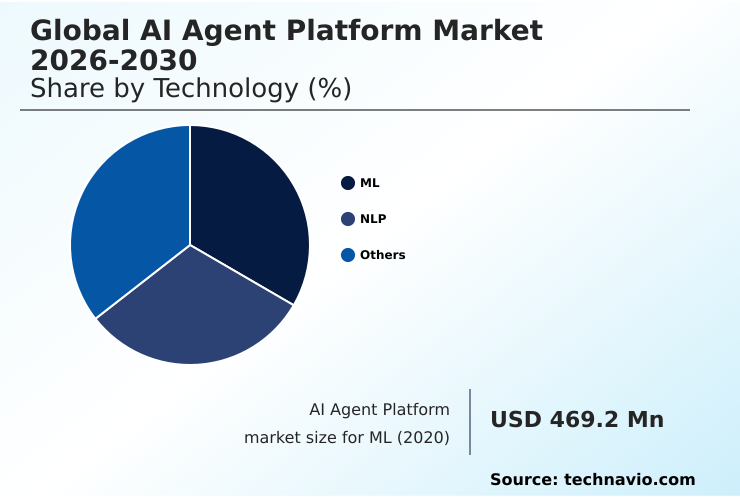
The ML segment was valued at USD 1.90 billion in 2024 and showed a gradual increase during the forecast period.
Regional Analysis
North America is estimated to contribute 36.9% to the growth of the global market during the forecast period.Technavio’s analysts have elaborately explained the regional trends and drivers that shape the market during the forecast period.
See How AI Agent Platform Market Demand is Rising in North America Get Free Sample
The geographic landscape of the AI agent platform market is led by North America, which is projected to account for 36.9% of incremental growth. This is driven by enterprise demand for robotic process automation and advanced agentic workflows.
Meanwhile, APAC is the fastest-growing region, with an estimated CAGR of 43.6%, fueled by advancements in hardware and 5G infrastructure that support sophisticated computer vision and natural language processing applications.
Europe’s market is shaped by a strong focus on data sovereignty, driving demand for solutions with robust knowledge graphs and secure agent-to-agent communication protocols.
The global distribution of AI agent development is supported by hybrid cloud platforms, enabling the deployment of autonomous agents and autonomous software agents with powerful reasoning engines.
IT service management automation and other workflow automation tools are becoming standard, reflecting a worldwide shift toward more intelligent and automated business operations.
Market Dynamics
Our researchers analyzed the data with 2025 as the base year, along with the key drivers, trends, and challenges. A holistic analysis of drivers will help companies refine their marketing strategies to gain a competitive advantage.
- The strategic adoption of AI agent platforms is reshaping enterprise operations, moving beyond simple automation to create scalable AI agent frameworks that drive significant business value. As organizations evaluate the benefits of autonomous AI agents, a key consideration is the total cost of AI agent platform implementation, which includes development, deployment, and ongoing maintenance.
- Comparing AI agent development platforms is crucial, as is ensuring adherence to stringent AI agent platform security standards to protect sensitive data. The future of AI agent platforms lies in their ability to handle complex, multi-step tasks across various sectors.
- For instance, multi-agent systems for supply chain management have demonstrated the capacity to enhance logistical efficiency, leading to operational gains upwards of 20% in some industrial settings. Key use cases, such as an AI agent for customer service automation, AI agents in financial services, and applications in healthcare and IT automation, highlight the technology's versatility.
- Success hinges on building AI agents with LLMs that are both powerful and reliable, leveraging open source AI agent frameworks and seamless AI agent platform API integration.
- Mastering best practices for AI agent development while navigating the challenges of deploying AI agents and their ethical considerations is essential for unlocking the full potential of generative AI agent platform use cases and creating a truly intelligent AI agent platform for enterprises.
What are the key market drivers leading to the rise in the adoption of AI Agent Platform Industry?
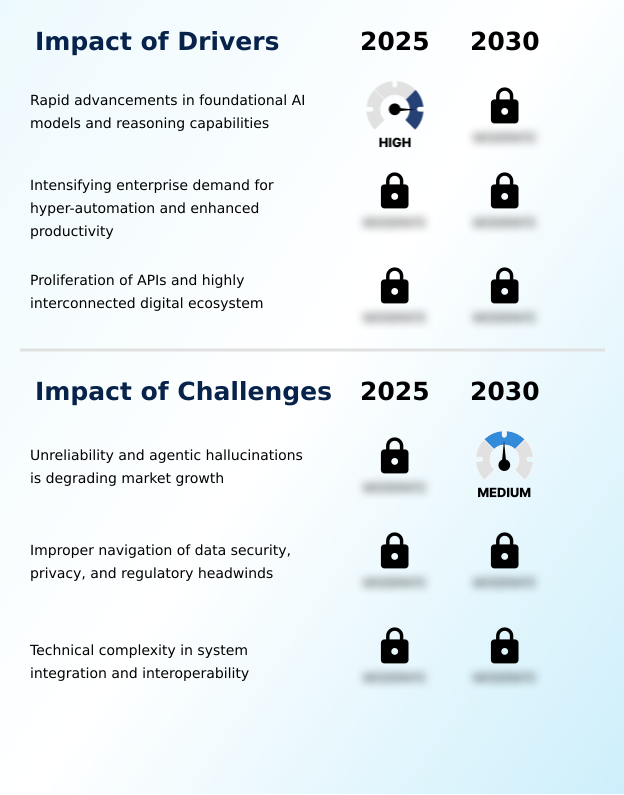
- Rapid advancements in foundational AI models and their reasoning capabilities are a key driver for the AI agent platform market.
- The primary driver of the AI agent platform market is the rapid advancement of foundational AI models and their reasoning capabilities.
- These large language models provide the engine for hyper-automation, enabling intelligent automation platforms to execute complex agentic workflows with high precision.
- The enterprise demand for autonomous operations is accelerating the adoption of AI-driven business process automation, with some companies reporting a 40% reduction in manual processing times.
- This growth is supported by the proliferation of APIs, which facilitates seamless API integration and workflow orchestration across disparate systems.
- The availability of sophisticated LLM orchestration frameworks and AI application development tools empowers developers to build and deploy powerful, AI-powered automation solutions, driving a new wave of operational efficiency and productivity gains across industries.
What are the market trends shaping the AI Agent Platform Industry?
- A key market trend is the increasing online availability of pre-built agents and specialized cognitive tools. This fosters growth by providing developers and enterprises with access to a global library of agentic assets.
- Key trends are reshaping the AI agent platform market, centered on accessibility and functionality. The rise of low-code interfaces and no-code automation platforms is democratizing AI agent development, allowing non-technical users to deploy their own digital assistants and agentic solutions.
- This is complemented by the move toward multi-functional, generative AI agents with deep cognitive depth, capable of handling diverse tasks through conversational AI. These intelligent virtual assistants, powered by advanced multimodal models, are reducing task completion times by up to 35% in enterprise settings. The trend also includes a shift to decentralized agentic systems, which enhances security and reduces latency.
- The availability of enterprise generative AI and generative AI platforms is fostering an ecosystem where task automation is becoming more intelligent and adaptable, moving beyond single-purpose bots to create more versatile and integrated enterprise solutions.
What challenges does the AI Agent Platform Industry face during its growth?
- A key challenge affecting market growth is the unreliability of AI agents and the occurrence of agentic hallucinations, which degrades performance and poses operational risks.
- Significant challenges constrain the widespread adoption of AI agent platforms, primarily stemming from technical unreliability and security vulnerabilities. Agentic hallucinations, where agents perform unauthorized or incorrect actions, can increase operational risk by over 25% in high-stakes environments like finance and healthcare, undermining trust in intelligent automation. This necessitates complex chain of thought verification and human-in-the-loop checkpoints.
- Furthermore, navigating data sovereignty regulations and protecting against prompt injection attacks requires robust AI governance platforms and advanced AI orchestration. The complexity of system integration and achieving interoperability with legacy systems adds another layer of difficulty, with integration efforts increasing deployment costs by up to 60% for some AI-driven enterprise operations.
- These issues make it difficult for task-driven autonomous agents to reliably handle functions like customer service automation without significant oversight.
Exclusive Technavio Analysis on Customer Landscape
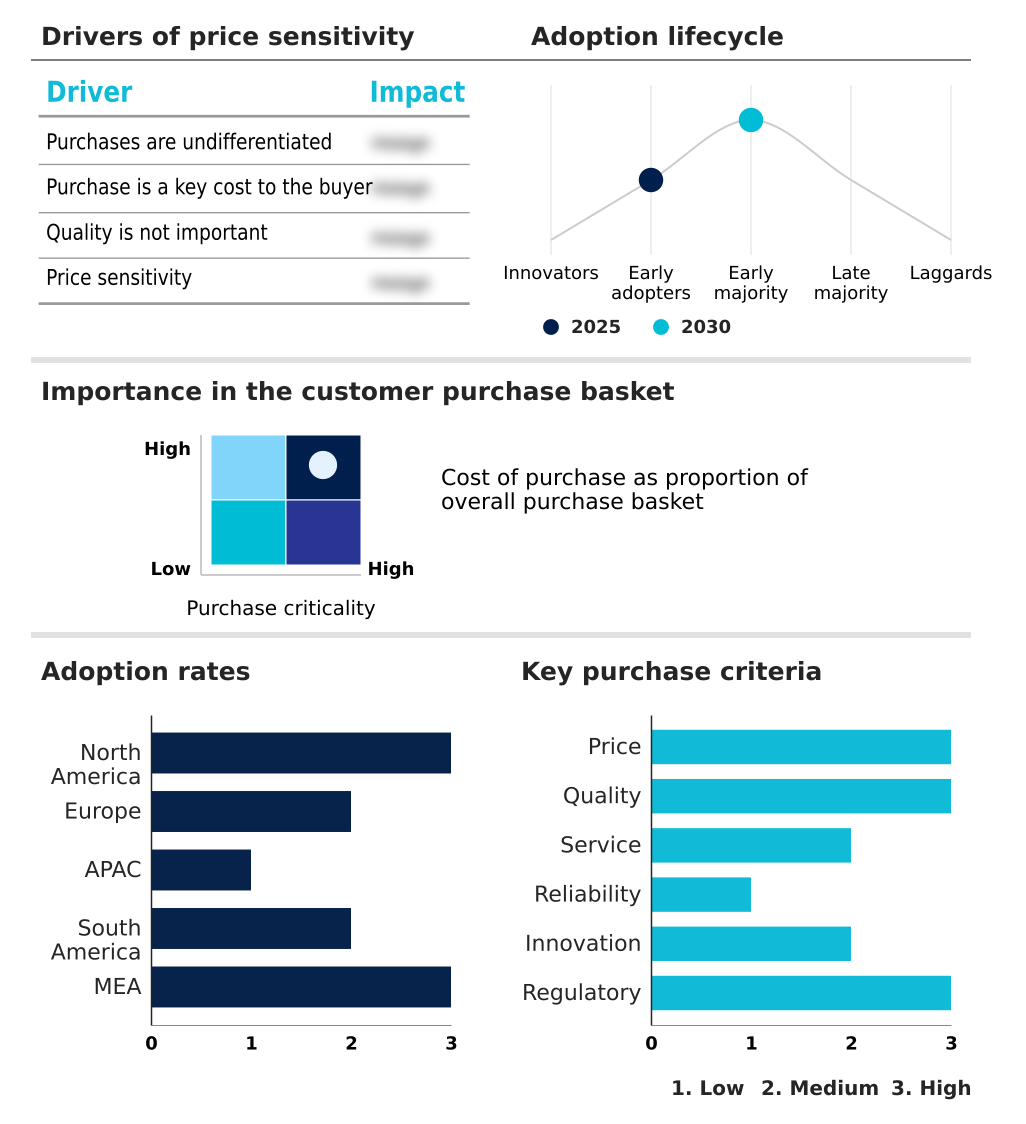
The ai agent platform market forecasting report includes the adoption lifecycle of the market, covering from the innovator’s stage to the laggard’s stage. It focuses on adoption rates in different regions based on penetration. Furthermore, the ai agent platform market report also includes key purchase criteria and drivers of price sensitivity to help companies evaluate and develop their market growth analysis strategies.
Customer Landscape of AI Agent Platform Industry
Competitive Landscape
Companies are implementing various strategies, such as strategic alliances, ai agent platform market forecast, partnerships, mergers and acquisitions, geographical expansion, and product/service launches, to enhance their presence in the industry.
Adept AI Labs Inc. - Offerings focus on integrated development platforms for creating and managing autonomous AI agents that enable advanced task automation and data-driven decision-making across enterprise functions.
The industry research and growth report includes detailed analyses of the competitive landscape of the market and information about key companies, including:
- Adept AI Labs Inc.
- Amazon Web Services Inc.
- Anthropic
- Automation Anywhere Inc.
- Botpress Inc.
- Cognigy GmbH
- Cohere
- CrewAI
- Google LLC
- IBM Corp.
- Inflection AI Inc.
- LangChain Inc.
- Microsoft Corp.
- OpenAI
- Relevance AI
- Salesforce Inc.
- ServiceNow Inc.
- UiPath Inc.
- Writer
- Zapier Inc.
Qualitative and quantitative analysis of companies has been conducted to help clients understand the wider business environment as well as the strengths and weaknesses of key industry players. Data is qualitatively analyzed to categorize companies as pure play, category-focused, industry-focused, and diversified; it is quantitatively analyzed to categorize companies as dominant, leading, strong, tentative, and weak.
Recent Development and News in Ai agent platform market
- In January, 2025, OpenAI introduced a comprehensive update to its enterprise agentic API, enhancing semantic understanding and enabling agents to maintain state across multi-month conversation threads without losing track of user preferences.
- In February, 2025, Google Cloud revealed a major infrastructure upgrade that integrated its knowledge graph with new developer tools for building grounded agentic workflows, significantly reducing the frequency of factual hallucinations in enterprise deployments.
- In March, 2025, NVIDIA Corporation announced the launch of its newest specialized hardware and software stack designed to accelerate on-device machine learning for autonomous agents in industrial environments, resulting in a 50% improvement in local processing speeds.
- In April, 2025, Microsoft Corporation announced the full-scale integration of a new single agent productivity layer across its cloud office suite, allowing users to automate complex document analysis and data visualization through a single unified interface.
Dive into Technavio’s robust research methodology, blending expert interviews, extensive data synthesis, and validated models for unparalleled AI Agent Platform Market insights. See full methodology.
| Market Scope | |
|---|---|
| Page number | 299 |
| Base year | 2025 |
| Historic period | 2020-2024 |
| Forecast period | 2026-2030 |
| Growth momentum & CAGR | Accelerate at a CAGR of 41.5% |
| Market growth 2026-2030 | USD 31458.3 million |
| Market structure | Fragmented |
| YoY growth 2025-2026(%) | 33.8% |
| Key countries | US, Canada, Mexico, Germany, UK, France, Italy, Spain, The Netherlands, China, Japan, India, South Korea, Australia, Indonesia, Brazil, Argentina, Chile, Saudi Arabia, UAE, South Africa, Israel and Turkey |
| Competitive landscape | Leading Companies, Market Positioning of Companies, Competitive Strategies, and Industry Risks |
Research Analyst Overview
- The AI agent platform market is defined by the rapid evolution of autonomous agents powered by foundational AI models with sophisticated reasoning capabilities. These intelligent automation platforms are enabling a new era of hyper-automation, where agentic workflows manage complex tasks with minimal human oversight.
- The integration of advanced machine learning and multimodal models gives these agents the cognitive depth required for dynamic problem-solving. In industrial settings, the deployment of multi-agent systems for production scheduling has yielded up to a 20% increase in overall equipment effectiveness.
- This shift toward more versatile, decentralized agentic systems is influencing boardroom decisions on product strategy, compelling a focus on creating generalist agents rather than single-purpose bots. The landscape is advancing with developments in reinforcement learning, natural language processing, and computer vision, all orchestrated through low-code interfaces.
- This makes sophisticated task automation, conversational AI, and workflow orchestration more accessible, driving wider adoption of generative AI and human-in-the-loop checkpoints to ensure reliability and trust in autonomous operations.
What are the Key Data Covered in this AI Agent Platform Market Research and Growth Report?
-
What is the expected growth of the AI Agent Platform Market between 2026 and 2030?
-
USD 31.46 billion, at a CAGR of 41.5%
-
-
What segmentation does the market report cover?
-
The report is segmented by Technology (ML, NLP, and Others), Type (Single agent systems, and Multi agent systems), End-user (Financial services, Retail and e-commerce, IT and telecommunication, Healthcare, and Others) and Geography (North America, Europe, APAC, South America, Middle East and Africa)
-
-
Which regions are analyzed in the report?
-
North America, Europe, APAC, South America and Middle East and Africa
-
-
What are the key growth drivers and market challenges?
-
Rapid advancements in foundational AI models and reasoning capabilities, Unreliability and agentic hallucinations is degrading market growth
-
-
Who are the major players in the AI Agent Platform Market?
-
Adept AI Labs Inc., Amazon Web Services Inc., Anthropic, Automation Anywhere Inc., Botpress Inc., Cognigy GmbH, Cohere, CrewAI, Google LLC, IBM Corp., Inflection AI Inc., LangChain Inc., Microsoft Corp., OpenAI, Relevance AI, Salesforce Inc., ServiceNow Inc., UiPath Inc., Writer and Zapier Inc.
-
Market Research Insights
- The AI agent platform market is characterized by intense innovation, driven by enterprise demand for autonomous operations and enhanced productivity. The development of sophisticated, agentic solutions is accelerating, with companies achieving a 50% improvement in local processing speeds for on-device machine learning through specialized hardware. This enhances the viability of digital assistants and other AI-powered automation tools.
- Furthermore, the strategic deployment of AI-driven enterprise operations has been shown to increase overall equipment effectiveness by up to 20% in industrial settings. As organizations adopt hybrid cloud platforms and intelligent virtual assistants, the focus shifts to scalable, end-to-end automation.
- This dynamic environment fosters the growth of AI application development, with LLM orchestration frameworks enabling more complex and reliable agent-based workflows.
We can help! Our analysts can customize this ai agent platform market research report to meet your requirements.
 RIA -
RIA - 
