
Ai-Based Credit Decision Engines Market Size and Growth Forecast 2026-2030
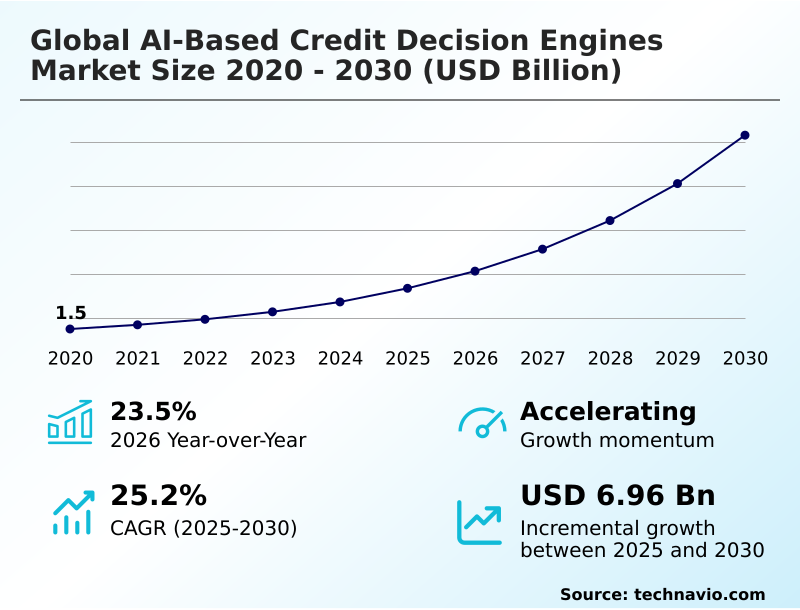
The Ai-Based Credit Decision Engines Market size was valued at USD 3.35 billion in 2025 growing at a CAGR of 25.2% during the forecast period 2026-2030.
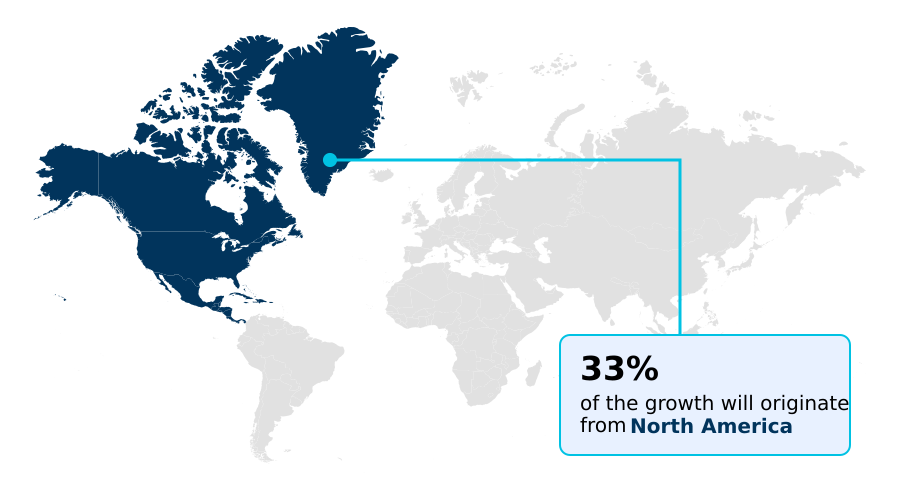
North America accounts for 33.2% of incremental growth during the forecast period. The Software segment by Component was valued at USD 1.75 billion in 2024, while the Banks segment holds the largest revenue share by End-user.
The market is projected to grow by USD 8.81 billion from 2020 to 2030, with USD 6.96 billion of the growth expected during the forecast period of 2025 to 2030.
Get Key Insights on Market Forecast (PDF) Request Free Sample
Ai-Based Credit Decision Engines Market Overview
The ai-based credit decision engines market is undergoing a fundamental transformation as financial institutions replace traditional underwriting with advanced analytical systems. This shift is driven by the need for greater accuracy in risk assessment algorithms and the capability to process non-traditional information through alternative data integration. For instance, a fintech firm specializing in microloan risk analysis can deploy machine learning models to approve loans for thin-file borrower assessment cases in seconds, a process that would be manually unfeasible. These cloud-based decision engines use predictive analytics to construct comprehensive borrower profiles, leading to a significant reduction in default rates. With North America accounting for 33.2% of the market's incremental growth, the adoption of automated underwriting and explainable ai (xai) is becoming a standard for maintaining competitive advantage. The focus on hyper-personalization and dynamic limit management, supported by robust portfolio management tools and data aggregation services, ensures that lending practices are both more efficient and inclusive, adhering to complex regulatory compliance frameworks.
Drivers, Trends, and Challenges in the Ai-Based Credit Decision Engines Market
The practical application of AI in lending is expanding into highly specialized areas, moving beyond simple credit checks. For instance, AI for small business loan approval now involves complex algorithms that analyze supply chain data and payment histories, giving lenders a more holistic view of risk. Similarly, machine learning in mortgage origination is transforming a traditionally paper-intensive process.
A typical mortgage lender using AI can reduce underwriting time from weeks to just a few days by automating document verification and risk assessment. Another key area is using alternative data for credit risk, which is critical for assessing borrowers with limited credit histories.
This practice, however, requires strict adherence to regulations like the Fair Credit Reporting Act (FCRA) to ensure fairness. The demand for explainable AI in consumer lending decisions is also surging, as regulators and consumers alike demand transparency in how automated systems arrive at conclusions.
For fintechs, automating credit checks for fintechs is not just an efficiency play but a core part of their business model, enabling them to offer instant, competitive loan products. This level of automation is essential for managing the high volume of applications common in the digital lending space.
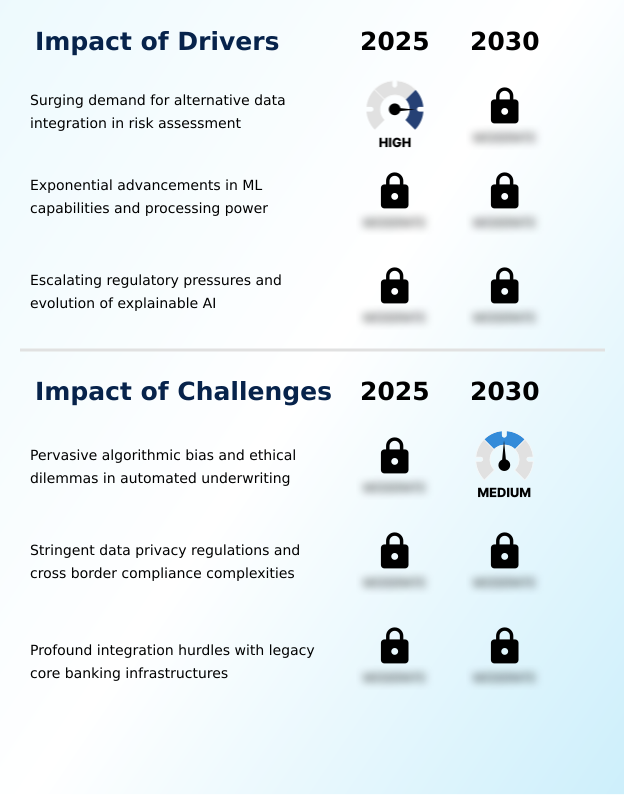
Primary Growth Driver: A surging demand for integrating alternative data into risk assessment protocols is a key market driver, enabling more comprehensive evaluations and expanding financial inclusion.
The market's expansion is fundamentally driven by the dual forces of technological progress and the strategic need for financial inclusion.
Exponential advancements in machine learning models and computational power have made large-scale predictive analytics economically viable for institutions of all sizes. This enables superior default prediction models and real-time fraud detection systems.
A significant driver is the surging demand for alternative data integration, which allows for accurate thin-file borrower assessment. Open banking frameworks, mandated by regulations in regions like Europe, further catalyze this by providing secure data aggregation services.
Moreover, the evolution of explainable AI (XAI) has turned a regulatory hurdle into a growth driver, allowing firms to deploy complex neural network models while maintaining transparency and adhering to stringent regulatory compliance frameworks.
Emerging Market Trend: The proliferation of embedded finance and point-of-sale credit solutions is a primary market trend, necessitating AI systems capable of instantaneous credit evaluation within integrated consumer checkout journeys.
Key market trends are moving beyond basic automation toward intelligent, dynamic risk management. The hyper-personalization of credit offerings, driven by advanced behavioral analytics, allows lenders to tailor interest rates and repayment schedules to individual risk profiles, significantly boosting customer retention strategies.
Simultaneously, the shift to dynamic limit management, where credit lines are adjusted in real-time based on a borrower's financial health, helps in non-performing loan reduction. This is enabled by machine learning models that continuously monitor transactional data.
The proliferation of embedded finance solutions and point-of-sale financing has made real-time credit decisioning a necessity, particularly for fintech companies, whose market segment shows the fastest growth. These trends highlight the increasing reliance on sophisticated portfolio management tools and robust API integration to deliver seamless and responsive lending experiences.
Key Industry Challenge: Pervasive algorithmic bias and the associated ethical dilemmas in automated underwriting present a key challenge, impacting market acceptance and creating complex regulatory hurdles.
Significant challenges constrain market growth, primarily stemming from ethical, regulatory, and technical complexities. Pervasive algorithmic bias, rooted in historical data, presents a major hurdle, requiring sophisticated algorithmic bias mitigation techniques to ensure fair lending compliance.
Strict data privacy protocols, such as the GDPR in lending in Europe, create high compliance costs and operational hurdles, particularly for cross-border data processing and machine unlearning techniques. The most profound technical barrier is the challenge of legacy system integration.
Many large banks operate on antiquated core banking infrastructure that is incompatible with modern, cloud-based decision engines, making digital transformation in lending a costly and high-risk endeavor. Overcoming this requires significant investment to re-architect systems for seamless API integration, a task that slows widespread adoption.
Explore Full Market Dynamics Analysis Request Free Sample
Ai-Based Credit Decision Engines Market Segmentation
The ai-based credit decision engines industry research report provides comprehensive data including region-wise segment analysis, with forecasts and analysis for the period 2026-2030, as well as historical data from 2020-2024 for the following segments.
Component Segment Analysis
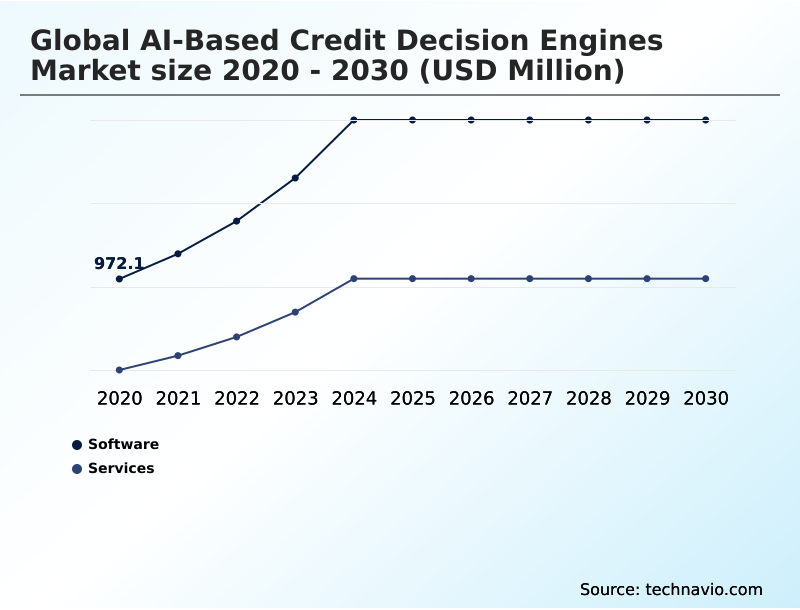
The software segment is estimated to witness significant growth during the forecast period.
The software component is the core of the global AI-based credit decision engines market, encompassing the risk assessment algorithms and machine learning models that power automated underwriting.
These platforms are crucial for financial institutions looking to enhance the accuracy of default prediction models through predictive analytics and alternative data integration.
The architecture of these cloud-based decision engines facilitates real-time credit decisioning, which is a critical capability for modern lenders.
This segment's offerings enable a shift from traditional scoring to more dynamic evaluations, with software accounting for a significant 64% of the market in 2025.
Effective API integration allows these systems to function within diverse banking ecosystems, driving efficiency in loan origination software and overall credit lifecycle management.
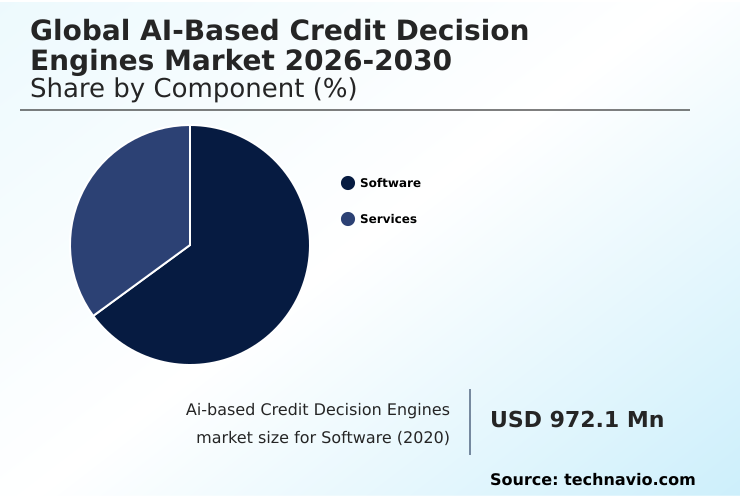
The Software segment was valued at USD 1.75 billion in 2024 and showed a gradual increase during the forecast period.
Ai-Based Credit Decision Engines Market by Region: North America Leads with 33.2% Growth Share
North America is estimated to contribute 33.2% to the growth of the global market during the forecast period.
The geographic landscape reveals a tale of two distinct market trajectories.
North America, while the most mature market, continues to command the largest share of incremental growth at 33.2%, driven by deep investment in legacy system integration and advanced fraud detection systems.
In contrast, the APAC region, with the highest CAGR of 26.5%, is a hotbed for innovation, particularly in underbanked population scoring and mobile-first embedded finance solutions.
Europe's market evolution is heavily shaped by regulatory compliance frameworks like the open banking directive, which mandates sophisticated data privacy protocols and explainable AI (XAI) for all credit scoring platforms.
This regional divergence requires vendors to offer highly adaptable cloud-based decision engines that can be configured for local data standards, such as Australia's Consumer Data Right (CDR), and specific market needs like Sharia-compliant financing models in the Middle East.
Customer Landscape Analysis for the Ai-Based Credit Decision Engines Market
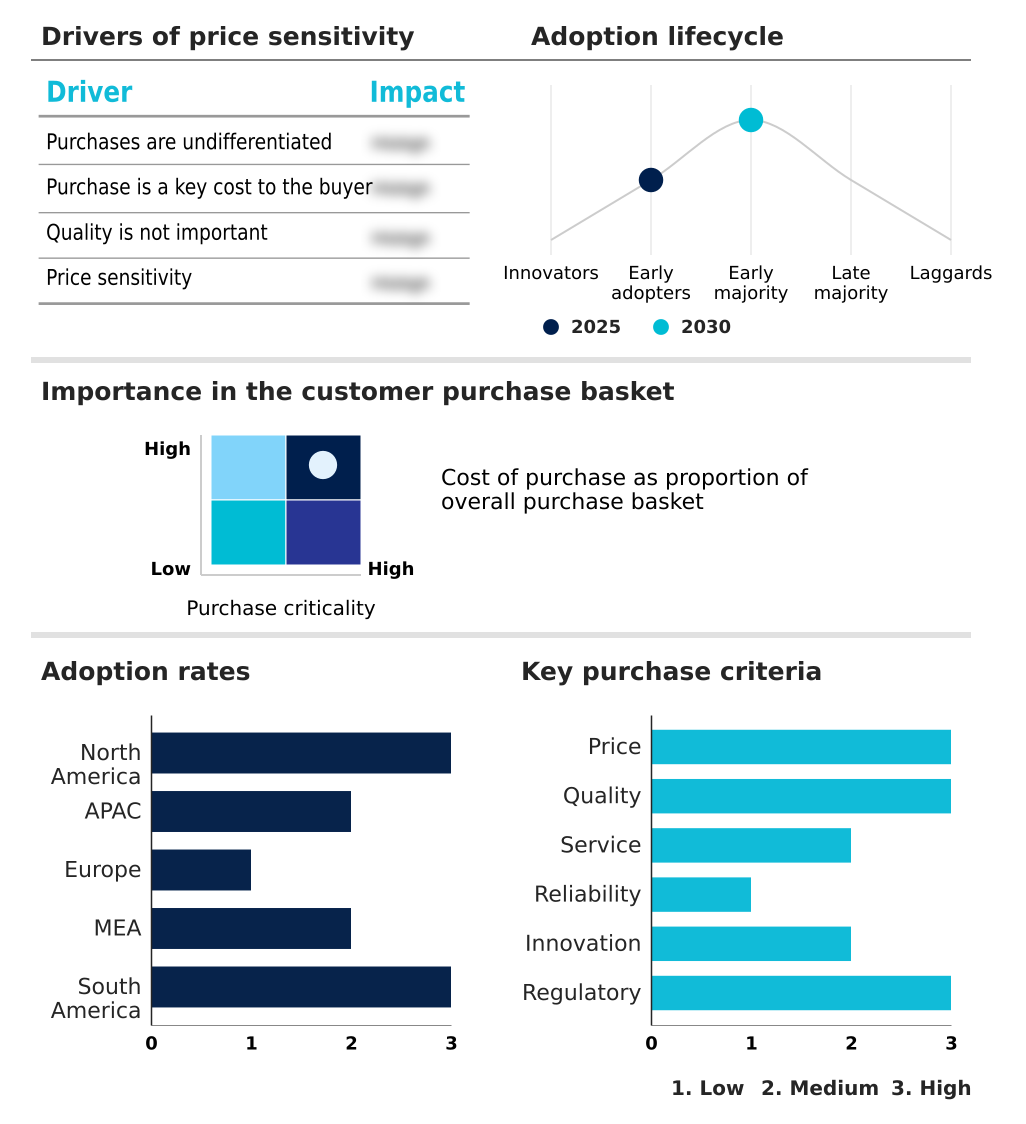
The ai-based credit decision engines market forecasting report includes the adoption lifecycle of the market, covering from the innovator’s stage to the laggard’s stage. It focuses on adoption rates in different regions based on penetration. Furthermore, the ai-based credit decision engines market report also includes key purchase criteria and drivers of price sensitivity to help companies evaluate and develop their market growth analysis strategies.
Competitive Landscape of the Ai-Based Credit Decision Engines Market
Companies are implementing various strategies, such as strategic alliances, partnerships, mergers and acquisitions, geographical expansion, and product/service launches, to enhance their presence in the ai-based credit decision engines market industry.
Equifax Inc. - Delivers explainable AI-powered credit scoring engines, leveraging neural network models to enhance risk assessment accuracy and automate loan origination decisions for financial institutions.
The industry research and growth report includes detailed analyses of the competitive landscape of the market and information about key companies, including:
- Equifax Inc.
- Experian Plc
- Fair Isaac Corp.
- Finastra
- GDS Link
- Juris Technologies Sdn Bhd
- LenddoEFL
- Moodys Corp.
- Oracle Corp.
- Provenir Group
- SAS Institute Inc.
- Scienaptic Systems India Pvt. Ltd.
- Stratyfy
- SVM Ventures LLC
- Temenos AG
- TransUnion
- Trust Science
- Turnkey Lender
- Upstart Network Inc.
- ZestFinance Inc.
Qualitative and quantitative analysis of companies has been conducted to help clients understand the wider business environment as well as the strengths and weaknesses of key industry players. Data is qualitatively analyzed to categorize companies as pure play, category-focused, industry-focused, and diversified; it is quantitatively analyzed to categorize companies as dominant, leading, strong, tentative, and weak.
Recent Developments in the Ai-Based Credit Decision Engines Market
- In January 2025, NETSOL Technologies introduced Check AI, an AI-native credit decisioning engine designed to automate underwriting by transforming multi-source financial data into real-time credit evaluations.
- In March 2025, CARD91 unveiled an AI-driven UPI credit scoring engine in India, aimed at enhancing underwriting accuracy for thin-file and new-to-credit segments using real-time transaction data.
- In July 2025, Plaid introduced an AI-enabled lending solution designed to enhance credit decisioning precision by integrating real-time cash flow insights and network-level data with conventional credit score inputs.
- In October 2025, Perfios partnered with National e-Governance Services Ltd (NeSL) to enhance lender risk monitoring capabilities, using AI-powered data analytics to provide early warning signals of borrower stress.
Research Analyst Overview: Ai-Based Credit Decision Engines Market
The market is accelerating at a 23.5% year-over-year rate, a momentum sustained by the strategic imperative for financial institutions to overhaul legacy credit evaluation processes. Boardroom decisions are increasingly focused on allocating capital toward deploying sophisticated AI-based credit decision engines, which are no longer a competitive edge but a baseline requirement for operational viability.
The adoption of machine learning models for predictive analytics and automated underwriting is critical for managing risk in a volatile economic climate. Key technologies like explainable AI (XAI) and algorithmic bias mitigation are central to navigating complex regulatory compliance frameworks, such as the Equal Credit Opportunity Act.
For procurement decision-makers, the choice between on-premises deployment and cloud-based decision engines involves a trade-off between control and scalability. The ability of these systems to perform real-time credit decisioning using alternative data integration through secure API integration is reshaping credit lifecycle management.
Firms must invest in robust portfolio management tools and data aggregation services to support these platforms, ensuring both profitability and adherence to stringent data privacy protocols.
Dive into Technavio’s robust research methodology, blending expert interviews, extensive data synthesis, and validated models for unparalleled Ai-Based Credit Decision Engines Market insights. See full methodology.
| Market Scope | |
|---|---|
| Page number | 292 |
| Base year | 2025 |
| Historic period | 2020-2024 |
| Forecast period | 2026-2030 |
| Growth momentum & CAGR | Accelerate at a CAGR of 25.2% |
| Market growth 2026-2030 | USD 6963.9 million |
| Market structure | Fragmented |
| YoY growth 2025-2026(%) | 23.5% |
| Key countries | US, Canada, Mexico, China, India, Japan, South Korea, Australia, Indonesia, Germany, UK, France, Italy, The Netherlands, Spain, Saudi Arabia, UAE, South Africa, Israel, Turkey, Brazil, Argentina and Colombia |
| Competitive landscape | Leading Companies, Market Positioning of Companies, Competitive Strategies, and Industry Risks |
Ai-Based Credit Decision Engines Market: Key Questions Answered in This Report
-
What is the expected growth of the Ai-Based Credit Decision Engines Market between 2026 and 2030?
-
The Ai-Based Credit Decision Engines Market is expected to grow by USD 6.96 billion during 2026-2030, registering a CAGR of 25.2%. Year-over-year growth in 2026 is estimated at 23.5%%. This acceleration is shaped by surging demand for alternative data integration in risk assessment, which is intensifying demand across multiple end-use verticals covered in the report.
-
-
What segmentation does the market report cover?
-
The report is segmented by Component (Software, and Services), End-user (Banks, Fintech companies, Credit unions, and Others), Deployment (Cloud-based, and On-premises) and Geography (North America, APAC, Europe, Middle East and Africa, South America). Among these, the Software segment is estimated to witness significant growth during the forecast period, driven by rising adoption across key application areas. Each segment includes detailed qualitative and quantitative analysis, along with historical data from 2020-2024 and forecasts through 2030 with year-over-year growth rates.
-
-
Which regions are analyzed in the report?
-
The report covers North America, APAC, Europe, Middle East and Africa and South America. North America is estimated to contribute 33.2% to market growth during the forecast period. Country-level analysis includes US, Canada, Mexico, China, India, Japan, South Korea, Australia, Indonesia, Germany, UK, France, Italy, The Netherlands, Spain, Saudi Arabia, UAE, South Africa, Israel, Turkey, Brazil, Argentina and Colombia, with dedicated market size tables and year-over-year growth for each.
-
-
What are the key growth drivers and market challenges?
-
The primary driver is surging demand for alternative data integration in risk assessment, which is accelerating investment and industry demand. The main challenge is pervasive algorithmic bias and ethical dilemmas in automated underwriting, creating operational barriers for key market participants. The report quantifies the impact of each driver and challenge across 2026 and 2030 with comparative analysis.
-
-
Who are the major players in the Ai-Based Credit Decision Engines Market?
-
Key vendors include Equifax Inc., Experian Plc, Fair Isaac Corp., Finastra, GDS Link, Juris Technologies Sdn Bhd, LenddoEFL, Moodys Corp., Oracle Corp., Provenir Group, SAS Institute Inc., Scienaptic Systems India Pvt. Ltd., Stratyfy, SVM Ventures LLC, Temenos AG, TransUnion, Trust Science, Turnkey Lender, Upstart Network Inc. and ZestFinance Inc.. The report provides qualitative and quantitative analysis categorizing companies as dominant, leading, strong, tentative, and weak based on their market positioning. Company profiles include business segment analysis, SWOT assessment, key offerings, and recent strategic developments.
-
Ai-Based Credit Decision Engines Market Research Insights
Market dynamics are shaped by a dual push from regulatory mandates and technological advancement. Frameworks such as the Equal Credit Opportunity Act (ECOA) in the United States and GDPR in lending across Europe compel institutions to adopt fair lending compliance and robust data privacy protocols.
This has accelerated the digital transformation in lending, with a focus on know your customer (kyc) automation and anti-money laundering (aml) screening. The expansion of open banking data utilization allows for more precise commercial credit evaluation and mortgage underwriting automation.
Operationally, the software segment commands a market share nearly double that of services, highlighting the capital investment priority in core algorithmic capabilities. This tech-first approach is essential for enabling point-of-sale financing and embedded finance solutions, which depend on real-time decisioning.
We can help! Our analysts can customize this ai-based credit decision engines market research report to meet your requirements.
 RIA -
RIA - 
