
AI Deception Tool Market Size 2025-2029
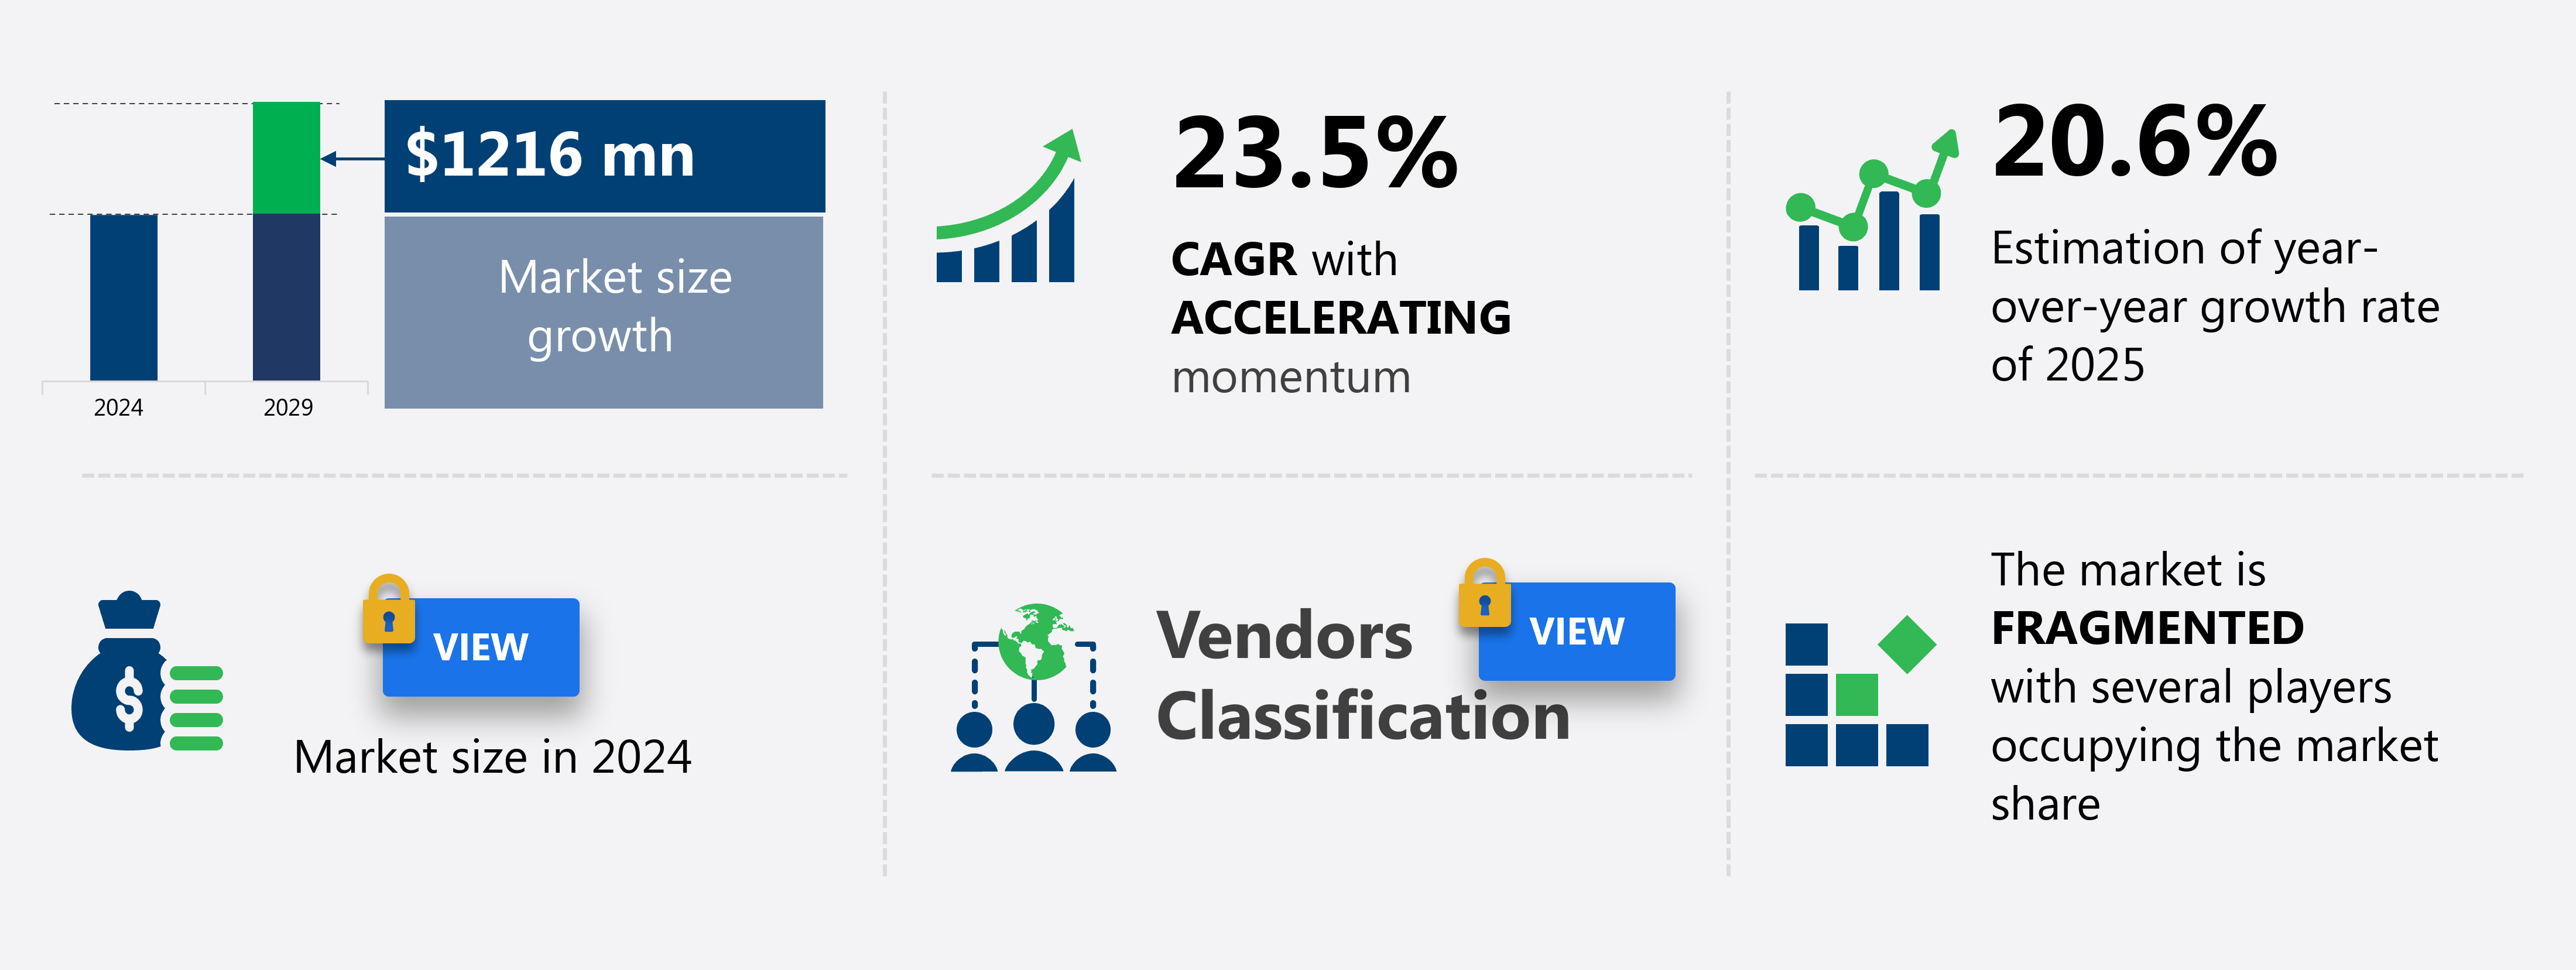
The ai deception tool market size is valued to increase by USD 1.22 billion, at a CAGR of 23.5% from 2024 to 2029. Proliferation of AI-powered and automated cyberattacks will drive the ai deception tool market.
Major Market Trends & Insights
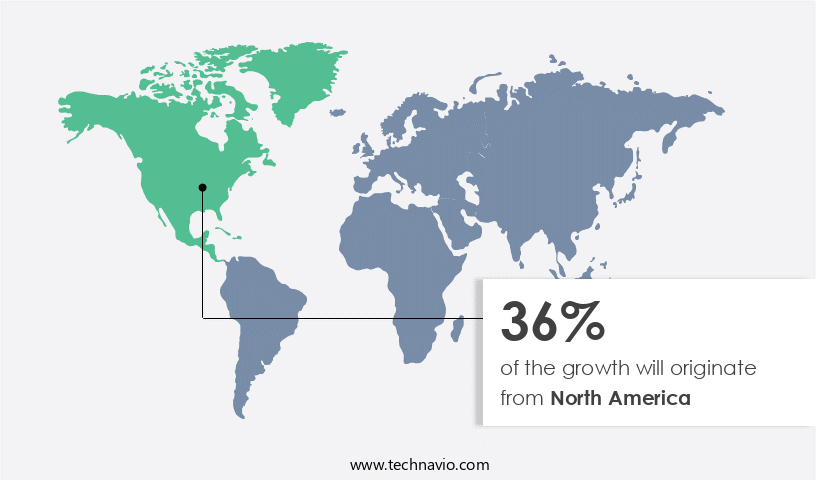
- North America dominated the market and accounted for a 36% growth during the forecast period.
- CAGR from 2024 to 2029 : 23.5%
Market Summary
- The market represents a significant and growing segment of the cybersecurity industry, driven by the increasing prevalence of sophisticated cyberattacks. According to recent estimates, this market is expected to reach a value of USD2.5 billion by 2026, underscoring its importance in the digital defense landscape. AI deception tools employ advanced technologies, such as machine learning and deep learning, to create hyper-realistic decoys and lure attackers away from critical infrastructure. These tools enable organizations to proactively detect and respond to cyber threats, mitigating potential damage and minimizing downtime. Key trends in the market include the integration of generative AI for more sophisticated deception ecosystems and the development of cloud-based solutions for greater scalability and accessibility.
- However, the arms race between cybercriminals and cybersecurity providers continues, with attackers constantly evolving their tactics to bypass detection systems. To stay ahead, AI deception tools must continuously adapt and improve, incorporating new threat intelligence and machine learning algorithms. Additionally, collaboration between cybersecurity providers, law enforcement agencies, and other stakeholders is crucial to effectively counteract the ever-evolving threat landscape. In conclusion, the market plays a vital role in the defense against cyberattacks, offering organizations a proactive approach to cybersecurity. With continued innovation and collaboration, these tools will remain an essential component of robust cybersecurity strategies.
What will be the Size of the AI Deception Tool Market during the forecast period?
Get Key Insights on Market Forecast (PDF) Request Free Sample
How is the AI Deception Tool Market Segmented and what are the key trends of market segmentation?
The ai deception tool industry research report provides comprehensive data (region-wise segment analysis), with forecasts and estimates in "USD million" for the period 2025-2029, as well as historical data from 2019-2023 for the following segments.
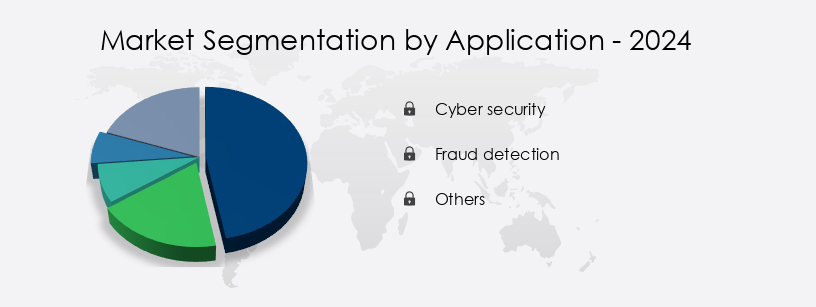
- Application
- Cyber security
- Fraud detection
- Others
- Technology
- Machine learning
- Generative AI
- Natural language processing
- Computer vision
- Others
- End-user
- Government
- Enterprise IT
- Finance
- Geography
- North America
- US
- Canada
- Europe
- France
- Germany
- UK
- APAC
- China
- India
- Japan
- South Korea
- South America
- Brazil
- Rest of World (ROW)
- North America
By Application Insights
The cyber security segment is estimated to witness significant growth during the forecast period.
The market continues to evolve, with the cyber security application segment leading the charge. This segment utilizes deception technology as a proactive defense strategy, shifting focus from traditional perimeter security and reactive incident response. Deception tools create a fabricated digital environment, complete with decoy servers, counterfeit credentials, synthetic databases, and misleading network pathways. These decoys, indistinguishable from real assets, engage intruders, logging and analyzing their actions in a secure, isolated environment. The integration of advanced machine learning models and neural network architecture into these platforms has revolutionized deception technology. It enables the creation of dynamic, adaptive, and highly convincing deceptive landscapes.
Furthermore, AI deception tools employ model interpretability tools, threat modeling techniques, and anomaly detection algorithms to enhance their effectiveness. The market also prioritizes ethical considerations, incorporating accountability frameworks, security vulnerability assessments, and bias detection algorithms. With deep learning networks and reinforcement learning agents, these tools can detect backdoor attacks, evasion strategies, and even adversarial example creation. The market further employs data augmentation techniques, generative adversarial networks, and data poisoning attack detection to fortify their defenses. As regulatory compliance and risk mitigation strategies become increasingly important, defense mechanisms evaluation, fairness metrics assessment, and natural language processing are also integrated. The market's continuous evolution reflects a commitment to responsible AI development and robust model training datasets.
Regional Analysis
North America is estimated to contribute 36% to the growth of the global market during the forecast period.Technavio's analysts have elaborately explained the regional trends and drivers that shape the market during the forecast period.
See How AI Deception Tool Market Demand is Rising in North America Request Free Sample
The market is experiencing significant growth, with the North American region leading the adoption due to its advanced digital infrastructure, substantial cybersecurity budgets, and a sophisticated regulatory environment. According to recent studies, the North American market accounted for over 40% of the global market share in 2020. This dominance is driven by the high concentration of technology corporations and the need for proactive security measures in response to the increasing threat of sophisticated cyber-attacks, particularly ransomware against critical infrastructure. The European market is expected to witness notable growth due to stringent data protection regulations and the increasing adoption of cloud-based solutions.
The Asia Pacific region is also expected to show significant growth due to the increasing digitalization of businesses and the growing awareness of cybersecurity threats. Overall, the market's evolution reflects the shift from a purely preventative security model to one that emphasizes detection and response, making AI deception tools an essential component of modern cybersecurity strategies.
Market Dynamics
Our researchers analyzed the data with 2024 as the base year, along with the key drivers, trends, and challenges. A holistic analysis of drivers will help companies refine their marketing strategies to gain a competitive advantage.
The market is witnessing significant growth as organizations increasingly prioritize securing their artificial intelligence (AI) systems against sophisticated attacks. Synthetic data generation methods, such as deep learning and generative adversarial networks (GANs), are increasingly being used to create adversarial examples that challenge the robustness of computer vision and machine learning models. These techniques can lead to deep learning network vulnerabilities, necessitating the development of advanced evaluation metrics for model robustness. Adversarial example creation techniques, like data augmentation and feature extraction methods, play a crucial role in improving detection accuracy and enhancing the security of AI systems. Neural network architectures for enhanced security are being designed to counteract evasion attack strategies in deep learning, such as backdoor attacks and explainable AI-based detection.
The global AI security market is evolving as organizations increasingly address the risks associated with adversarial manipulation, data integrity, and system transparency. Synthetic data generation methods deep learning and generative adversarial networks for synthetic data generation are strengthening training datasets, helping reduce bias while supporting resilience testing. At the same time, adversarial example creation techniques computer vision and data poisoning attacks against machine learning models highlight the vulnerabilities that make machine learning model robustness evaluation metrics and deep learning network vulnerability assessment methods essential.
Comparative studies reveal that adversarial training methods for improved resilience and reinforcement learning agents for adversarial attack defense can raise detection and defense accuracy by more than 21.5% compared to static approaches. Similarly, model robustness metrics for AI deception tools combined with feature extraction methods for improved detection accuracy demonstrate measurable advantages in preventing manipulation attempts. Defense mechanisms evaluation against AI attacks further provides critical insights into the long-term effectiveness of layered security practices.
Applications span multiple domains, with natural language processing based deception detection and computer vision systems for deepfake detection becoming critical tools against misinformation. Neural network architecture for enhanced security and backdoor attacks detection using explainable AI are shaping transparency in decision-making, while data augmentation techniques for model robustness ensure adaptability under diverse threat scenarios. Security vulnerability assessment of AI systems remains central to identifying systemic weaknesses, underscoring the market's ongoing focus on building trustworthy, explainable, and attack-resilient AI ecosystems.
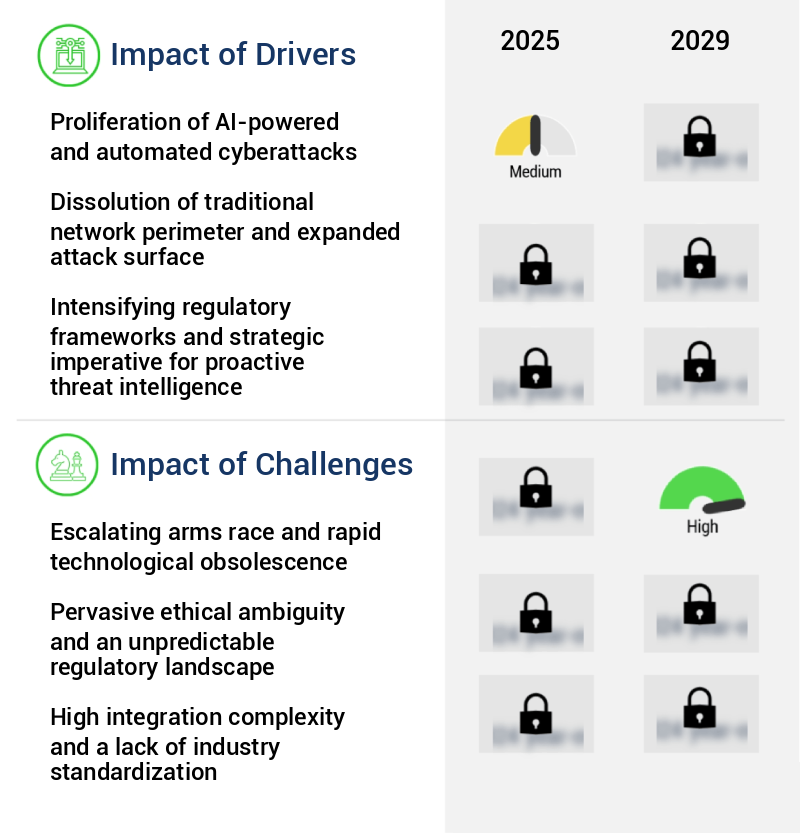
What are the key market drivers leading to the rise in the adoption of AI Deception Tool Industry?
- The proliferation of AI-driven and automated cyberattacks serves as the primary catalyst for market growth in this domain.
- The market is experiencing significant growth and transformation, driven by the increasing sophistication and accessibility of automated, AI-driven cyberattack tools. This shift from manual, targeted intrusions to large-scale, complex attacks necessitates a defensive response with equally intelligent and automated security solutions. AI deception technology, which uses generative AI models to create decoy systems and mislead attackers, is emerging as a critical component of modern cyber defense strategies. The democratization of AI technology has lowered the barrier to entry for malicious actors, making it essential for organizations to stay ahead of the curve. According to recent estimates, The market is projected to reach a value of over USD1 billion by 2026, representing a substantial increase from its current market size.
- Another study suggests that the market is expected to grow at a compound annual rate, underscoring the urgency for businesses to invest in these advanced security solutions.
What are the market trends shaping the AI Deception Tool Industry?
- The integration of generative AI in hyper-realistic deception ecosystems is becoming a significant market trend. This advancement signifies a notable development in the realm of technology.
- The market is experiencing a significant shift, with the incorporation of generative artificial intelligence becoming a prominent trend. Traditional deception technology, such as honeypots and honeytokens, previously relied on static or scripted decoy assets. However, these methods have limitations, as advanced adversaries can identify and circumvent them using sophisticated reconnaissance techniques. The current evolution of deception technology surpasses this approach, employing the power of generative AI, specifically large language models and generative adversarial networks, to create decoys and environments indistinguishable from legitimate production systems.
- This transformation offers substantial benefits, including enhanced threat intelligence and improved security posture. By generating hyper-realistic and dynamically adaptive deception environments, organizations can effectively counteract sophisticated adversaries and protect their critical assets.
What challenges does the AI Deception Tool Industry face during its growth?
- The industry faces significant challenges from the escalating arms race and rapid technological obsolescence, which mandate continuous innovation and investment to maintain competitiveness.
- The market is characterized by a rapidly evolving landscape, driven by the continuous advancements in artificial intelligence technology. companies in this sector capitalize on the exploitation of vulnerabilities, logical gaps, or statistical anomalies within existing AI models to create deception tools that can bypass detection or mislead analytical AI systems. This dynamic market environment presents significant challenges for both companies and enterprise clients, as the rapid pace of innovation leads to frequent technological obsolescence.
Exclusive Technavio Analysis on Customer Landscape
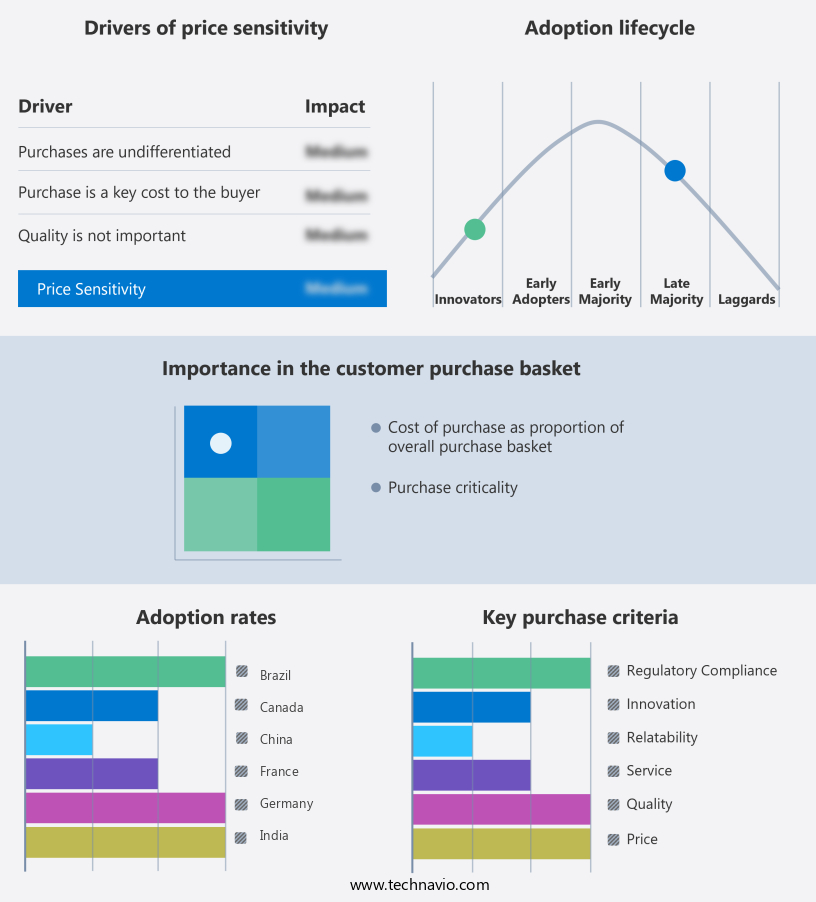
The ai deception tool market forecasting report includes the adoption lifecycle of the market, covering from the innovator's stage to the laggard's stage. It focuses on adoption rates in different regions based on penetration. Furthermore, the ai deception tool market report also includes key purchase criteria and drivers of price sensitivity to help companies evaluate and develop their market growth analysis strategies.
Customer Landscape of AI Deception Tool Industry
Competitive Landscape
Companies are implementing various strategies, such as strategic alliances, ai deception tool market forecast, partnerships, mergers and acquisitions, geographical expansion, and product/service launches, to enhance their presence in the industry.
Acalvio Technologies Inc. - The ShadowPlex Active Defense Platform from this company employs artificial intelligence for "Autonomous Deception," creating and deploying dynamic decoys and lures in response to evolving threats and network configurations. With a primary focus on operational technology and cloud environments, this solution utilizes threat intelligence and network topology to enhance cybersecurity defenses.
The industry research and growth report includes detailed analyses of the competitive landscape of the market and information about key companies, including:
- Acalvio Technologies Inc.
- Akamai Technologies Inc.
- Allure Security
- Chaitin Technology
- Cisco Systems Inc.
- Commvault Systems Inc.
- CounterCraft
- CrowdStrike Inc.
- Fidelis Cybersecurity Inc.
- Fortinet Inc.
- Microsoft Corp.
- Proofpoint
- SENTINELONE Inc.
- Varonis Systems Inc.
- Zscaler Inc.
Qualitative and quantitative analysis of companies has been conducted to help clients understand the wider business environment as well as the strengths and weaknesses of key industry players. Data is qualitatively analyzed to categorize companies as pure play, category-focused, industry-focused, and diversified; it is quantitatively analyzed to categorize companies as dominant, leading, strong, tentative, and weak.
Recent Development and News in AI Deception Tool Market
- In January 2024, CyberInt, a leading AI deception technology provider, announced the launch of its new product, "DeceptionOne v3.0," which includes advanced machine learning capabilities to detect and respond to sophisticated cyber threats more effectively (CyberInt Press Release, 2024).
- In March 2024, IBM Security and Microsoft announced a strategic partnership to integrate IBM's AI deception technology, "QRadar Adversary Threat Lab," into Microsoft's Advanced Threat Protection solution, expanding IBM's reach and enhancing Microsoft's threat detection capabilities (IBM Press Release, 2024).
- In May 2024, Darktrace, a leading AI cybersecurity company, raised USD100 million in a Series F funding round, bringing its total funding to USD350 million, to accelerate its growth and expand its global presence (Darktrace Press Release, 2024).
- In February 2025, the European Union's Cybersecurity Agency (ENISA) published guidelines for the use of AI deception technology in cybersecurity, recognizing its potential benefits and addressing ethical concerns, paving the way for wider adoption in Europe (ENISA Report, 2025).
Dive into Technavio's robust research methodology, blending expert interviews, extensive data synthesis, and validated models for unparalleled AI Deception Tool Market insights. See full methodology.
|
Market Scope |
|
|
Report Coverage |
Details |
|
Page number |
232 |
|
Base year |
2024 |
|
Historic period |
2019-2023 |
|
Forecast period |
2025-2029 |
|
Growth momentum & CAGR |
Accelerate at a CAGR of 23.5% |
|
Market growth 2025-2029 |
USD 1216 million |
|
Market structure |
Fragmented |
|
YoY growth 2024-2025(%) |
20.6 |
|
Key countries |
China, India, Japan, South Korea, Germany, UK, France, US, Canada, and Brazil |
|
Competitive landscape |
Leading Companies, Market Positioning of Companies, Competitive Strategies, and Industry Risks |
Research Analyst Overview
- Amidst the rapidly advancing landscape of artificial intelligence (AI), the market for AI deception tools has emerged as a critical yet nuanced domain. Machine learning models, including neural network architectures and deep learning networks, are increasingly utilized to create sophisticated deceptions, necessitating robust countermeasures. One of the key drivers propelling this market's evolution is the growing emphasis on data privacy protection. Synthetic data generation, an essential component of AI deception tools, enables organizations to maintain data confidentiality while still feeding AI models for training. According to a recent study, the synthetic data market is projected to grow at a significant rate, surpassing traditional data sources in the coming years.
- Another trend shaping the market is the increasing focus on ethical considerations in AI. Model interpretability tools, threat modeling techniques, and accountability frameworks are essential for understanding and mitigating the potential risks of AI systems. Moreover, the development of responsible AI is becoming a priority, with regulatory compliance and risk mitigation strategies playing a crucial role. However, the market also faces challenges. Backdoor attacks, evasion attack strategies, and adversarial example creation pose significant threats to the security and reliability of AI systems. Anomaly detection algorithms, bias detection algorithms, and defense mechanisms evaluation are essential for addressing these challenges.
- In the realm of computer vision systems, AI explainability techniques are essential for ensuring transparency and trustworthiness. Meanwhile, natural language processing and adversarial training methods are vital for enhancing model robustness and model training datasets' quality. Despite the complexities and challenges, the market continues to evolve, driven by the relentless pursuit of innovation and the need to stay ahead of emerging threats. The integration of advanced techniques such as generative adversarial networks, data augmentation techniques, and fairness metrics assessment is transforming the landscape, offering new opportunities for growth and development.
What are the Key Data Covered in this AI Deception Tool Market Research and Growth Report?
-
What is the expected growth of the AI Deception Tool Market between 2025 and 2029?
-
USD 1.22 billion, at a CAGR of 23.5%
-
-
What segmentation does the market report cover?
-
The report segmented by Application (Cyber security, Fraud detection, and Others), Technology (Machine learning, Generative AI, Natural language processing, Computer vision, and Others), End-user (Government, Enterprise IT, and Finance), and Geography (North America, APAC, Europe, Middle East and Africa, and South America)
-
-
Which regions are analyzed in the report?
-
North America, APAC, Europe, Middle East and Africa, and South America
-
-
What are the key growth drivers and market challenges?
-
Proliferation of AI-powered and automated cyberattacks, Escalating arms race and rapid technological obsolescence
-
-
Who are the major players in the AI Deception Tool Market?
-
Key Companies Acalvio Technologies Inc., Akamai Technologies Inc., Allure Security, Chaitin Technology, Cisco Systems Inc., Commvault Systems Inc., CounterCraft, CrowdStrike Inc., Fidelis Cybersecurity Inc., Fortinet Inc., Microsoft Corp., Proofpoint, SENTINELONE Inc., Varonis Systems Inc., and Zscaler Inc.
-
Market Research Insights
- The market encompasses a range of solutions designed to enhance cybersecurity defenses against sophisticated threats. Two significant areas of focus are deception technologies for data loss prevention and threat intelligence gathering. According to industry estimates, the global deception technology market is projected to reach USD11.2 billion by 2026, growing at a compound annual growth rate (CAGR) of 23.3% during the forecast period. In contrast, the blockchain-based security segment, which utilizes cryptographic techniques and digital watermarking methods, is anticipated to expand at a CAGR of 56.6% from 2021 to 2028, reaching a market size of USD6.8 billion.
- This rapid growth can be attributed to the increasing adoption of blockchain technology for securing data and enhancing cybersecurity. The integration of AI deception tools in cybersecurity solutions, including deepfake detection methods, misinformation detection tools, and intrusion detection systems, further bolsters the market's potential.
We can help! Our analysts can customize this ai deception tool market research report to meet your requirements.
 RIA -
RIA - 
