
AI Edge Computing Market Size 2025-2029
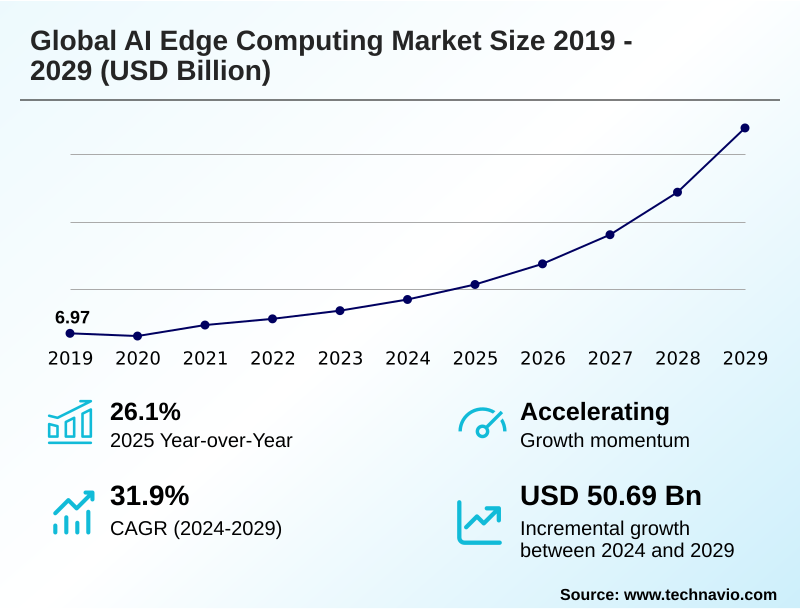
The ai edge computing market size is valued to increase by USD 50.69 billion, at a CAGR of 31.9% from 2024 to 2029. Proliferation of edge AI devices will drive the ai edge computing market.
Major Market Trends & Insights
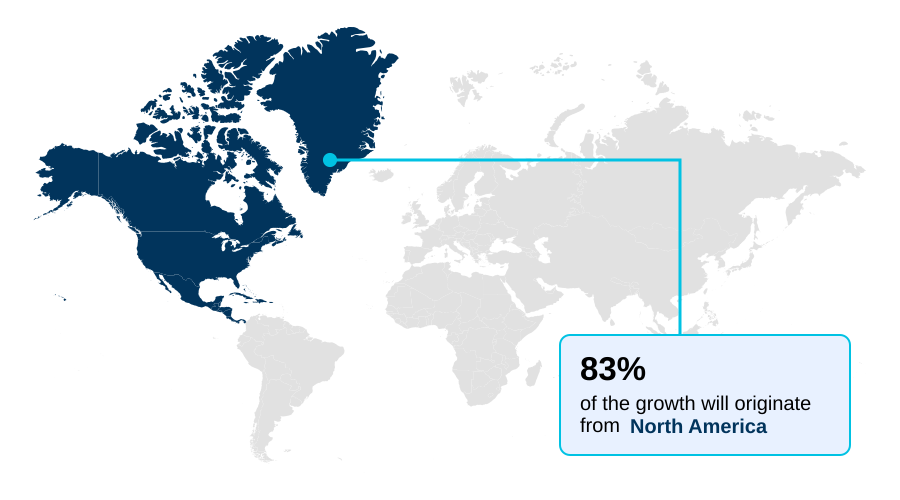
- North America dominated the market and accounted for a 82.6% growth during the forecast period.
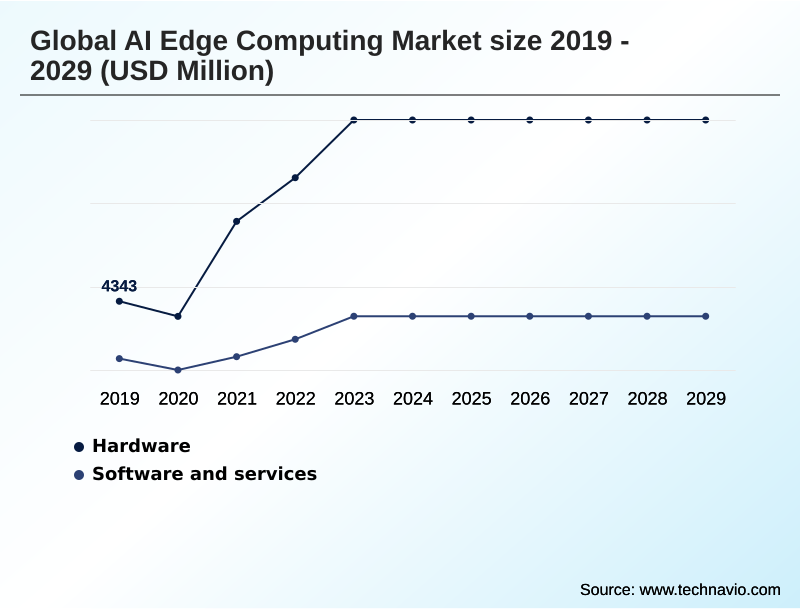
- By Type - Hardware segment was valued at USD 9.78 billion in 2023
- By End-user - Video surveillance segment accounted for the largest market revenue share in 2023
Market Size & Forecast
- Market Opportunities: USD 60.69 billion
- Market Future Opportunities: USD 50.69 billion
- CAGR from 2024 to 2029 : 31.9%
Market Summary
- The AI Edge Computing market is characterized by a strategic shift towards processing data at its source, a move that significantly reduces latency and enhances privacy. This paradigm is driven by the proliferation of IoT devices and the demand for immediate, actionable insights in sectors such as industrial automation and autonomous transportation.
- For instance, in a smart factory setting, AI at the edge enables real-time monitoring of machinery, predicting maintenance needs before failures occur and optimizing production lines without transmitting vast amounts of sensitive operational data to a central cloud. This capability not only improves efficiency but also strengthens operational resilience.
- Key trends include the development of specialized, power-efficient AI chipsets and the increasing sophistication of machine learning models designed for edge deployment. However, the market faces challenges related to ensuring the security of distributed devices and managing the complexity of deploying and updating AI models across a vast and varied hardware ecosystem.
- The ongoing evolution of this technology is pivotal for unlocking the full potential of interconnected, intelligent systems in both consumer and enterprise environments.
What will be the Size of the AI Edge Computing Market during the forecast period?
Get Key Insights on Market Forecast (PDF) Get Free Sample
How is the AI Edge Computing Market Segmented?
The ai edge computing industry research report provides comprehensive data (region-wise segment analysis), with forecasts and estimates in "USD million" for the period 2025-2029, as well as historical data from 2019-2023 for the following segments.
- Type
- Hardware
- Software and services
- End-user
- Video surveillance
- Remote monitoring
- Access management
- Autonomous vehicles
- Others
- Application
- Consumer electronics
- Smart cities
- Automotive
- Geography
- North America
- US
- Canada
- Mexico
- Europe
- UK
- Germany
- France
- APAC
- China
- Japan
- India
- South America
- Brazil
- Argentina
- Colombia
- Middle East and Africa
- Saudi Arabia
- UAE
- South Africa
- Rest of World (ROW)
- North America
By Type Insights
The hardware segment is estimated to witness significant growth during the forecast period.
The hardware segment, featuring the graphics processing unit, neural processing unit, and system-on-a-chip, is fundamental for on-device AI processing. These components enable complex tasks like behavioral pattern recognition and object classification.
Innovations in field-programmable gate array and application-specific integrated circuits are driving energy-efficient architectures, crucial for battery-powered devices and intelligent cockpit applications. The integration of embedded edge AI modules facilitates advanced capabilities such as natural language understanding and on-device machine learning.
Optimized hardware has boosted defect detection accuracy by 25% in manufacturing, underscoring its impact. This segment is further enhanced by cloud-native edge software that orchestrates these powerful components.
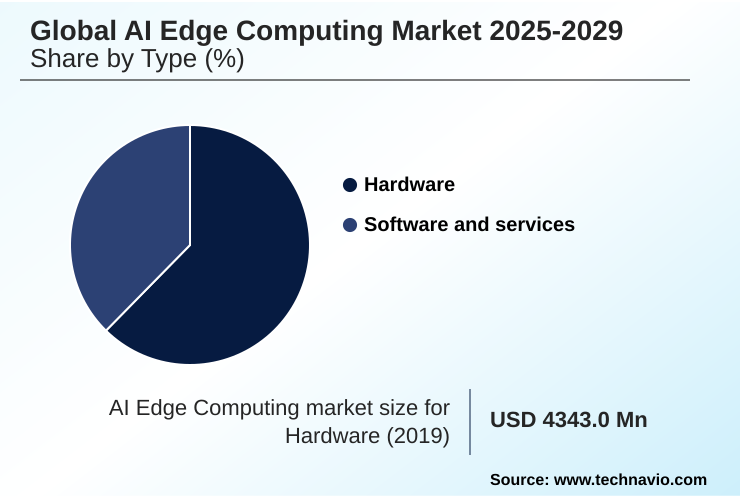
The Hardware segment was valued at USD 9.78 billion in 2023 and showed a gradual increase during the forecast period.
Regional Analysis
North America is estimated to contribute 82.6% to the growth of the global market during the forecast period.Technavio’s analysts have elaborately explained the regional trends and drivers that shape the market during the forecast period.
See How AI Edge Computing Market Demand is Rising in North America Get Free Sample
North America leads the market, poised to contribute 46.3% of incremental growth, driven by investments in intelligent transportation systems and vehicle-to-everything communication. This region's focus on a decentralized architecture supports scalable edge infrastructure for low-latency processing and real-time data processing.
European adoption of intelligent automation in industrial settings has shown a 15% reduction in production line errors. In APAC, the focus is on micro AI solutions, deploying an edge-to-edge system for network edge data processing.
These global initiatives depend on real-time inferencing capabilities powered by advanced AI inference engines to deliver immediate intelligence.
Market Dynamics
Our researchers analyzed the data with 2024 as the base year, along with the key drivers, trends, and challenges. A holistic analysis of drivers will help companies refine their marketing strategies to gain a competitive advantage.
- The strategic implementation of AI edge computing is reshaping enterprise operations by enabling sophisticated on-device data analysis. A key application is AI edge computing for autonomous vehicles, where processing sensor data locally is critical for safety and responsiveness. The process of deploying machine learning models at the edge is becoming more streamlined, allowing for real-time analytics in smart manufacturing environments.
- The performance of these systems heavily relies on hardware accelerators for edge AI workloads, which are optimized for specific tasks. While the benefits are clear, organizations must address security challenges in edge AI devices to prevent data breaches. In applications like video surveillance, advanced AI inference engines for video surveillance are crucial for immediate threat detection.
- The demand for low-latency processing for IoT applications is a major driver, pushing innovation in system design. Concurrently, the rise of on-device generative AI in consumer electronics is creating new user experiences. To support these advancements, scalable infrastructure for industrial edge AI is essential.
- This infrastructure supports processes like predictive maintenance using edge analytics and relies on energy-efficient AI chipsets for edge devices. Effective management of this ecosystem involves managing AI models on distributed edge nodes. The benefits of decentralized AI architecture include enhanced privacy and reduced bandwidth costs.
- The role of 5G in AI edge computing cannot be overstated, as it provides the high-speed connectivity needed for distributed systems. Integrating AI into intelligent transportation systems improves traffic flow and safety. Enterprises are actively comparing CPU GPU and FPGA for edge AI to find the optimal balance of performance and cost.
- The challenge of optimizing AI models for resource-constrained devices remains a focus, alongside ensuring data privacy in localized AI processing. Finally, edge computing in smart city surveillance and AI edge solutions for retail analytics are unlocking efficiencies, with some retailers reporting inventory accuracy improvements that are twice as high as traditional systems.
What are the key market drivers leading to the rise in the adoption of AI Edge Computing Industry?
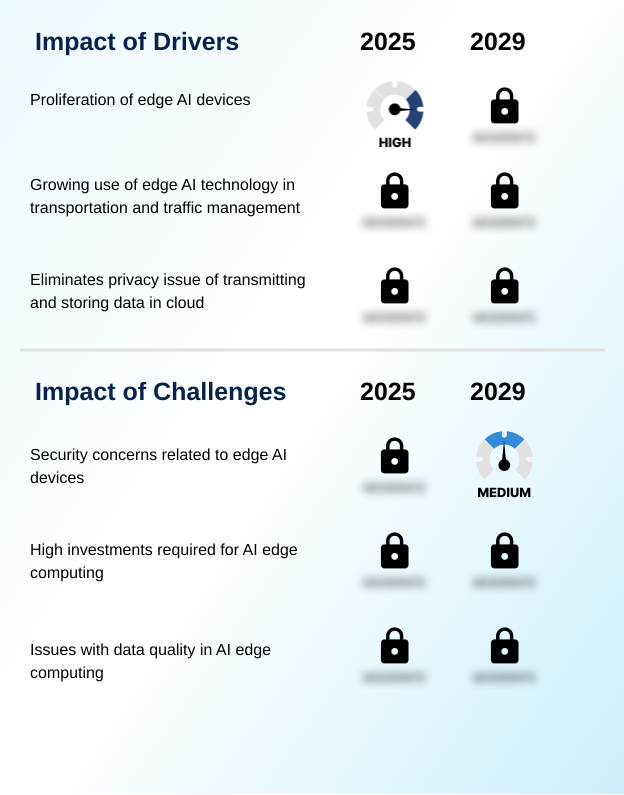
- The proliferation of edge AI devices is a key driver fueling the growth of the market.
- A primary market driver is the need for efficient IoT data processing, which fuels the adoption of decentralized data analysis for applications like predictive maintenance in smart manufacturing. This shift enables operational latency reductions of up to 40%.
- The growth of industrial automation is propelled by high-performance edge AI solutions that integrate with existing operational technology.
- This is made possible by AI-optimized hardware, including edge AI accelerators and serverless compute nodes, which handle demanding machine vision analytics and other on-premises AI workloads.
- Performing local data processing allows for the execution of low-power AI tasks securely and autonomously.
What are the market trends shaping the AI Edge Computing Industry?
- The increasing utilization of AI edge computing to achieve real-time analytics is emerging as a significant market trend. This shift enables faster decision-making and operational efficiency across various industries.
- The trend towards on-device generative AI is reshaping user interactions by enabling sophisticated, on-device creativity tools and AI-enhanced video effects. This shift to localized intelligence facilitates real-time image processing and adaptive decision-making, with some consumer devices showing a 20% improvement in task responsiveness. The successful machine learning model deployment is supported by frameworks allowing for seamless over-the-air model updates.
- This capability is critical for next-generation IoT applications, which rely on real-time analytics modules to deliver dynamic AI-powered software experiences, ensuring devices remain current and efficient without constant cloud connectivity.
What challenges does the AI Edge Computing Industry face during its growth?
- Security concerns associated with edge AI devices present a key challenge affecting the industry's growth trajectory.
- Security remains a significant challenge, requiring robust zero trust security architectures and secure boot mechanisms to protect distributed infrastructure. The management of containerized microservices and hybrid computing models adds complexity, particularly in critical applications like autonomous vehicle systems and video surveillance analytics.
- A single breach can lead to business disruptions that are 10 times more costly than the initial security investment. Furthermore, ensuring data integrity for on-device machine learning is crucial, as flawed data undermines the reliability of AI-driven operational insights and the effectiveness of automated response systems, thereby limiting enhanced situational awareness in AI-enabled surveillance systems.
Exclusive Technavio Analysis on Customer Landscape
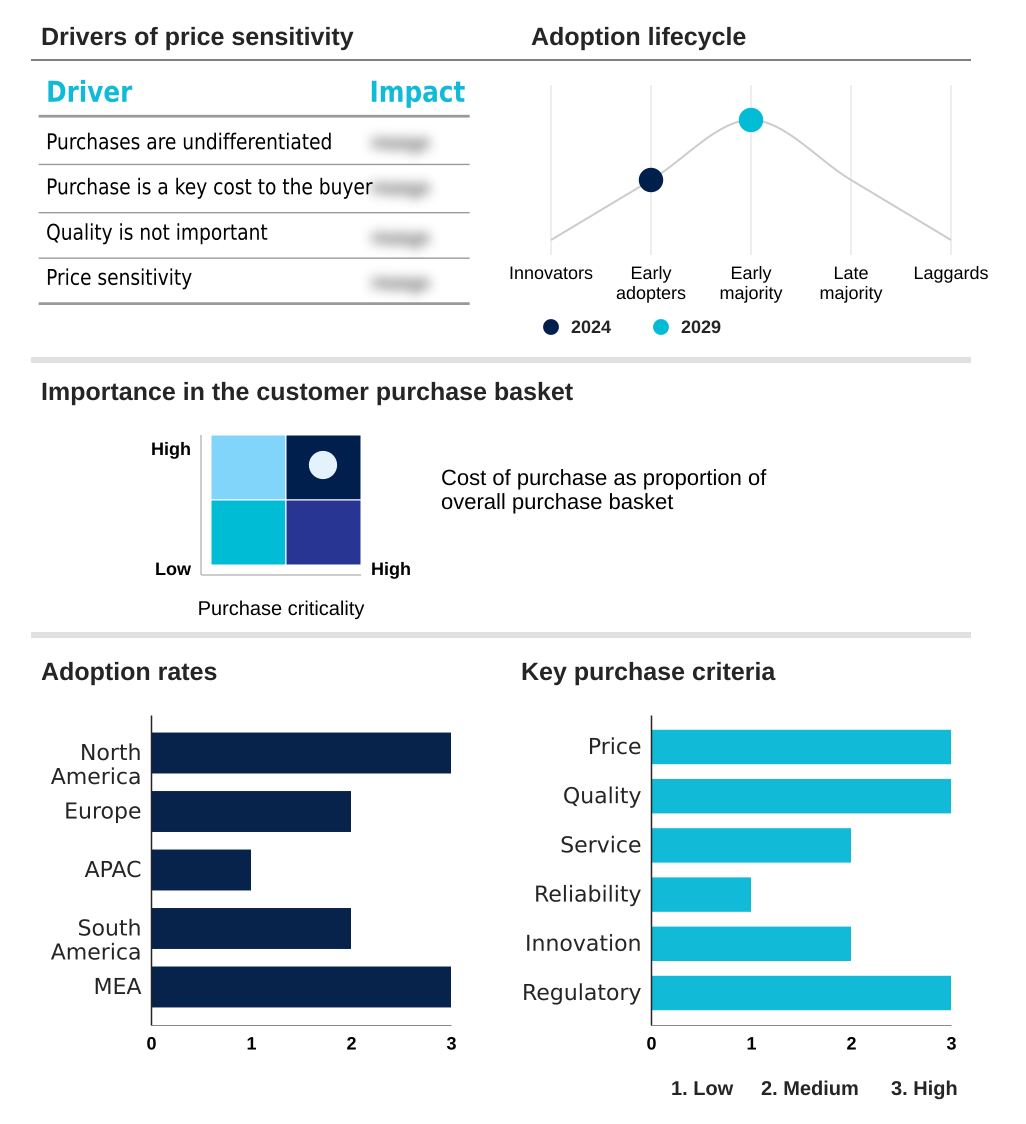
The ai edge computing market forecasting report includes the adoption lifecycle of the market, covering from the innovator’s stage to the laggard’s stage. It focuses on adoption rates in different regions based on penetration. Furthermore, the ai edge computing market report also includes key purchase criteria and drivers of price sensitivity to help companies evaluate and develop their market growth analysis strategies.
Customer Landscape of AI Edge Computing Industry
Competitive Landscape
Companies are implementing various strategies, such as strategic alliances, ai edge computing market forecast, partnerships, mergers and acquisitions, geographical expansion, and product/service launches, to enhance their presence in the industry.
Accenture PLC - Delivers a portfolio of AI edge computing services, facilitating real-time inferencing and management of intelligent IoT devices for localized machine learning model deployment.
The industry research and growth report includes detailed analyses of the competitive landscape of the market and information about key companies, including:
- Accenture PLC
- Amazon Web Services Inc.
- Azion Technologies Inc.
- Cisco Systems Inc.
- ClearBlade Inc.
- Hewlett Packard
- Huawei Technologies Co. Ltd.
- Intel Corp.
- IBM Corp.
- Johnson Controls International
- Microsoft Corp.
- Nutanix Inc.
- Rigado Inc.
- SAGUNA Network LTD.
- SixSq SA
- Synaptics Inc.
- Vapor IO Inc.
Qualitative and quantitative analysis of companies has been conducted to help clients understand the wider business environment as well as the strengths and weaknesses of key industry players. Data is qualitatively analyzed to categorize companies as pure play, category-focused, industry-focused, and diversified; it is quantitatively analyzed to categorize companies as dominant, leading, strong, tentative, and weak.
Recent Development and News in Ai edge computing market
- In March 2025, Intel Corp. announced the launch of its next-generation processor series, featuring an enhanced neural processing unit designed to accelerate AI workloads on industrial edge devices with up to a 40% improvement in power efficiency.
- In January 2025, Microsoft Corp. and Cisco Systems Inc. revealed a strategic partnership to integrate Azure IoT Edge services with Cisco's Edge Intelligence platform, aiming to provide a unified solution for large-scale AI application deployment.
- In November 2024, Amazon Web Services Inc. completed its acquisition of a startup specializing in lightweight machine learning model optimization, a move expected to enhance its SageMaker Edge Manager capabilities for resource-constrained devices.
- In April 2025, Huawei Technologies Co. Ltd. announced a significant investment to establish a new AI Edge Computing R&D center in Brazil, focusing on developing solutions for the South American agriculture and logistics sectors.
Dive into Technavio’s robust research methodology, blending expert interviews, extensive data synthesis, and validated models for unparalleled AI Edge Computing Market insights. See full methodology.
| Market Scope | |
|---|---|
| Page number | 301 |
| Base year | 2024 |
| Historic period | 2019-2023 |
| Forecast period | 2025-2029 |
| Growth momentum & CAGR | Accelerate at a CAGR of 31.9% |
| Market growth 2025-2029 | USD 50685.8 million |
| Market structure | Fragmented |
| YoY growth 2024-2025(%) | 26.1% |
| Key countries | US, Canada, Mexico, UK, Germany, France, Italy, The Netherlands, Spain, China, Japan, India, South Korea, Australia, Indonesia, Brazil, Argentina, Colombia, Saudi Arabia, UAE, South Africa, Israel and Turkey |
| Competitive landscape | Leading Companies, Market Positioning of Companies, Competitive Strategies, and Industry Risks |
Research Analyst Overview
- The AI edge computing landscape is defined by a rapid shift toward on-device AI processing and decentralized data analysis, driven by the need for low-latency processing. This evolution relies on a sophisticated ecosystem of hardware, including the graphics processing unit, system-on-a-chip, and neural processing unit, alongside field-programmable gate array and application-specific integrated circuits.
- These edge AI accelerators power AI inference engines for tasks like predictive maintenance and anomaly detection. The successful machine learning model deployment on distributed infrastructure enables real-time inferencing and local data processing.
- For boardroom strategy, integrating intelligent transportation systems and smart manufacturing with vehicle-to-everything communication is a key decision, as firms using real-time AI inferencing report processing time reductions of over 30%. Growth is seen in video surveillance analytics, autonomous vehicle systems, and industrial automation. Solutions use containerized microservices and hybrid computing models to deliver AI-powered software experiences.
- Advances in on-device generative AI and micro AI solutions, leveraging real-time analytics modules and serverless compute nodes with embedded edge AI modules, redefine IoT data processing via edge machine learning for object classification, natural language understanding, and behavioral pattern recognition.
What are the Key Data Covered in this AI Edge Computing Market Research and Growth Report?
-
What is the expected growth of the AI Edge Computing Market between 2025 and 2029?
-
USD 50.69 billion, at a CAGR of 31.9%
-
-
What segmentation does the market report cover?
-
The report is segmented by Type (Hardware, Software and services), End-user (Video surveillance, Remote monitoring access, Management autonomous, Vehicles, Others), Application (Consumer electronics, Smart cities, Automotive) and Geography (North America, Europe, APAC, South America, Middle East and Africa)
-
-
Which regions are analyzed in the report?
-
North America, Europe, APAC, South America and Middle East and Africa
-
-
What are the key growth drivers and market challenges?
-
Proliferation of edge AI devices, Security concerns related to edge AI devices
-
-
Who are the major players in the AI Edge Computing Market?
-
Accenture PLC, Amazon Web Services Inc., Azion Technologies Inc., Cisco Systems Inc., ClearBlade Inc., Hewlett Packard, Huawei Technologies Co. Ltd., Intel Corp., IBM Corp., Johnson Controls International, Microsoft Corp., Nutanix Inc., Rigado Inc., SAGUNA Network LTD., SixSq SA, Synaptics Inc. and Vapor IO Inc.
-
Market Research Insights
- The market's dynamics are shaped by a push toward localized intelligence and adaptive decision-making to enhance operational efficiency. This decentralized architecture is critical for enabling intelligent automation and providing AI-driven operational insights without cloud reliance. For example, organizations leveraging edge solutions report up to a 40% reduction in data processing latency, directly impacting real-time control systems.
- A key aspect is the adoption of a zero trust security architecture to mitigate risks that could otherwise lead to penalties equivalent to 4% of annual revenue under certain data protection regulations.
- The use of advanced AI-optimized hardware facilitates energy-efficient architectures, while next-generation IoT applications benefit from enhanced situational awareness and robust, secure boot mechanisms, creating a resilient and responsive technological ecosystem.
We can help! Our analysts can customize this ai edge computing market research report to meet your requirements.
 RIA -
RIA - 
