AI For Debt Collection Market Analysis, Size, and Forecast 2025-2029: North America (US, Canada, and Mexico), APAC (China, India, and Japan), Europe (UK, Germany, and France), South America (Brazil, Argentina, and Colombia), Middle East and Africa (South Africa, UAE, and Saudi Arabia), and Rest of World (ROW)

AI For Debt Collection Market Analysis, Size, and Forecast 2025-2029:
North America (US, Canada, and Mexico), APAC (China, India, and Japan), Europe (UK, Germany, and France), South America (Brazil, Argentina, and Colombia), Middle East and Africa (South Africa, UAE, and Saudi Arabia), and Rest of World (ROW)

Published: Dec 2025 317 Pages SKU: IRTNTR81006

Market Overview at a Glance

$2.77 B
Market Opportunity
15%
CAGR 2024 - 2029
31.3%
North America Growth
$1.76 B
Software segment 2023

AI For Debt Collection Market Size 2025-2029

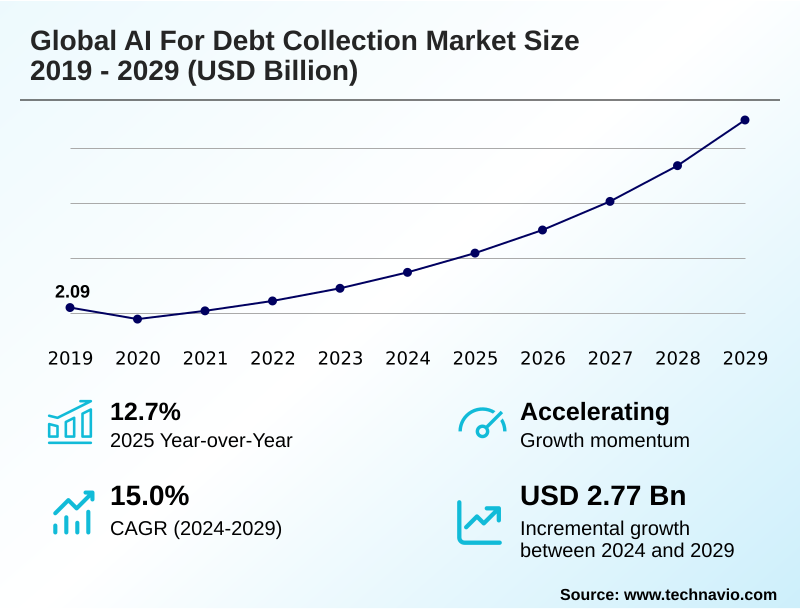
The ai for debt collection market size is valued to increase by USD 2.77 billion, at a CAGR of 15% from 2024 to 2029. Increasing operational efficiency and cost reduction will drive the ai for debt collection market.

Major Market Trends & Insights

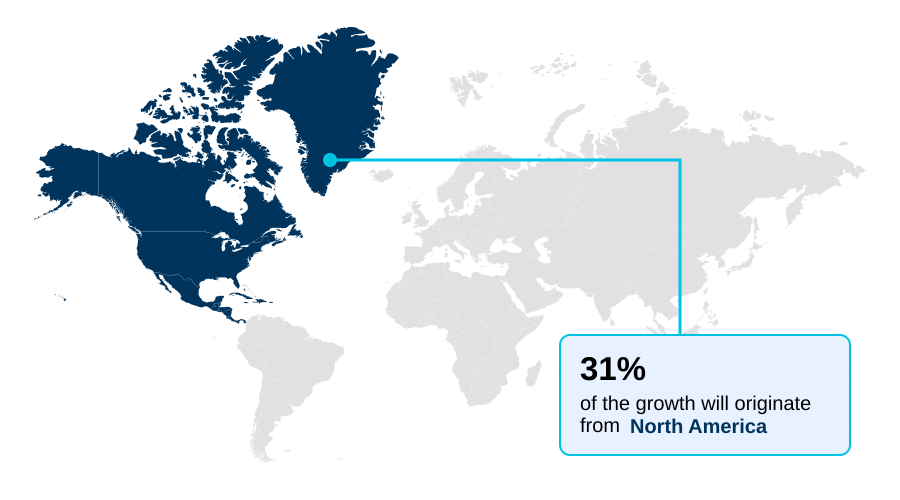
  • North America dominated the market and accounted for a 31.3% growth during the forecast period.
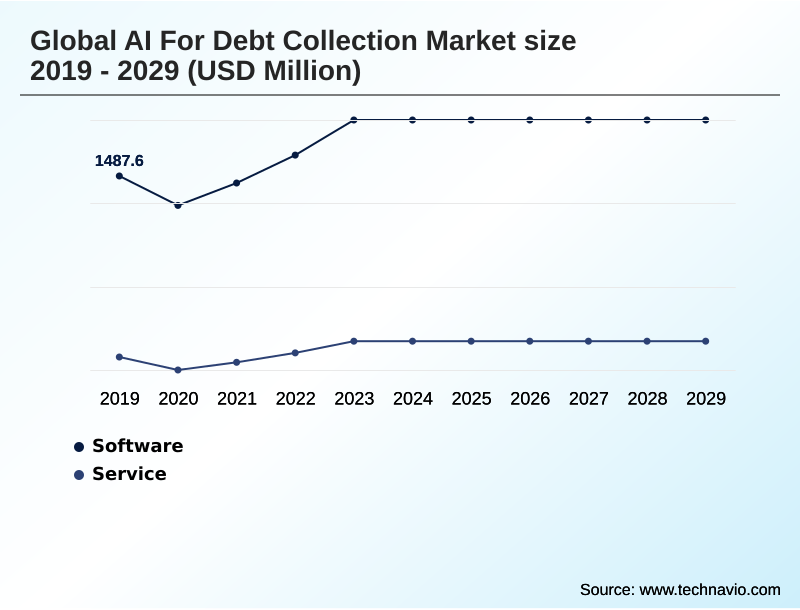
  • By Component - Software segment was valued at USD 1.76 billion in 2023
  • By Deployment - Cloud-based segment accounted for the largest market revenue share in 2023

Market Size & Forecast

  • Market Opportunities: USD 3.41 billion
  • Market Future Opportunities: USD 2.77 billion
  • CAGR from 2024 to 2029 : 15%

Market Summary

  • The AI For Debt Collection Market is rapidly evolving, driven by the need for financial institutions to enhance operational efficiency and adopt more customer-centric recovery strategies. The market leverages artificial intelligence technologies like machine learning models and natural language processing to transform traditional, labor-intensive collection processes.
  • Key drivers include the significant cost reductions achieved through AI-driven automation of routine tasks and the ability to improve customer experience with personalized debt collection communication. Trends such as the increasing sophistication of predictive analytics for debt collection and generative AI in debt collection are enabling more accurate debtor behavior prediction and empathetic engagement.
  • For instance, a financial institution can utilize AI for debt collection platforms to analyze a debtor's communication history and financial patterns, automatically offering a tailored repayment plan through a debt collection chatbot instead of a generic notice, significantly increasing the likelihood of successful resolution.
  • However, the market faces challenges related to data privacy, integration complexity with legacy systems, and the critical need for ethical AI deployment in debt collection to avoid algorithmic bias and maintain regulatory compliance. This focus on AI compliance in financial services is crucial for sustainable growth.

What will be the Size of the AI For Debt Collection Market during the forecast period?

Get Key Insights on Market Forecast (PDF) Request Free Sample

How is the AI For Debt Collection Market Segmented?

The ai for debt collection industry research report provides comprehensive data (region-wise segment analysis), with forecasts and estimates in "USD million" for the period 2025-2029, as well as historical data from 2019-2023 for the following segments.

  • Component
    • Software
    • Service
  • Deployment
    • Cloud-based
    • On-premises
  • Sector
    • Large enterprises
    • SME
  • Application
    • BFSI
    • Telecom
    • Healthcare
    • Others
  • Geography
    • North America
      • US
      • Canada
      • Mexico
    • APAC
      • China
      • India
      • Japan
    • Europe
      • UK
      • Germany
      • France
    • South America
      • Brazil
      • Argentina
      • Colombia
    • Middle East and Africa
      • South Africa
      • UAE
      • Saudi Arabia
    • Rest of World (ROW)

By Component Insights

The software segment is estimated to witness significant growth during the forecast period.

The software segment is defined by significant innovation in machine learning models and data processing capabilities. Advanced AI for debt collection platforms leverage predictive analytics and natural language processing to enable personalized debt collection communication and optimize recovery.

The use of intelligent process automation and AI-driven automation in AI for accounts receivable is critical for managing non-performing loans (NPLs). For instance, AI models for loan default prediction have improved accuracy by over 15% compared to traditional methods.

The application of intelligent document processing and AI-powered negotiation tools is also central to reducing operational costs, alongside the rise of generative AI in debt collection. This evolution underscores a strategic shift toward more efficient and data-centric collection methodologies.

Request Free Sample

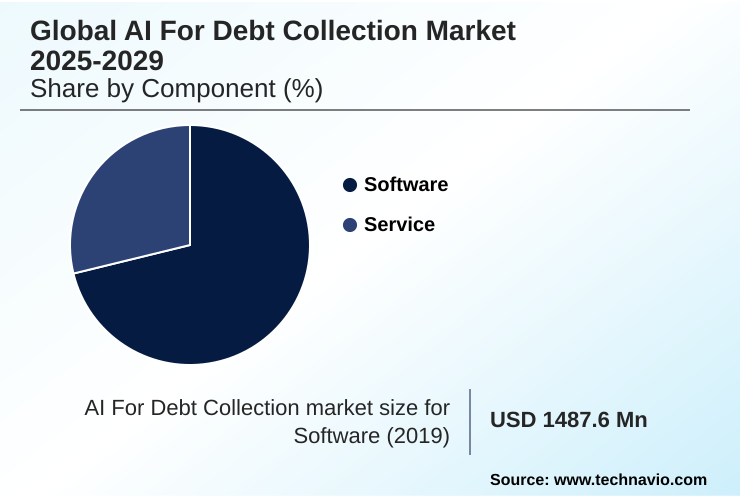
The Software segment was valued at USD 1.76 billion in 2023 and showed a gradual increase during the forecast period.

Request Free Sample

Regional Analysis

North America is estimated to contribute 31.3% to the growth of the global market during the forecast period.Technavio’s analysts have elaborately explained the regional trends and drivers that shape the market during the forecast period.

See How AI For Debt Collection Market Demand is Rising in North America Request Free Sample

The geographic landscape is led by North America, which accounts for over 31% of the incremental growth, driven by advanced technological adoption and a focus on compliance automation.

The US, in particular, leverages AI-powered virtual assistants and behavioral analytics to manage high volumes of consumer debt.

APAC is the fastest-growing region, with a projected CAGR of 16.1%, fueled by digitalization in countries like China and India, where alternative data analysis is crucial for assessing creditworthiness.

Europe, contributing over 20% to market growth, navigates a complex regulatory environment by deploying explainable AI and ethical AI in collections to adhere to data privacy regulations.

The use of AI-based risk scoring and risk segmentation is becoming standard across these key regions to improve the efficiency of digital debt collection efforts.

Market Dynamics

Our researchers analyzed the data with 2024 as the base year, along with the key drivers, trends, and challenges. A holistic analysis of drivers will help companies refine their marketing strategies to gain a competitive advantage.

  • The strategic implementation of AI is revolutionizing debt recovery, with organizations increasingly focused on using AI to improve recovery rates. The core of this transformation lies in leveraging predictive analytics for debt collection to forecast default risks and optimize outreach.
  • By automating debt collection with AI, financial institutions can significantly reduce manual effort and operational overhead, realizing one of the key benefits of AI in debt collection. This automation is coupled with AI-powered customer engagement for collections, which utilizes tools like chatbots and personalized messaging to create a more cooperative resolution process.
  • A paramount concern is ensuring AI for debt collection compliance, as regulatory scrutiny intensifies globally. The principles of ethical AI deployment in debt collection are central to building trust and avoiding algorithmic bias. Decisions around cloud vs on-premises AI collection are often dictated by data security needs and scalability requirements.
  • Sector-specific applications are also maturing, particularly AI for BFSI debt collection and AI for telecom debt collection. The AI for healthcare debt collection segment focuses on empathetic communication, while AI for SME debt collection requires scalable platforms.
  • Advanced AI-driven debt negotiation strategies and real-time decisioning in debt recovery allow for dynamic adjustments, while AI-based risk segmentation for debtors enables tailored interventions. The rise of generative AI in debt collection is further enhancing personalized debt collection communication, with some firms reporting that AI-driven strategies are twice as effective in establishing payment plans compared to traditional methods.
  • Finally, AI models for loan default prediction and a focus on AI compliance in financial services are proving critical for reducing operational costs and ensuring sustainable growth.

What are the key market drivers leading to the rise in the adoption of AI For Debt Collection Industry?

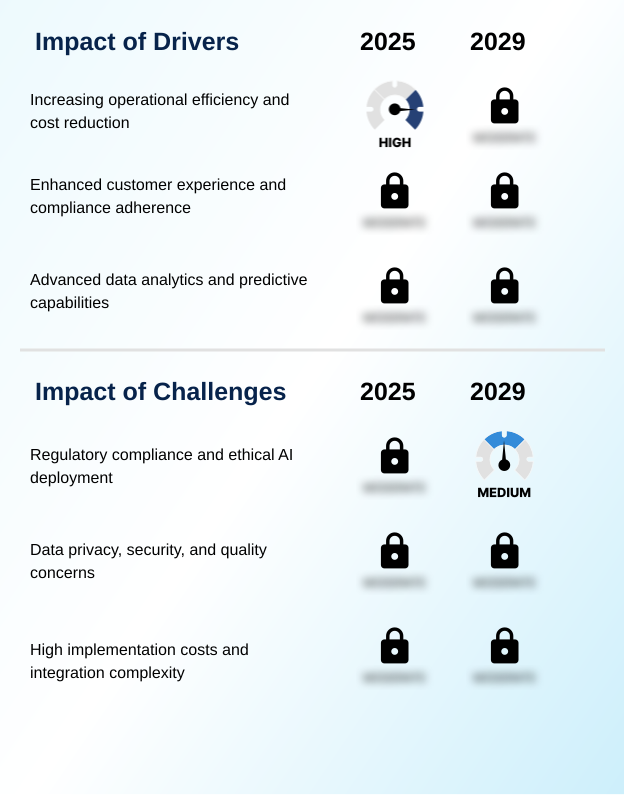
  • The imperative to increase operational efficiency and reduce costs serves as a key driver for market growth.

  • A primary driver is the need for enhanced operational efficiency, which AI debt recovery solutions directly address.
  • By leveraging predictive analytics and advanced debtor behavior prediction, organizations are achieving significant gains; for example, proactive interventions have reduced accounts progressing to severe delinquency by 12%.
  • The use of sentiment analysis within customer engagement platforms has improved customer satisfaction scores by 15%. Granular risk segmentation and AI-based risk segmentation for debtors allow for tailored predictive outreach strategies, leading to a 15% increase in overall recovery rates.
  • This data-driven approach is particularly impactful in AI for BFSI debt collection and AI for B2B collections, where real-time decisioning in debt recovery is critical for managing complex portfolios and using AI to improve recovery rates.

What are the market trends shaping the AI For Debt Collection Industry?

  • The escalating digital transformation across financial services is accelerating automation, a primary trend shaping the market's trajectory.

  • The market is increasingly defined by a digital-first debt collection approach, where AI for debt collection platforms are central to strategy. A key trend is the rise of agentic AI and conversational AI, with some systems delivering 96% clinically accurate empathetic responses, making them nearly indistinguishable from human agents.
  • The use of generative AI voicebots and other forms of generative AI in debt collection for automated payment reminders and initial outreach has resulted in recovery rate improvements of up to 30%. This focus on empathetic debt collection AI is not just enhancing customer experience but also proving effective, with AI-driven debt negotiation strategies leading to better outcomes.
  • The integration of advanced AI-based risk scoring is enabling more personalized debt collection communication, which is crucial for effective AI-driven debt management and reducing operational costs.

What challenges does the AI For Debt Collection Industry face during its growth?

  • Navigating complex regulatory compliance requirements and ensuring ethical AI deployment present a key challenge to industry growth.

  • A significant challenge is navigating the complex regulatory landscape, demanding robust AI for debt collection compliance and ethical AI deployment in debt collection. The deployment of an AI-powered compliance platform and dedicated compliance monitoring systems is now essential.
  • For instance, some firms have reduced reconciliation-related labor by 20% through robotic process automation, yet ensuring these systems are fair is a hurdle. The need for explainable AI is growing, especially in sensitive areas like AI for healthcare debt collection.
  • High implementation costs and integration complexities, particularly with cloud vs on-premises AI collection decisions, act as barriers for AI for SME debt collection. Firms must invest heavily in AI-driven compliance tools and adaptive analytics to ensure their machine learning models remain compliant and unbiased.

Exclusive Technavio Analysis on Customer Landscape

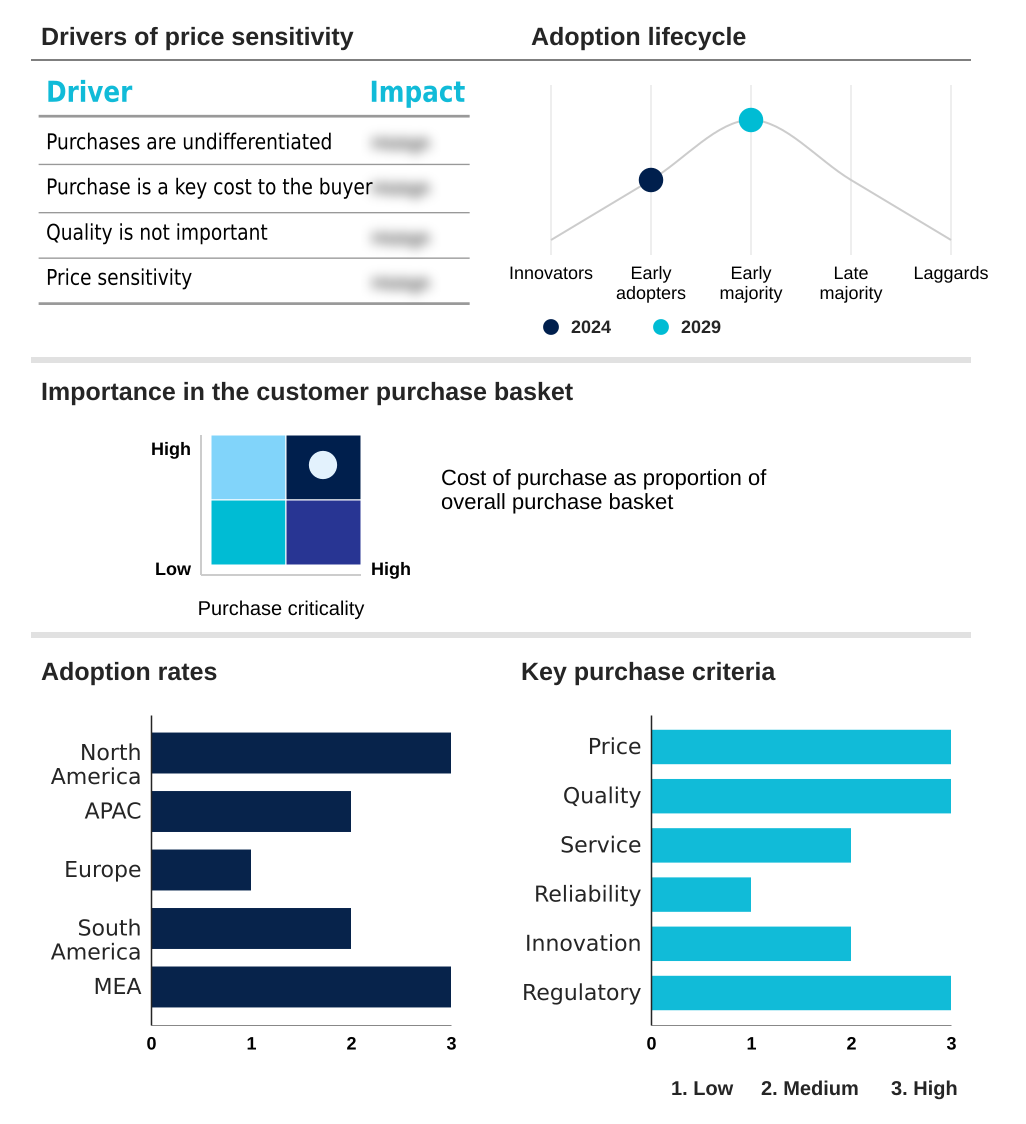
The ai for debt collection market forecasting report includes the adoption lifecycle of the market, covering from the innovator’s stage to the laggard’s stage. It focuses on adoption rates in different regions based on penetration. Furthermore, the ai for debt collection market report also includes key purchase criteria and drivers of price sensitivity to help companies evaluate and develop their market growth analysis strategies.

Customer Landscape of AI For Debt Collection Industry

Competitive Landscape

Companies are implementing various strategies, such as strategic alliances, ai for debt collection market forecast, partnerships, mergers and acquisitions, geographical expansion, and product/service launches, to enhance their presence in the industry.

Analog Legalhub Technology Solutions Pvt. Ltd. - AI for Debt Collection solutions incorporate GenAI voicebots and predictive analytics to create personalized, automated borrower journeys, enhancing recovery strategies.

The industry research and growth report includes detailed analyses of the competitive landscape of the market and information about key companies, including:

  • Analog Legalhub Technology Solutions Pvt. Ltd.
  • Chetu Inc.
  • collect Artificial Intelligence GmbH
  • Debtist GmbH
  • Experian Plc
  • Fair Isaac Corp.
  • Finvi
  • IC System Inc
  • InDebted Holdings Pty Ltd
  • Intellect Design Arena Ltd.
  • Intelligent Contacts Inc
  • LexisNexis Risk Solutions.
  • Loxon Solutions Zrt.
  • PAIR Finance Group
  • Pegasystems Inc.
  • QUALCO
  • Temenos AG
  • Tesorio Inc
  • TransUnion
  • TrueAccord

Qualitative and quantitative analysis of companies has been conducted to help clients understand the wider business environment as well as the strengths and weaknesses of key industry players. Data is qualitatively analyzed to categorize companies as pure play, category-focused, industry-focused, and diversified; it is quantitatively analyzed to categorize companies as dominant, leading, strong, tentative, and weak.

Recent Development and News in Ai for debt collection market

  • In August, 2024, Ant Group announced the integration of generative AI into its debt recovery operations to craft nuanced, emotionally intelligent messages tailored to each borrower's financial situation.
  • In October, 2024, Neowise, in collaboration with Sarvam AI, launched NeoBot and NeoSight, India's first generative AI-powered debt collection tools that automate voice-based outreach and call analytics.
  • In March, 2025, Cedar partnered with Twilio to enhance its AI-driven billing communications, using a voice AI engine to automate inbound billing calls and offer tailored payment options.
  • In May, 2025, Synchrony Financial entered a partnership with Credgenics to implement AI-powered predictive analytics across its consumer debt portfolios, using over 200 data points to optimize outreach.

Dive into Technavio’s robust research methodology, blending expert interviews, extensive data synthesis, and validated models for unparalleled AI For Debt Collection Market insights. See full methodology.

Market Scope
Page number 317
Base year 2024
Historic period 2019-2023
Forecast period 2025-2029
Growth momentum & CAGR Accelerate at a CAGR of 15%
Market growth 2025-2029 USD 2771.5 million
Market structure Fragmented
YoY growth 2024-2025(%) 12.7%
Key countries US, Canada, Mexico, China, India, Japan, Australia, South Korea, Singapore, UK, Germany, France, Italy, The Netherlands, Spain, Brazil, Argentina, Colombia, South Africa, UAE, Saudi Arabia, Egypt and Kenya
Competitive landscape Leading Companies, Market Positioning of Companies, Competitive Strategies, and Industry Risks

Request Free Sample

Research Analyst Overview

  • The AI for debt collection market is undergoing a significant transformation, driven by the integration of advanced technologies designed to optimize recovery processes. At the core of this shift are machine learning models and predictive analytics, which enable sophisticated debtor behavior prediction and risk segmentation.
  • The adoption of AI-driven automation and robotic process automation for routine tasks allows collection agents to focus on more complex negotiations, supported by insights from sentiment analysis and behavioral analytics. We are seeing a move towards more interactive and personalized engagement through conversational AI, AI-powered virtual assistants, and generative AI voicebots.
  • These tools facilitate automated communication that is both efficient and empathetic. For boardroom decisions, the focus on compliance automation and explainable AI is critical for navigating complex regulatory landscapes and mitigating risks. Platforms are increasingly using adaptive analytics and reinforcement learning for real-time decisioning, with some achieving a 15% improvement in promise-to-pay rates.
  • The use of alternative data analysis and automated skip tracing enhances the effectiveness of digital debt collection, while AI-led credit scoring and intelligent process automation are becoming standard. Ultimately, solutions featuring virtual negotiators and sophisticated AI-based risk scoring are defining the next generation of debt management.

What are the Key Data Covered in this AI For Debt Collection Market Research and Growth Report?

  • What is the expected growth of the AI For Debt Collection Market between 2025 and 2029?

    • USD 2.77 billion, at a CAGR of 15%

  • What segmentation does the market report cover?

    • The report is segmented by Component (Software, Service), Deployment (Cloud-based, On-premises), Sector (Large enterprises, SME), Application (BFSI, Telecom, Healthcare, Others) and Geography (North America, APAC, Europe, South America, Middle East and Africa)

  • Which regions are analyzed in the report?

    • North America, APAC, Europe, South America and Middle East and Africa

  • What are the key growth drivers and market challenges?

    • Increasing operational efficiency and cost reduction, Regulatory compliance and ethical AI deployment

  • Who are the major players in the AI For Debt Collection Market?

    • Analog Legalhub Technology Solutions Pvt. Ltd., Chetu Inc., collect Artificial Intelligence GmbH, Debtist GmbH, Experian Plc, Fair Isaac Corp., Finvi, IC System Inc, InDebted Holdings Pty Ltd, Intellect Design Arena Ltd., Intelligent Contacts Inc, LexisNexis Risk Solutions., Loxon Solutions Zrt., PAIR Finance Group, Pegasystems Inc., QUALCO, Temenos AG, Tesorio Inc, TransUnion and TrueAccord

Market Research Insights

  • Market dynamics are increasingly shaped by the adoption of sophisticated AI for debt collection platforms that deliver significant operational advantages. These AI debt recovery solutions are proving essential for managing non-performing loans, with some institutions reporting a 15% increase in recovery rates.
  • The deployment of a dedicated debt collection chatbot and automated payment reminders has led to a 30% reduction in inbound calls for routine inquiries. As the focus shifts toward ethical AI in collections, customer engagement platforms are being enhanced with features for behavior-based personalization.
  • This push for digital-first debt collection is evident in the performance of compliance monitoring systems, which have reduced compliance breaches significantly. The move towards omnichannel communication automation and AI for accounts receivable is reshaping strategies, making processes more efficient and consumer-friendly.

We can help! Our analysts can customize this ai for debt collection market research report to meet your requirements.

Get in touch

1. Executive Summary

1.1 Market overview

Executive Summary - Chart on Market Overview
Executive Summary - Data Table on Market Overview
Executive Summary - Chart on Global Market Characteristics
Executive Summary - Chart on Market by Geography
Executive Summary - Chart on Market Segmentation by Component
Executive Summary - Chart on Market Segmentation by Deployment
Executive Summary - Chart on Market Segmentation by Sector
Executive Summary - Chart on Market Segmentation by Application
Executive Summary - Chart on Incremental Growth
Executive Summary - Data Table on Incremental Growth
Executive Summary - Chart on Company Market Positioning

2. Technavio Analysis

2.1 Analysis of price sensitivity, lifecycle, customer purchase basket, adoption rates, and purchase criteria

2.2 Criticality of inputs and Factors of differentiation

Chart on Overview on criticality of inputs and factors of differentiation

2.3 Factors of disruption

Chart on Overview on factors of disruption

2.4 Impact of drivers and challenges

Chart on Impact of drivers and challenges in 2024 and 2029

3. Market Landscape

3.1 Market ecosystem

Chart on Parent Market
Data Table on - Parent Market

3.2 Market characteristics

Chart on Market characteristics analysis

3.3 Value chain analysis

Chart on Value chain analysis

4. Market Sizing

4.1 Market definition

Data Table on Offerings of companies included in the market definition

4.2 Market segment analysis

Market segments

4.3 Market size 2024

4.4 Market outlook: Forecast for 2024-2029

Chart on Global - Market size and forecast 2024-2029 ($ million)
Data Table on Global - Market size and forecast 2024-2029 ($ million)
Chart on Global Market: Year-over-year growth 2024-2029 (%)
Data Table on Global Market: Year-over-year growth 2024-2029 (%)

5. Historic Market Size

5.1 Global AI For Debt Collection Market 2019 - 2023

Historic Market Size - Data Table on Global AI For Debt Collection Market 2019 - 2023 ($ million)

5.2 Component segment analysis 2019 - 2023

Historic Market Size - Component Segment 2019 - 2023 ($ million)

5.3 Deployment segment analysis 2019 - 2023

Historic Market Size - Deployment Segment 2019 - 2023 ($ million)

5.4 Sector segment analysis 2019 - 2023

Historic Market Size - Sector Segment 2019 - 2023 ($ million)

5.5 Application segment analysis 2019 - 2023

Historic Market Size - Application Segment 2019 - 2023 ($ million)

5.6 Geography segment analysis 2019 - 2023

Historic Market Size - Geography Segment 2019 - 2023 ($ million)

5.7 Country segment analysis 2019 - 2023

Historic Market Size - Country Segment 2019 - 2023 ($ million)

6. Five Forces Analysis

6.1 Five forces summary

Five forces analysis - Comparison between 2024 and 2029

6.2 Bargaining power of buyers

Bargaining power of buyers - Impact of key factors 2024 and 2029

6.3 Bargaining power of suppliers

Bargaining power of suppliers - Impact of key factors in 2024 and 2029

6.4 Threat of new entrants

Threat of new entrants - Impact of key factors in 2024 and 2029

6.5 Threat of substitutes

Threat of substitutes - Impact of key factors in 2024 and 2029

6.6 Threat of rivalry

Threat of rivalry - Impact of key factors in 2024 and 2029

6.7 Market condition

Chart on Market condition - Five forces 2024 and 2029

7. Market Segmentation by Component

7.1 Market segments

Chart on Component - Market share 2024-2029 (%)
Data Table on Component - Market share 2024-2029 (%)

7.2 Comparison by Component

Chart on Comparison by Component
Data Table on Comparison by Component

7.3 Software - Market size and forecast 2024-2029

Chart on Software - Market size and forecast 2024-2029 ($ million)
Data Table on Software - Market size and forecast 2024-2029 ($ million)
Chart on Software - Year-over-year growth 2024-2029 (%)
Data Table on Software - Year-over-year growth 2024-2029 (%)

7.4 Service - Market size and forecast 2024-2029

Chart on Service - Market size and forecast 2024-2029 ($ million)
Data Table on Service - Market size and forecast 2024-2029 ($ million)
Chart on Service - Year-over-year growth 2024-2029 (%)
Data Table on Service - Year-over-year growth 2024-2029 (%)

7.5 Market opportunity by Component

Market opportunity by Component ($ million)
Data Table on Market opportunity by Component ($ million)

8. Market Segmentation by Deployment

8.1 Market segments

Chart on Deployment - Market share 2024-2029 (%)
Data Table on Deployment - Market share 2024-2029 (%)

8.2 Comparison by Deployment

Chart on Comparison by Deployment
Data Table on Comparison by Deployment

8.3 Cloud-based - Market size and forecast 2024-2029

Chart on Cloud-based - Market size and forecast 2024-2029 ($ million)
Data Table on Cloud-based - Market size and forecast 2024-2029 ($ million)
Chart on Cloud-based - Year-over-year growth 2024-2029 (%)
Data Table on Cloud-based - Year-over-year growth 2024-2029 (%)

8.4 On-premises - Market size and forecast 2024-2029

Chart on On-premises - Market size and forecast 2024-2029 ($ million)
Data Table on On-premises - Market size and forecast 2024-2029 ($ million)
Chart on On-premises - Year-over-year growth 2024-2029 (%)
Data Table on On-premises - Year-over-year growth 2024-2029 (%)

8.5 Market opportunity by Deployment

Market opportunity by Deployment ($ million)
Data Table on Market opportunity by Deployment ($ million)

9. Market Segmentation by Sector

9.1 Market segments

Chart on Sector - Market share 2024-2029 (%)
Data Table on Sector - Market share 2024-2029 (%)

9.2 Comparison by Sector

Chart on Comparison by Sector
Data Table on Comparison by Sector

9.3 Large enterprises - Market size and forecast 2024-2029

Chart on Large enterprises - Market size and forecast 2024-2029 ($ million)
Data Table on Large enterprises - Market size and forecast 2024-2029 ($ million)
Chart on Large enterprises - Year-over-year growth 2024-2029 (%)
Data Table on Large enterprises - Year-over-year growth 2024-2029 (%)

9.4 SME - Market size and forecast 2024-2029

Chart on SME - Market size and forecast 2024-2029 ($ million)
Data Table on SME - Market size and forecast 2024-2029 ($ million)
Chart on SME - Year-over-year growth 2024-2029 (%)
Data Table on SME - Year-over-year growth 2024-2029 (%)

9.5 Market opportunity by Sector

Market opportunity by Sector ($ million)
Data Table on Market opportunity by Sector ($ million)

10. Market Segmentation by Application

10.1 Market segments

Chart on Application - Market share 2024-2029 (%)
Data Table on Application - Market share 2024-2029 (%)

10.2 Comparison by Application

Chart on Comparison by Application
Data Table on Comparison by Application

10.3 BFSI - Market size and forecast 2024-2029

Chart on BFSI - Market size and forecast 2024-2029 ($ million)
Data Table on BFSI - Market size and forecast 2024-2029 ($ million)
Chart on BFSI - Year-over-year growth 2024-2029 (%)
Data Table on BFSI - Year-over-year growth 2024-2029 (%)

10.4 Telecom - Market size and forecast 2024-2029

Chart on Telecom - Market size and forecast 2024-2029 ($ million)
Data Table on Telecom - Market size and forecast 2024-2029 ($ million)
Chart on Telecom - Year-over-year growth 2024-2029 (%)
Data Table on Telecom - Year-over-year growth 2024-2029 (%)

10.5 Healthcare - Market size and forecast 2024-2029

Chart on Healthcare - Market size and forecast 2024-2029 ($ million)
Data Table on Healthcare - Market size and forecast 2024-2029 ($ million)
Chart on Healthcare - Year-over-year growth 2024-2029 (%)
Data Table on Healthcare - Year-over-year growth 2024-2029 (%)

10.6 Others - Market size and forecast 2024-2029

Chart on Others - Market size and forecast 2024-2029 ($ million)
Data Table on Others - Market size and forecast 2024-2029 ($ million)
Chart on Others - Year-over-year growth 2024-2029 (%)
Data Table on Others - Year-over-year growth 2024-2029 (%)

10.7 Market opportunity by Application

Market opportunity by Application ($ million)
Data Table on Market opportunity by Application ($ million)

11. Customer Landscape

11.1 Customer landscape overview

Analysis of price sensitivity, lifecycle, customer purchase basket, adoption rates, and purchase criteria

12. Geographic Landscape

12.1 Geographic segmentation

Chart on Market share by geography 2024-2029 (%)
Data Table on Market share by geography 2024-2029 (%)

12.2 Geographic comparison

Chart on Geographic comparison
Data Table on Geographic comparison

12.3 North America - Market size and forecast 2024-2029

Chart on North America - Market size and forecast 2024-2029 ($ million)
Data Table on North America - Market size and forecast 2024-2029 ($ million)
Chart on North America - Year-over-year growth 2024-2029 (%)
Data Table on North America - Year-over-year growth 2024-2029 (%)
Chart on Regional Comparison - North America
Data Table on Regional Comparison - North America

12.3.1 US - Market size and forecast 2024-2029

Chart on US - Market size and forecast 2024-2029 ($ million)
Data Table on US - Market size and forecast 2024-2029 ($ million)
Chart on US - Year-over-year growth 2024-2029 (%)
Data Table on US - Year-over-year growth 2024-2029 (%)

12.3.2 Canada - Market size and forecast 2024-2029

Chart on Canada - Market size and forecast 2024-2029 ($ million)
Data Table on Canada - Market size and forecast 2024-2029 ($ million)
Chart on Canada - Year-over-year growth 2024-2029 (%)
Data Table on Canada - Year-over-year growth 2024-2029 (%)

12.3.3 Mexico - Market size and forecast 2024-2029

Chart on Mexico - Market size and forecast 2024-2029 ($ million)
Data Table on Mexico - Market size and forecast 2024-2029 ($ million)
Chart on Mexico - Year-over-year growth 2024-2029 (%)
Data Table on Mexico - Year-over-year growth 2024-2029 (%)

12.4 APAC - Market size and forecast 2024-2029

Chart on APAC - Market size and forecast 2024-2029 ($ million)
Data Table on APAC - Market size and forecast 2024-2029 ($ million)
Chart on APAC - Year-over-year growth 2024-2029 (%)
Data Table on APAC - Year-over-year growth 2024-2029 (%)
Chart on Regional Comparison - APAC
Data Table on Regional Comparison - APAC

12.4.1 China - Market size and forecast 2024-2029

Chart on China - Market size and forecast 2024-2029 ($ million)
Data Table on China - Market size and forecast 2024-2029 ($ million)
Chart on China - Year-over-year growth 2024-2029 (%)
Data Table on China - Year-over-year growth 2024-2029 (%)

12.4.2 India - Market size and forecast 2024-2029

Chart on India - Market size and forecast 2024-2029 ($ million)
Data Table on India - Market size and forecast 2024-2029 ($ million)
Chart on India - Year-over-year growth 2024-2029 (%)
Data Table on India - Year-over-year growth 2024-2029 (%)

12.4.3 Japan - Market size and forecast 2024-2029

Chart on Japan - Market size and forecast 2024-2029 ($ million)
Data Table on Japan - Market size and forecast 2024-2029 ($ million)
Chart on Japan - Year-over-year growth 2024-2029 (%)
Data Table on Japan - Year-over-year growth 2024-2029 (%)

12.4.4 Australia - Market size and forecast 2024-2029

Chart on Australia - Market size and forecast 2024-2029 ($ million)
Data Table on Australia - Market size and forecast 2024-2029 ($ million)
Chart on Australia - Year-over-year growth 2024-2029 (%)
Data Table on Australia - Year-over-year growth 2024-2029 (%)

12.4.5 South Korea - Market size and forecast 2024-2029

Chart on South Korea - Market size and forecast 2024-2029 ($ million)
Data Table on South Korea - Market size and forecast 2024-2029 ($ million)
Chart on South Korea - Year-over-year growth 2024-2029 (%)
Data Table on South Korea - Year-over-year growth 2024-2029 (%)

12.4.6 Singapore - Market size and forecast 2024-2029

Chart on Singapore - Market size and forecast 2024-2029 ($ million)
Data Table on Singapore - Market size and forecast 2024-2029 ($ million)
Chart on Singapore - Year-over-year growth 2024-2029 (%)
Data Table on Singapore - Year-over-year growth 2024-2029 (%)

12.5 Europe - Market size and forecast 2024-2029

Chart on Europe - Market size and forecast 2024-2029 ($ million)
Data Table on Europe - Market size and forecast 2024-2029 ($ million)
Chart on Europe - Year-over-year growth 2024-2029 (%)
Data Table on Europe - Year-over-year growth 2024-2029 (%)
Chart on Regional Comparison - Europe
Data Table on Regional Comparison - Europe

12.5.1 UK - Market size and forecast 2024-2029

Chart on UK - Market size and forecast 2024-2029 ($ million)
Data Table on UK - Market size and forecast 2024-2029 ($ million)
Chart on UK - Year-over-year growth 2024-2029 (%)
Data Table on UK - Year-over-year growth 2024-2029 (%)

12.5.2 Germany - Market size and forecast 2024-2029

Chart on Germany - Market size and forecast 2024-2029 ($ million)
Data Table on Germany - Market size and forecast 2024-2029 ($ million)
Chart on Germany - Year-over-year growth 2024-2029 (%)
Data Table on Germany - Year-over-year growth 2024-2029 (%)

12.5.3 France - Market size and forecast 2024-2029

Chart on France - Market size and forecast 2024-2029 ($ million)
Data Table on France - Market size and forecast 2024-2029 ($ million)
Chart on France - Year-over-year growth 2024-2029 (%)
Data Table on France - Year-over-year growth 2024-2029 (%)

12.5.4 Italy - Market size and forecast 2024-2029

Chart on Italy - Market size and forecast 2024-2029 ($ million)
Data Table on Italy - Market size and forecast 2024-2029 ($ million)
Chart on Italy - Year-over-year growth 2024-2029 (%)
Data Table on Italy - Year-over-year growth 2024-2029 (%)

12.5.5 The Netherlands - Market size and forecast 2024-2029

Chart on The Netherlands - Market size and forecast 2024-2029 ($ million)
Data Table on The Netherlands - Market size and forecast 2024-2029 ($ million)
Chart on The Netherlands - Year-over-year growth 2024-2029 (%)
Data Table on The Netherlands - Year-over-year growth 2024-2029 (%)

12.5.6 Spain - Market size and forecast 2024-2029

Chart on Spain - Market size and forecast 2024-2029 ($ million)
Data Table on Spain - Market size and forecast 2024-2029 ($ million)
Chart on Spain - Year-over-year growth 2024-2029 (%)
Data Table on Spain - Year-over-year growth 2024-2029 (%)

12.6 South America - Market size and forecast 2024-2029

Chart on South America - Market size and forecast 2024-2029 ($ million)
Data Table on South America - Market size and forecast 2024-2029 ($ million)
Chart on South America - Year-over-year growth 2024-2029 (%)
Data Table on South America - Year-over-year growth 2024-2029 (%)
Chart on Regional Comparison - South America
Data Table on Regional Comparison - South America

12.6.1 Brazil - Market size and forecast 2024-2029

Chart on Brazil - Market size and forecast 2024-2029 ($ million)
Data Table on Brazil - Market size and forecast 2024-2029 ($ million)
Chart on Brazil - Year-over-year growth 2024-2029 (%)
Data Table on Brazil - Year-over-year growth 2024-2029 (%)

12.6.2 Argentina - Market size and forecast 2024-2029

Chart on Argentina - Market size and forecast 2024-2029 ($ million)
Data Table on Argentina - Market size and forecast 2024-2029 ($ million)
Chart on Argentina - Year-over-year growth 2024-2029 (%)
Data Table on Argentina - Year-over-year growth 2024-2029 (%)

12.6.3 Colombia - Market size and forecast 2024-2029

Chart on Colombia - Market size and forecast 2024-2029 ($ million)
Data Table on Colombia - Market size and forecast 2024-2029 ($ million)
Chart on Colombia - Year-over-year growth 2024-2029 (%)
Data Table on Colombia - Year-over-year growth 2024-2029 (%)

12.7 Middle East and Africa - Market size and forecast 2024-2029

Chart on Middle East and Africa - Market size and forecast 2024-2029 ($ million)
Data Table on Middle East and Africa - Market size and forecast 2024-2029 ($ million)
Chart on Middle East and Africa - Year-over-year growth 2024-2029 (%)
Data Table on Middle East and Africa - Year-over-year growth 2024-2029 (%)
Chart on Regional Comparison - Middle East and Africa
Data Table on Regional Comparison - Middle East and Africa

12.7.1 South Africa - Market size and forecast 2024-2029

Chart on South Africa - Market size and forecast 2024-2029 ($ million)
Data Table on South Africa - Market size and forecast 2024-2029 ($ million)
Chart on South Africa - Year-over-year growth 2024-2029 (%)
Data Table on South Africa - Year-over-year growth 2024-2029 (%)

12.7.2 UAE - Market size and forecast 2024-2029

Chart on UAE - Market size and forecast 2024-2029 ($ million)
Data Table on UAE - Market size and forecast 2024-2029 ($ million)
Chart on UAE - Year-over-year growth 2024-2029 (%)
Data Table on UAE - Year-over-year growth 2024-2029 (%)

12.7.3 Saudi Arabia - Market size and forecast 2024-2029

Chart on Saudi Arabia - Market size and forecast 2024-2029 ($ million)
Data Table on Saudi Arabia - Market size and forecast 2024-2029 ($ million)
Chart on Saudi Arabia - Year-over-year growth 2024-2029 (%)
Data Table on Saudi Arabia - Year-over-year growth 2024-2029 (%)

12.7.4 Egypt - Market size and forecast 2024-2029

Chart on Egypt - Market size and forecast 2024-2029 ($ million)
Data Table on Egypt - Market size and forecast 2024-2029 ($ million)
Chart on Egypt - Year-over-year growth 2024-2029 (%)
Data Table on Egypt - Year-over-year growth 2024-2029 (%)

12.7.5 Kenya - Market size and forecast 2024-2029

Chart on Kenya - Market size and forecast 2024-2029 ($ million)
Data Table on Kenya - Market size and forecast 2024-2029 ($ million)
Chart on Kenya - Year-over-year growth 2024-2029 (%)
Data Table on Kenya - Year-over-year growth 2024-2029 (%)

12.8 Market opportunity by geography

Market opportunity by geography ($ million)
Data Tables on Market opportunity by geography ($ million)

13. Drivers, Challenges, and Opportunity

13.1 Market drivers

Increasing operational efficiency and cost reduction
Enhanced customer experience and compliance adherence
Advanced data analytics and predictive capabilities

13.2 Market challenges

Regulatory compliance and ethical AI deployment
Data privacy, security, and quality concerns
High implementation costs and integration complexity

13.3 Impact of drivers and challenges

Impact of drivers and challenges in 2024 and 2029

13.4 Market opportunities

Escalating digital transformation and automation in financial services
Growing sophistication of AI and machine learning algorithms
Increasing pressure to optimize operational costs and enhance customer experience

14. Competitive Landscape

14.1 Overview

14.2

Overview on criticality of inputs and factors of differentiation

14.3 Landscape disruption

Overview on factors of disruption

14.4 Industry risks

Impact of key risks on business

15. Competitive Analysis

15.1 Companies profiled

Companies covered

15.2 Company ranking index

15.3 Market positioning of companies

Matrix on companies position and classification

15.4 Analog Legalhub Technology Solutions Pvt. Ltd.

Analog Legalhub Technology Solutions Pvt. Ltd. - Overview
Analog Legalhub Technology Solutions Pvt. Ltd. - Product / Service
Analog Legalhub Technology Solutions Pvt. Ltd. - Key offerings
SWOT

15.5 collect Artificial Intelligence GmbH

collect Artificial Intelligence GmbH - Overview
collect Artificial Intelligence GmbH - Product / Service
collect Artificial Intelligence GmbH - Key offerings
SWOT

15.6 Experian Plc

Experian Plc - Overview
Experian Plc - Business segments
Experian Plc - Key offerings
Experian Plc - Segment focus
SWOT

15.7 Fair Isaac Corp.

Fair Isaac Corp. - Overview
Fair Isaac Corp. - Business segments
Fair Isaac Corp. - Key news
Fair Isaac Corp. - Key offerings
Fair Isaac Corp. - Segment focus
SWOT

15.8 Finvi

Finvi - Overview
Finvi - Product / Service
Finvi - Key offerings
SWOT

15.9 InDebted Holdings Pty Ltd

InDebted Holdings Pty Ltd - Overview
InDebted Holdings Pty Ltd - Product / Service
InDebted Holdings Pty Ltd - Key offerings
SWOT

15.10 Intellect Design Arena Ltd.

Intellect Design Arena Ltd. - Overview
Intellect Design Arena Ltd. - Product / Service
Intellect Design Arena Ltd. - Key offerings
SWOT

15.11 LexisNexis Risk Solutions.

LexisNexis Risk Solutions. - Overview
LexisNexis Risk Solutions. - Product / Service
LexisNexis Risk Solutions. - Key offerings
SWOT

15.12 PAIR Finance Group

PAIR Finance Group - Overview
PAIR Finance Group - Product / Service
PAIR Finance Group - Key offerings
SWOT

15.13 Pegasystems Inc.

Pegasystems Inc. - Overview
Pegasystems Inc. - Product / Service
Pegasystems Inc. - Key offerings
SWOT

15.14 QUALCO

QUALCO - Overview
QUALCO - Product / Service
QUALCO - Key offerings
SWOT

15.15 Temenos AG

Temenos AG - Overview
Temenos AG - Business segments
Temenos AG - Key offerings
Temenos AG - Segment focus
SWOT

15.16 Tesorio Inc

Tesorio Inc - Overview
Tesorio Inc - Product / Service
Tesorio Inc - Key offerings
SWOT

15.17 TransUnion

TransUnion - Overview
TransUnion - Business segments
TransUnion - Key news
TransUnion - Key offerings
TransUnion - Segment focus
SWOT

15.18 TrueAccord

TrueAccord - Overview
TrueAccord - Product / Service
TrueAccord - Key offerings
SWOT

16. Appendix

16.1 Scope of the report

Market definition
Objectives
Notes and caveats

16.2 Inclusions and exclusions checklist

Inclusions checklist
Exclusions checklist

16.3 Currency conversion rates for US$

16.4 Research methodology

16.5 Data procurement

Information sources

16.6 Data validation

16.7 Validation techniques employed for market sizing

16.8 Data synthesis

16.9 360 degree market analysis

16.10 List of abbreviations

Research Methodology

Technavio presents a detailed picture of the market by way of study, synthesis, and summation of data from multiple sources. The analysts have presented the various facets of the market with a particular focus on identifying the key industry influencers. The data thus presented is comprehensive, reliable, and the result of extensive research, both primary and secondary.

INFORMATION SOURCES

Primary sources

  • Manufacturers and suppliers
  • Channel partners
  • Industry experts
  • Strategic decision makers

Secondary sources

  • Industry journals and periodicals
  • Government data
  • Financial reports of key industry players
  • Historical data
  • Press releases

DATA ANALYSIS

Data Synthesis

  • Collation of data
  • Estimation of key figures
  • Analysis of derived insights

Data Validation

  • Triangulation with data models
  • Reference against proprietary databases
  • Corroboration with industry experts

REPORT WRITING

Qualitative

  • Market drivers
  • Market challenges
  • Market trends
  • Five forces analysis

Quantitative

  • Market size and forecast
  • Market segmentation
  • Geographical insights
  • Competitive landscape

Interested in this report?

Get your sample now to see our research methodology and insights!

Download Now

Frequently Asked Questions

AI For Debt Collection market growth will increase by USD 2771.5 million during 2025-2029 .

The AI For Debt Collection market is expected to grow at a CAGR of 15% during 2025-2029 .

AI For Debt Collection market is segmented by Component (Software, Service) Deployment (Cloud-based, On-premises) Sector (Large enterprises, SME) Application (BFSI, Telecom, Healthcare, Others)

Analog Legalhub Technology Solutions Pvt. Ltd., Chetu Inc., collect Artificial Intelligence GmbH, Debtist GmbH, Experian Plc, Fair Isaac Corp., Finvi, IC System Inc, InDebted Holdings Pty Ltd, Intellect Design Arena Ltd., Intelligent Contacts Inc, LexisNexis Risk Solutions., Loxon Solutions Zrt., PAIR Finance Group, Pegasystems Inc., QUALCO, Temenos AG, Tesorio Inc, TransUnion, TrueAccord are a few of the key vendors in the AI For Debt Collection market.

North America will register the highest growth rate of 31.3% among the other regions. Therefore, the AI For Debt Collection market in North America is expected to garner significant business opportunities for the vendors during the forecast period.

US, Canada, Mexico, China, India, Japan, Australia, South Korea, Singapore, UK, Germany, France, Italy, The Netherlands, Spain, Brazil, Argentina, Colombia, South Africa, UAE, Saudi Arabia, Egypt, Kenya

  • Increasing operational efficiency and cost reduction is the driving factor this market.

The AI For Debt Collection market vendors should focus on grabbing business opportunities from the Component segment as it accounted for the largest market share in the base year.