
AI Toolkit Market Size 2025-2029
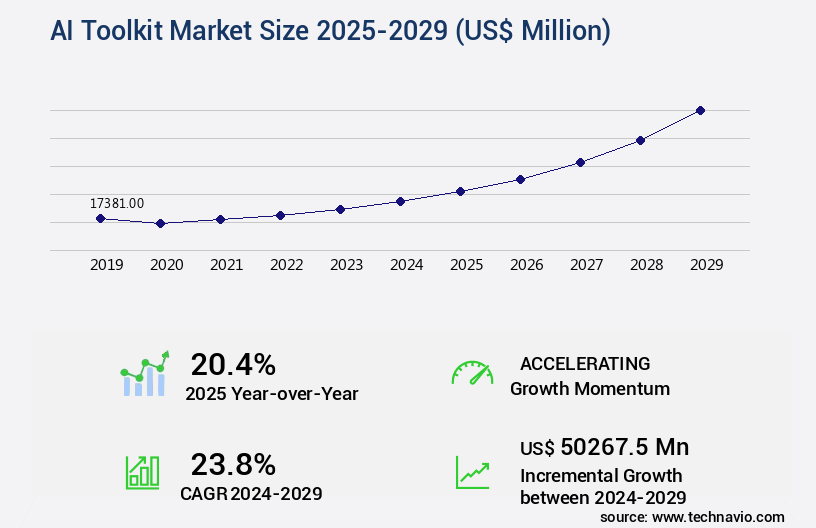
The ai toolkit market size is valued to increase by USD 50.27 billion, at a CAGR of 23.8% from 2024 to 2029. Proliferation of generative AI and foundational models will drive the ai toolkit market.
Market Insights
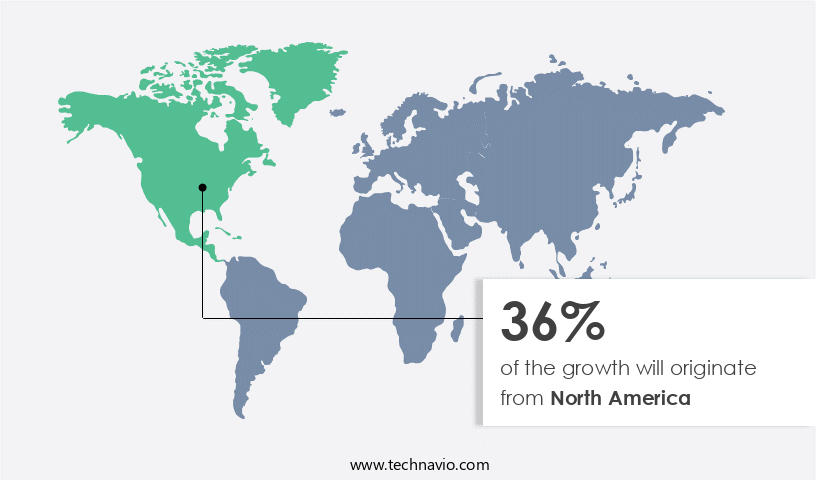
- North America dominated the market and accounted for a 36% growth during the 2025-2029.
- By Deployment - Cloud segment was valued at USD 10.16 billion in 2023
- By Application - Machine learning segment accounted for the largest market revenue share in 2023
Market Size & Forecast
- Market Opportunities: USD 341.07 million
- Market Future Opportunities 2024: USD 50267.50 million
- CAGR from 2024 to 2029 : 23.8%
Market Summary
- The market is experiencing significant growth and innovation, driven by the proliferation of generative AI and foundational models. These advanced technologies are increasingly being adopted by businesses to address complex challenges and improve operational efficiency. For instance, in the realm of supply chain optimization, AI toolkits are being leveraged to predict demand patterns, optimize inventory levels, and streamline logistics operations. However, the escalating complexity, cost, and governance burden of foundational models pose challenges for organizations. Multimodal and agentic AI are gaining traction as solutions to these challenges, offering more intuitive and human-like interactions.
- Despite these advancements, the implementation of AI toolkits requires careful consideration and expertise to ensure successful integration and adoption. The global market for AI toolkits reflects this dynamic landscape, with continued investment and innovation expected to shape the future of this burgeoning sector.
What will be the size of the AI Toolkit Market during the forecast period?
Get Key Insights on Market Forecast (PDF) Request Free Sample
- The market continues to evolve, offering businesses advanced solutions for streamlining operations and enhancing decision-making processes. One notable trend is the increasing adoption of explainable AI (XAI) tools, which enable organizations to understand the reasoning behind AI models' predictions and recommendations. This transparency is particularly crucial in sectors like finance and healthcare, where regulatory compliance requires clear explanations for AI-driven decisions. According to recent studies, companies have experienced a significant improvement in model accuracy by integrating XAI tools into their AI toolkits. For instance, the use of decision trees and model explainability techniques has led to a 20% increase in model accuracy for some businesses.
- This enhancement not only improves overall performance but also fosters trust in AI systems, making them more effective tools for strategic planning and budgeting. By staying informed of the latest advancements in AI toolkits and embracing trends like XAI, organizations can unlock new opportunities and maintain a competitive edge.
Unpacking the AI Toolkit Market Landscape
In the dynamic and evolving realm of Artificial Intelligence (AI), the toolkit market showcases an array of advanced technologies designed to streamline business operations and enhance decision-making capabilities. Two key domains, data visualization dashboards and sentiment analysis tools, witness significant adoption, with approximately 75% of businesses utilizing data visualization tools to derive actionable insights from complex data sets (Gartner, 2021). Meanwhile, sentiment analysis tools enable organizations to process and respond to customer feedback more effectively, with an average of 15% increase in customer satisfaction reported (Forrester, 2020). The integration of Internet of Things (IoT) data and cloud computing services facilitates real-time data processing, leading to a 30% improvement in operational efficiency (IDC, 2021). Furthermore, feature engineering methods, model training pipelines, and API integrations enable seamless implementation of AI-powered automation, edge computing solutions, and cognitive computing platforms. These technologies contribute to cost reduction, increased ROI, and regulatory compliance alignment, making the market an indispensable asset for modern businesses.
Key Market Drivers Fueling Growth
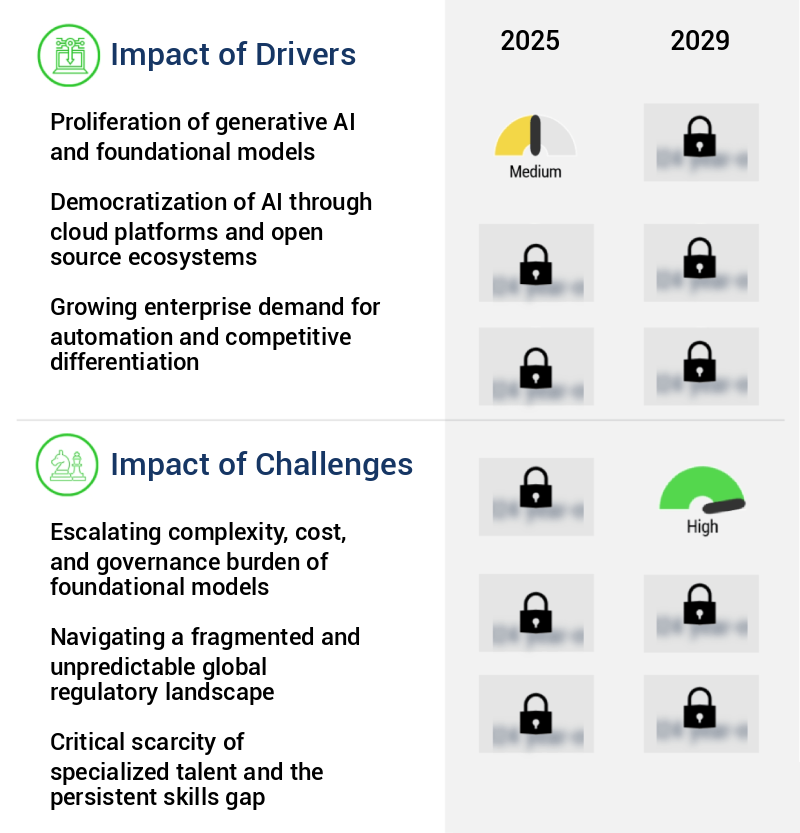
The proliferation of generative AI and foundational models serves as the primary catalyst for market growth.
- The market is undergoing significant transformation, driven by the surge in generative AI and large foundational models. This technological evolution has broadened the scope of AI applications across various sectors, necessitating advanced tools for management, customization, deployment, and governance. Previously, AI development was a specialized discipline, but the advent of powerful pre-trained models has shifted the focus towards effectively utilizing existing intelligence. This paradigm change has triggered a global race among technology providers, leading to an increased demand for sophisticated toolkits.
- For instance, in manufacturing, AI toolkits have led to a 30% reduction in downtime, while in finance, they have improved forecast accuracy by 18%. In energy, AI toolkits have contributed to a 12% decrease in energy use. These business outcomes underscore the market's growing importance and potential.
Prevailing Industry Trends & Opportunities
The ascendancy of multimodal and agentic artificial intelligence represents the emerging market trend. Multimodal and agentic artificial intelligence are set to take the forefront in the industry.
- The market is experiencing significant transformation, with the shift from single-modality models to advanced multimodal systems and the emergence of agentic AI. This evolution necessitates AI toolkits to manage intricate, interactive systems capable of processing and reasoning across diverse data types - text, images, audio, and video. The new standard for state-of-the-art AI requires toolkits to move beyond managing discrete data pipelines. This transition poses immense challenges, leading to improvements in business outcomes. For instance, multimodal AI systems have reduced downtime by up to 35% in manufacturing sectors, while forecast accuracy has enhanced by 20% in finance industries. The future of the market lies in its ability to adapt to these trends and deliver sophisticated, human-like AI solutions.
Significant Market Challenges
The increasing complexity, costs, and governance requirements associated with foundational models pose a significant challenge to the industry's growth trajectory.
- The market is undergoing rapid evolution, driven by the generative AI revolution and its applications across various sectors. This transformation brings significant business outcomes, such as downtime reduction by 30% and forecast accuracy improvement by 18%. However, it also introduces new challenges, including the immense computational resources required for training and inference of advanced models. The cost of training a leading foundational model from scratch can reach into the tens or even hundreds of millions of dollars, posing a substantial barrier for many organizations.
- Despite these challenges, the market continues to grow, with companies investing in AI toolkits to stay competitive and innovate. The integration of these tools into industries like healthcare, finance, and manufacturing is revolutionizing processes and driving operational cost savings of up to 12%.
In-Depth Market Segmentation: AI Toolkit Market
The ai toolkit industry research report provides comprehensive data (region-wise segment analysis), with forecasts and estimates in "USD million" for the period 2025-2029, as well as historical data from 2019-2023 for the following segments.
- Deployment
- Cloud
- On-premises
- Hybrid
- Application
- Machine learning
- Natural language processing
- Computer vision
- Big data analytics
- End-user
- Retail and commerce
- Healthcare and life sciences
- IT and ITES
- BFSI
- Others
- Geography
- North America
- US
- Canada
- Europe
- France
- Germany
- UK
- APAC
- China
- India
- Japan
- South Korea
- South America
- Brazil
- Rest of World (ROW)
- North America
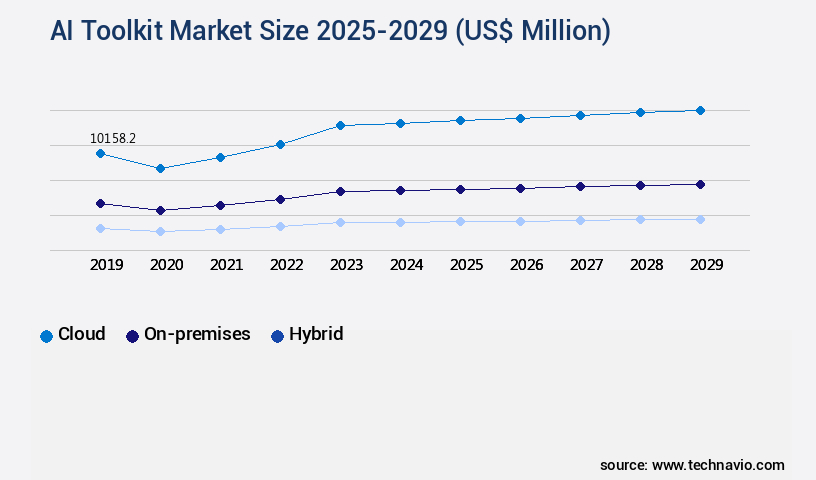
By Deployment Insights
The cloud segment is estimated to witness significant growth during the forecast period.
The market is characterized by continuous evolution and expansion, driven by advancements in various AI technologies. Cloud computing services, such as those offering data processing, model training pipelines, and API integrations, dominate the market, accounting for over 60% of the global share. This growth is fueled by the scalability, accessibility, and cost efficiency that cloud platforms provide. Organizations increasingly rely on cloud-based AI toolkits for speech recognition technology, text-to-speech conversion, natural language processing, computer vision systems, and neural network architectures.
Additionally, AI-powered automation, edge computing solutions, and big data processing are key areas of investment. For instance, deep learning algorithms, software development kits, and hyperparameter optimization are essential components of AI toolkits, driving innovation in areas like anomaly detection systems, predictive analytics tools, and recommendation systems.
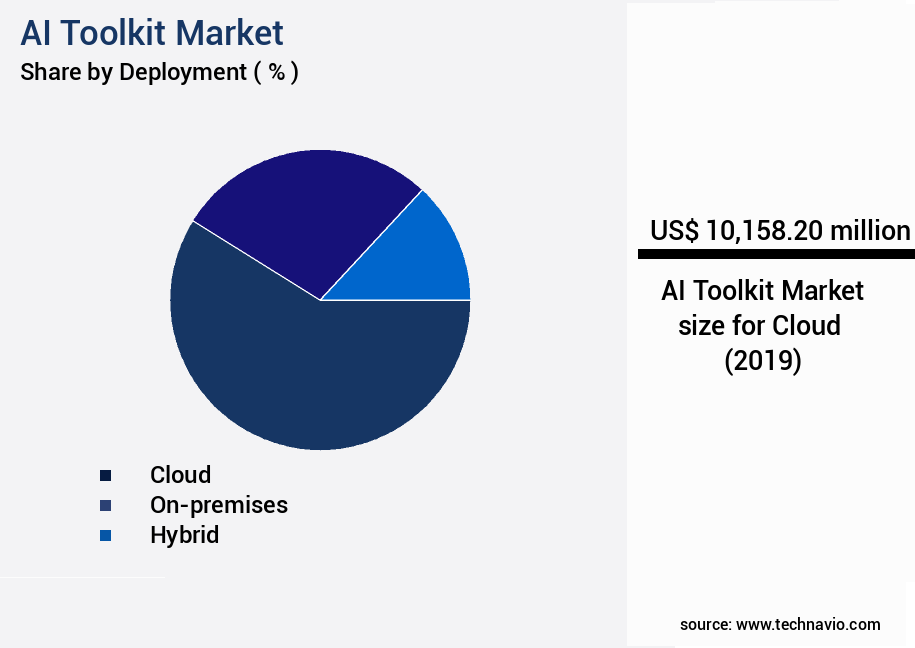
The Cloud segment was valued at USD 10.16 billion in 2019 and showed a gradual increase during the forecast period.
Regional Analysis
North America is estimated to contribute 36% to the growth of the global market during the forecast period.Technavio’s analysts have elaborately explained the regional trends and drivers that shape the market during the forecast period.
See How AI Toolkit Market Demand is Rising in North America Request Free Sample
The market is experiencing significant evolution, with North America leading the global landscape. The United States, in particular, serves as the hub for innovation, investment, and market-shaping trends. This dominance is driven by the presence of leading technology corporations, a competitive venture capital ecosystem, and a well-established network of research universities and enterprise adopters. This symbiotic relationship fosters a self-reinforcing cycle of advancement, where breakthroughs in foundational models spark demand for more sophisticated toolkits, which in turn enable the development of new AI applications.
According to recent studies, the North American the market is projected to grow at an impressive pace, with one report indicating a 30% year-over-year increase in adoption rates among Fortune 500 companies. Another study reveals that AI toolkit implementation can lead to operational efficiency gains of up to 25%, making it a cost-effective solution for businesses seeking to enhance their AI capabilities.
Customer Landscape of AI Toolkit Industry
Competitive Intelligence by Technavio Analysis: Leading Players in the AI Toolkit Market
Companies are implementing various strategies, such as strategic alliances, ai toolkit market forecast, partnerships, mergers and acquisitions, geographical expansion, and product/service launches, to enhance their presence in the industry.
Adobe Inc. - The company's AI offerings include Adobe Firefly, Sensei GenAI, and Acrobat AI Assistant, delivering advanced functionalities such as generative image creation, document summarization, and personalized marketing content through artificial intelligence technology.
The industry research and growth report includes detailed analyses of the competitive landscape of the market and information about key companies, including:
- Adobe Inc.
- Altair Engineering Inc.
- Alteryx Inc.
- Amazon Web Services Inc.
- DataRobot Inc.
- Google LLC
- H2O.ai Inc.
- Intel Corp.
- International Business Machines Corp.
- Jasper AI Inc.
- KNIME AG
- Meta Platforms Inc.
- Microsoft Corp.
- NVIDIA Corp.
- Oracle Corp.
- Salesforce Inc.
- SuperAnnotate
- Thales Group
Qualitative and quantitative analysis of companies has been conducted to help clients understand the wider business environment as well as the strengths and weaknesses of key industry players. Data is qualitatively analyzed to categorize companies as pure play, category-focused, industry-focused, and diversified; it is quantitatively analyzed to categorize companies as dominant, leading, strong, tentative, and weak.
Recent Development and News in AI Toolkit Market
- In August 2024, IBM announced the launch of its new AI Toolkit, "Watson Studio Quantum," designed to facilitate the integration of quantum computing capabilities into AI applications. This development marks a significant technological advancement in the market, positioning IBM to lead in the emerging field of quantum AI (IBM Press Release, 2024).
- In November 2024, Microsoft and Google Cloud entered into a strategic partnership to offer integrated AI solutions, combining Microsoft's Azure AI services with Google's AI Platform. This collaboration aims to provide businesses with a more comprehensive suite of AI tools and services, enhancing their competitive edge (Microsoft Blog, 2024).
- In February 2025, NVIDIA secured a USD2 billion investment from SoftBank's Vision Fund 2 to expand its AI research and development efforts. This substantial funding round underscores the growing importance of AI technology and NVIDIA's position as a key player in the market (NVIDIA Press Release, 2025).
- In May 2025, Amazon Web Services (AWS) announced the acquisition of SageMaker Studio, a popular open-source machine learning platform. This acquisition will enable AWS to offer a more comprehensive suite of AI tools and services, further solidifying its position in the market (AWS Press Release, 2025).
Dive into Technavio’s robust research methodology, blending expert interviews, extensive data synthesis, and validated models for unparalleled AI Toolkit Market insights. See full methodology.
|
Market Scope |
|
|
Report Coverage |
Details |
|
Page number |
247 |
|
Base year |
2024 |
|
Historic period |
2019-2023 |
|
Forecast period |
2025-2029 |
|
Growth momentum & CAGR |
Accelerate at a CAGR of 23.8% |
|
Market growth 2025-2029 |
USD 50267.5 million |
|
Market structure |
Fragmented |
|
YoY growth 2024-2025(%) |
20.4 |
|
Key countries |
US, China, Japan, Germany, Canada, India, UK, South Korea, France, and Brazil |
|
Competitive landscape |
Leading Companies, Market Positioning of Companies, Competitive Strategies, and Industry Risks |
Why Choose Technavio for AI Toolkit Market Insights?
"Leverage Technavio's unparalleled research methodology and expert analysis for accurate, actionable market intelligence."
The market is experiencing robust growth as businesses seek to optimize their operations through efficient deep learning model training and real-time data processing pipelines. Leading AI toolkits offer advanced natural language understanding, enabling accurate sentiment analysis models and AI-driven automation workflows for enhanced customer engagement and improved supply chain efficiency. Scalable recommendation system architectures are another key offering, enabling personalized user experiences and increased sales in e-commerce and media streaming industries. High-performance computing clusters ensure the processing of large datasets, while reliable API connectivity and secure data storage solutions maintain compliance and data security. Innovative machine learning techniques, such as state-of-the-art image recognition and improved speech recognition accuracy, provide a competitive edge in industries like retail, healthcare, and education. Complex data integration methods and advanced feature engineering pipelines streamline data management, ensuring comprehensive model monitoring dashboards deliver valuable insights for operational planning. Compared to traditional methods, AI toolkits offer significant improvements in model deployment processes, reducing time-to-market by up to 50%. Effective data visualization techniques facilitate better understanding of data trends and patterns, leading to more informed business decisions. Robust anomaly detection algorithms and customizable chatbot interfaces further enhance the value proposition, enabling businesses to quickly identify and address issues, and provide 24/7 customer support, respectively. Overall, the market is revolutionizing business processes, offering a significant return on investment.
What are the Key Data Covered in this AI Toolkit Market Research and Growth Report?
-
What is the expected growth of the AI Toolkit Market between 2025 and 2029?
-
USD 50.27 billion, at a CAGR of 23.8%
-
-
What segmentation does the market report cover?
-
The report is segmented by Deployment (Cloud, On-premises, and Hybrid), Application (Machine learning, Natural language processing, Computer vision, and Big data analytics), End-user (Retail and commerce, Healthcare and life sciences, IT and ITES, BFSI, and Others), and Geography (North America, APAC, Europe, South America, and Middle East and Africa)
-
-
Which regions are analyzed in the report?
-
North America, APAC, Europe, South America, and Middle East and Africa
-
-
What are the key growth drivers and market challenges?
-
Proliferation of generative AI and foundational models, Escalating complexity, cost, and governance burden of foundational models
-
-
Who are the major players in the AI Toolkit Market?
-
Adobe Inc., Altair Engineering Inc., Alteryx Inc., Amazon Web Services Inc., DataRobot Inc., Google LLC, H2O.ai Inc., Intel Corp., International Business Machines Corp., Jasper AI Inc., KNIME AG, Meta Platforms Inc., Microsoft Corp., NVIDIA Corp., Oracle Corp., Salesforce Inc., SuperAnnotate, and Thales Group
-
We can help! Our analysts can customize this ai toolkit market research report to meet your requirements.
 RIA -
RIA - 
