
AI In Fraud Management Market Size 2025-2029
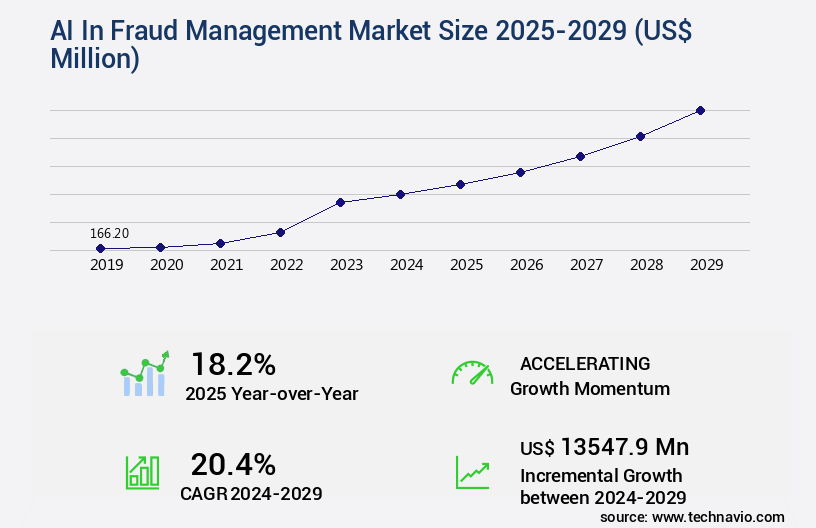
The AI in fraud management market size is valued to increase by USD 13.55 billion, at a CAGR of 20.4% from 2024 to 2029. Escalating sophistication and volume of fraudulent activities will drive the ai in fraud management market.
Major Market Trends & Insights
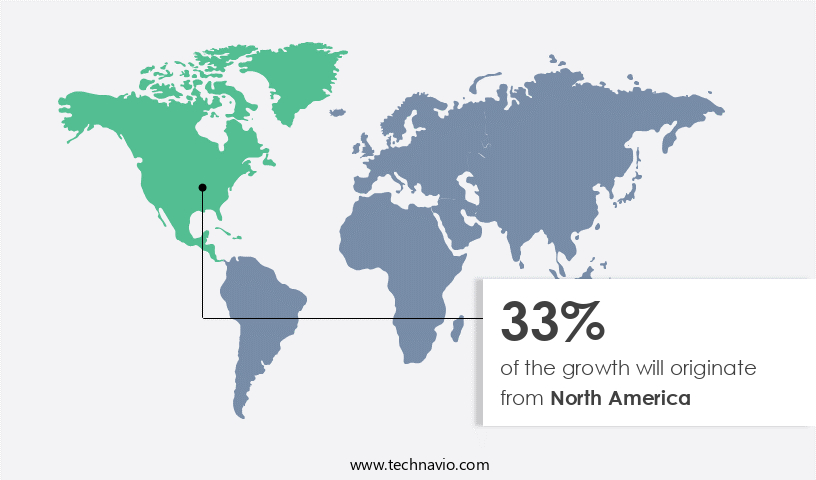
- North America dominated the market and accounted for a 33% growth during the forecast period.
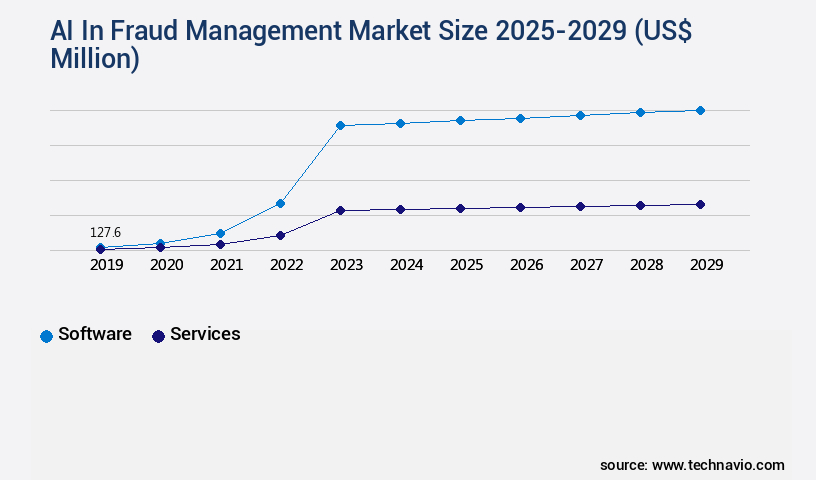
- By Solution - Software segment was valued at USD 127.60 billion in 2023
- By Application - Identity theft protection segment accounted for the largest market revenue share in 2023
Market Size & Forecast
- Market Opportunities: USD 13.00 million
- Market Future Opportunities: USD 13547.90 million
- CAGR from 2024 to 2029 : 20.4%
Market Summary
- In the realm of business operations, fraud management has emerged as a critical function, with AI technology playing an increasingly significant role. According to recent studies, The market is projected to reach a value of USD30.6 billion by 2026, underscoring its growing importance. This growth is fueled by the escalating sophistication and volume of fraudulent activities, which demand more advanced solutions. AI's ability to analyze vast amounts of data and identify patterns that humans might miss is proving invaluable in fraud detection. However, the dual-use dilemma poses a challenge, as AI systems can also be used to perpetrate fraud.
- Consequently, proactive defense strategies employing generative AI are gaining traction, enabling businesses to stay one step ahead of evolving threats. Data quality, privacy, and accessibility constraints present another hurdle. AI systems require large, clean datasets for effective training and performance. Ensuring data privacy and security is crucial, as sensitive information is often involved. Balancing these concerns with the need for real-time fraud detection is a complex task, requiring a nuanced understanding of both technology and business operations. Despite these challenges, the future of AI in fraud management looks bright. Continued advancements in machine learning and natural language processing will enhance fraud detection capabilities, while increased collaboration between technology providers and businesses will lead to more effective solutions. As the landscape evolves, AI will remain a vital tool in the fight against fraud.
What will be the Size of the AI In Fraud Management Market during the forecast period?
Get Key Insights on Market Forecast (PDF) Request Free Sample
How is the AI In Fraud Management Market Segmented ?
The ai in fraud management industry research report provides comprehensive data (region-wise segment analysis), with forecasts and estimates in "USD million" for the period 2025-2029, as well as historical data from 2019-2023 for the following segments.
- Solution
- Software
- Services
- Application
- Identity theft protection
- Payment fraud prevention
- Anti-money laundering
- Others
- Sector
- BFSI
- Retail and consumer packaged goods
- Healthcare
- Government
- Others
- Geography
- North America
- US
- Canada
- Europe
- France
- Germany
- UK
- APAC
- China
- India
- Japan
- South Korea
- South America
- Brazil
- Rest of World (ROW)
- North America
By Solution Insights
The software segment is estimated to witness significant growth during the forecast period.
In the ever-evolving landscape of fraud management, AI technology plays a pivotal role in fortifying security and mitigating risks. The software segment, a significant market driver, houses advanced platforms and applications that autonomously detect and prevent fraudulent activities. These solutions employ a cutting-edge toolkit, including machine learning models, cybersecurity measures, and identity verification methods, to analyze data in real time. They surpass the constraints of traditional, rule-based systems, adapting to modern, sophisticated fraud tactics. By learning from historical data, AI software uncovers intricate patterns, anomalies, and hidden correlations, enhancing fraud investigation and risk management strategies. Anomaly detection systems, threat intelligence platforms, and behavioral biometrics analysis are integral components, providing robust vulnerability management and privacy regulations compliance.
The market's growth is further fueled by AI-powered risk assessment, decision support systems, and real-time fraud scoring. A recent study reveals that AI fraud detection algorithms have reduced false positives by up to 95%, underscoring their effectiveness. Integrating AI into fraud management not only bolsters security but also streamlines processes, enabling organizations to stay ahead of the curve in this dynamic threat landscape.
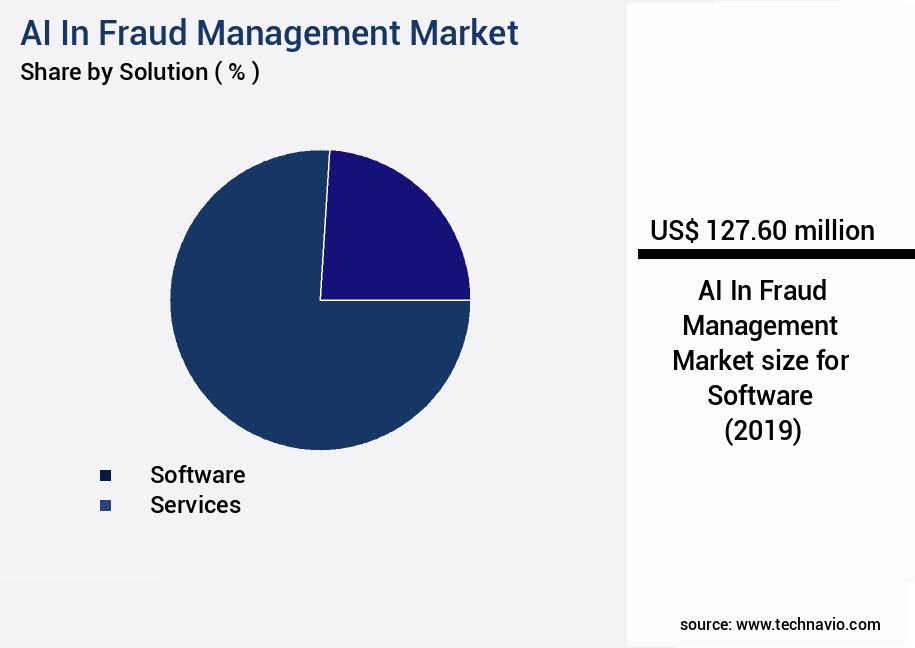
The Software segment was valued at USD 127.60 billion in 2019 and showed a gradual increase during the forecast period.
Regional Analysis
North America is estimated to contribute 33% to the growth of the global market during the forecast period.Technavio's analysts have elaborately explained the regional trends and drivers that shape the market during the forecast period.
See How AI In Fraud Management Market Demand is Rising in North America Request Free Sample
The market is witnessing significant growth and transformation, with North America leading the charge. This region, primarily driven by the United States and Canada, is the largest and most mature market due to its highly developed digital economy, presence of leading technology companies and financial institutions, and complex regulatory environment. The surge in digital transactions across e-commerce, banking, and real-time payment networks in industries such as financial services, retail, and healthcare necessitates advanced fraud prevention solutions. AI's ability to analyze vast amounts of data in real-time and identify patterns and anomalies makes it an invaluable tool in combating various fraud threats, from credit card fraud and insurance scams to complex synthetic identity fraud.
According to recent studies, the North American market is expected to account for over 40% of the global market share by 2027, with a compound annual growth rate (CAGR) of approximately 20%. Another report suggests that The market is projected to reach a value of around USD100 billion by 2025.
Market Dynamics
Our researchers analyzed the data with 2024 as the base year, along with the key drivers, trends, and challenges. A holistic analysis of drivers will help companies refine their marketing strategies to gain a competitive advantage.
The market is experiencing significant growth as financial institutions seek to mitigate risks and prevent financial crime using advanced technologies. Machine learning algorithms are increasingly being applied to fraud detection, enabling real-time identification of suspicious transactions through AI-driven fraud prevention strategies. Behavioral biometrics and network analysis are key components of these systems, allowing for the detection of anomalous user behavior and unusual network activity. Improving accuracy in fraud detection models is a critical priority for financial institutions, and AI-powered solutions offer significant advantages. By leveraging big data and automated fraud detection workflows, institutions can build robust models that optimize performance and reduce false positives, ensuring efficient fraud investigations.
Cloud-based fraud detection systems are gaining popularity due to their scalability and ease of integration with existing fraud detection systems. Advanced analytics and regulatory compliance are essential features of these solutions, enabling institutions to enhance security measures in payment systems and prevent financial crime. Network analysis for financial fraud detection involves examining patterns and relationships within data to identify potential threats. This approach complements behavioral biometrics, which focuses on user behavior, providing a comprehensive fraud detection solution. By combining these technologies, financial institutions can develop effective fraud prevention strategies that minimize risks and ensure regulatory compliance. In conclusion, The market is transforming the way financial institutions approach fraud detection and prevention. Through the application of machine learning, behavioral biometrics, network analysis, and advanced analytics, institutions can optimize performance, reduce false positives, and enhance security measures, ultimately preventing financial crime and ensuring regulatory compliance.
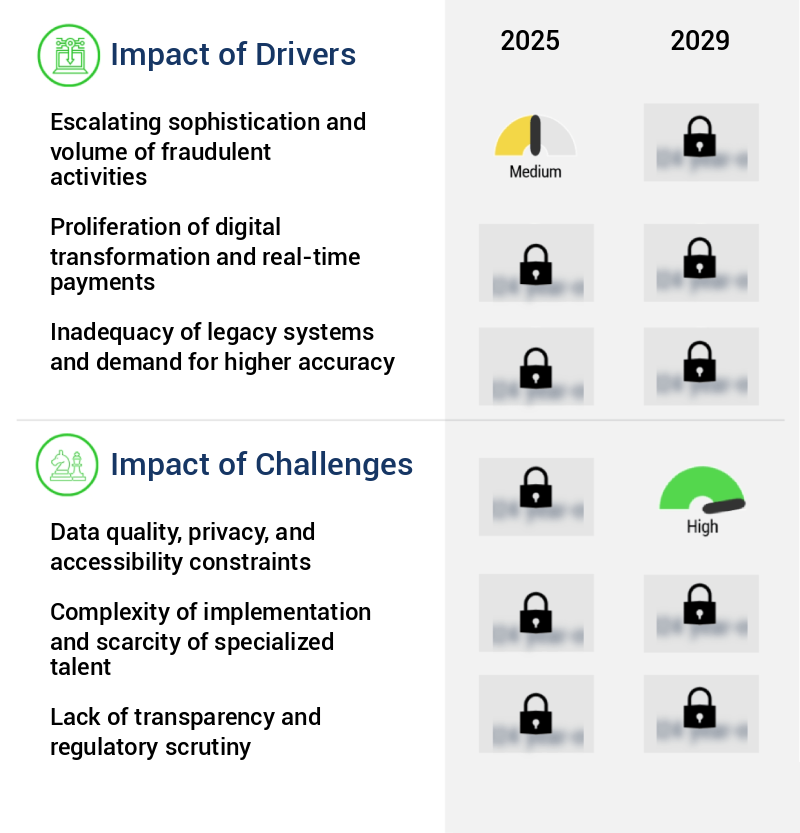
What are the key market drivers leading to the rise in the adoption of AI In Fraud Management Industry?
- The increasing complexity and quantity of fraudulent activities serve as the primary catalyst for market growth.
- The market is experiencing significant growth due to the escalating volume and sophistication of fraudulent activities in the digital landscape. Fraudsters, often operating in organized networks, employ advanced techniques that render traditional security measures obsolete. The vast attack surface of digital interactions presents a formidable challenge, with modern fraud encompassing complex schemes such as synthetic identity fraud and advanced account takeover (ATO) attacks. Synthetic identity fraud involves the creation and cultivation of entirely fictitious identities to defraud lenders, while ATO attacks leverage credential stuffing and social engineering tactics. AI technologies, including machine learning and deep learning, are increasingly being adopted to combat these threats.
- According to recent studies, The market is projected to reach a value of over USD60 billion by 2027, growing at a compound annual growth rate of more than 25%. These technologies enable real-time fraud detection and prevention, improving accuracy and reducing false positives.
What are the market trends shaping the AI In Fraud Management Industry?
- In the realm of technology, the dual-use dilemma and the implementation of proactive defense utilizing generative AI represent the emerging market trend.
- The market is undergoing a significant transformation, with generative artificial intelligence (AI) emerging as a dual-use technology. Malicious actors are harnessing this advanced technology to create sophisticated and scalable fraud attacks. These threats can manifest as hyper-realistic phishing emails, deepfake audio and video for social engineering and identity impersonation, and automated vulnerability discovery. Traditional security measures struggle to keep pace, necessitating more sophisticated, adaptive countermeasures. In response, companies are investing in defensive AI applications. These solutions employ generative AI to detect and respond to evolving threats, providing a critical layer of protection in the face of increasingly sophisticated fraud attempts.
- The integration of AI in fraud management is a game-changer, with applications spanning various sectors, including finance, healthcare, and retail. According to recent estimates, The market is projected to reach a value of over USD50 billion by 2026, growing at a substantial rate. This underscores the growing importance of AI in mitigating fraud and safeguarding businesses.
What challenges does the AI In Fraud Management Industry face during its growth?
- The integration of data quality, privacy, and accessibility considerations is a significant challenge that can hinder industry growth. Ensuring the accurate, secure, and accessible handling of data is essential for businesses to thrive in today's data-driven economy.
- The integration of artificial intelligence (AI) in fraud management has gained significant traction in recent years, as businesses strive to enhance their fraud detection capabilities. AI's ability to analyze vast amounts of data and identify patterns that humans may miss makes it an invaluable tool in this domain. However, the effective implementation of AI in fraud management faces a formidable challenge. The quality, volume, and relevance of data are crucial factors that determine the success of AI models in this application. The scarcity and imbalance of fraud data pose a primary challenge. Legitimate transactions typically outnumber fraudulent ones, leading to highly imbalanced datasets.
- This issue makes it difficult for machine learning models to accurately learn the subtle characteristics of fraud without becoming biased towards classifying most transactions as legitimate. According to recent studies, imbalanced datasets can lead to a decrease in model performance by up to 30%. To mitigate this challenge, businesses are exploring various strategies, such as data augmentation techniques and the use of synthetic data, to create more balanced datasets for their AI models. By addressing these data-related challenges, organizations can optimize the performance of their AI models in fraud management, ultimately improving their ability to detect and prevent fraudulent activities.
Exclusive Technavio Analysis on Customer Landscape
The ai in fraud management market forecasting report includes the adoption lifecycle of the market, covering from the innovator's stage to the laggard's stage. It focuses on adoption rates in different regions based on penetration. Furthermore, the ai in fraud management market report also includes key purchase criteria and drivers of price sensitivity to help companies evaluate and develop their market growth analysis strategies.
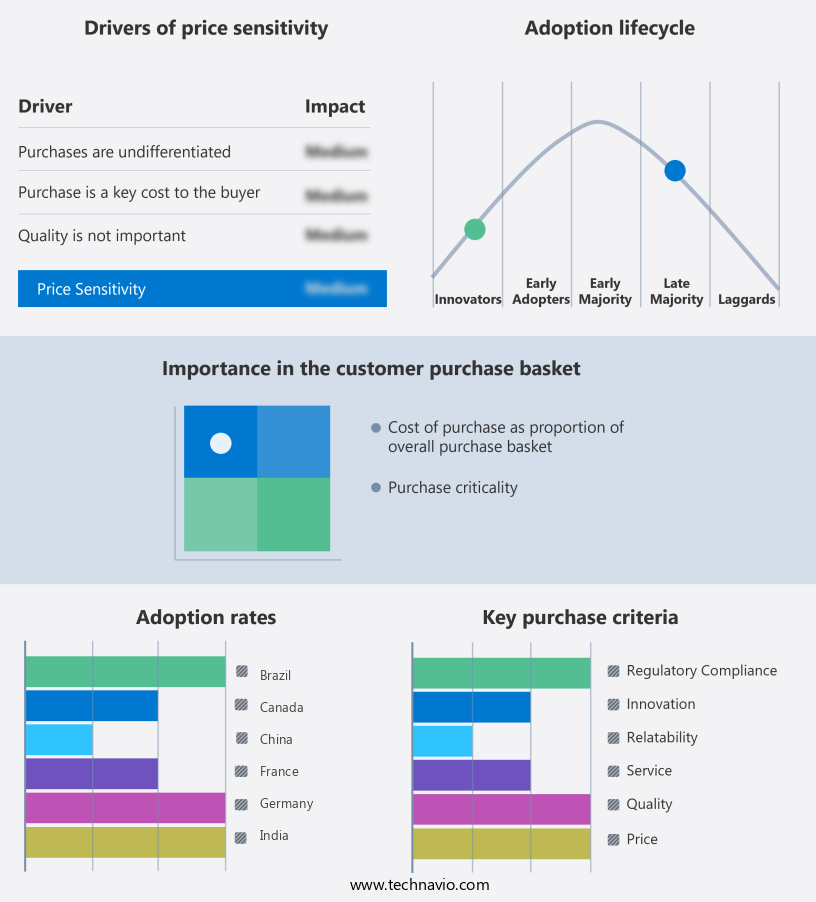
Customer Landscape of AI In Fraud Management Industry
Competitive Landscape
Companies are implementing various strategies, such as strategic alliances, ai in fraud management market forecast, partnerships, mergers and acquisitions, geographical expansion, and product/service launches, to enhance their presence in the industry.
ACE Software Solutions Inc. - This company specializes in artificial intelligence (AI) solutions for fraud management in the financial services sector. Their offerings include an AI-ready compliance platform, which utilizes machine learning (ML) for fraud prevention, anti-money laundering (AML), and know-your-customer (KYC) processes. This technology enables real-time decision-making, enhancing overall risk management capabilities.
The industry research and growth report includes detailed analyses of the competitive landscape of the market and information about key companies, including:
- ACE Software Solutions Inc.
- ACTICO GmbH
- BAE Systems Plc
- Capgemini Service SAS
- CLARA Analytics Inc.
- Cognizant Technology Solutions Corp.
- DataVisor Inc.
- Hewlett Packard Enterprise Co.
- International Business Machines Corp.
- JuicyScore
- Mangopay
- Matellio Inc.
- MaxMind Inc.
- NICE Actimize Ltd.
- Riskified Ltd.
- S.W.I.F.T. SC
- SAS Institute Inc.
- Splunk Inc.
- SUBEX Ltd.
- Temenos AG
Qualitative and quantitative analysis of companies has been conducted to help clients understand the wider business environment as well as the strengths and weaknesses of key industry players. Data is qualitatively analyzed to categorize companies as pure play, category-focused, industry-focused, and diversified; it is quantitatively analyzed to categorize companies as dominant, leading, strong, tentative, and weak.
Recent Development and News in AI In Fraud Management Market
- In January 2024, IBM announced the launch of its new AI-powered fraud detection solution, Watson Fraud, designed to help financial institutions and insurers prevent fraudulent activities in real-time (IBM Press Release).
- In March 2024, Mastercard and Feedzai, an AI company specializing in fraud prevention, announced a strategic partnership to enhance Mastercard's fraud management capabilities using Feedzai's AI technology (Mastercard Newsroom).
- In April 2024, SAS, a leading analytics software company, raised USD1.3 billion in a funding round to expand its AI and machine learning offerings, including its fraud management solutions (Bloomberg).
- In May 2025, Visa announced its entry into the European Union market with its Visa Advanced Authorization solution, an AI-driven fraud prevention tool, following regulatory approval from the European Central Bank (Visa Press Release). These developments underscore the growing importance of AI in fraud management, with major companies investing heavily in new solutions, strategic partnerships, and market expansions to meet the evolving needs of businesses and financial institutions.
Dive into Technavio's robust research methodology, blending expert interviews, extensive data synthesis, and validated models for unparalleled AI In Fraud Management Market insights. See full methodology.
|
Market Scope |
|
|
Report Coverage |
Details |
|
Page number |
241 |
|
Base year |
2024 |
|
Historic period |
2019-2023 |
|
Forecast period |
2025-2029 |
|
Growth momentum & CAGR |
Accelerate at a CAGR of 20.4% |
|
Market growth 2025-2029 |
USD 13547.9 million |
|
Market structure |
Fragmented |
|
YoY growth 2024-2025(%) |
18.2 |
|
Key countries |
US, China, UK, India, Canada, Germany, Japan, South Korea, Brazil, and France |
|
Competitive landscape |
Leading Companies, Market Positioning of Companies, Competitive Strategies, and Industry Risks |
Research Analyst Overview
- The market continues to evolve, with security audits and risk management strategies increasingly relying on advanced technologies such as machine learning models and cybersecurity measures to combat fraudulent activities. Fraud investigation tools, powered by AI, are revolutionizing identity verification methods and case management systems, enabling faster and more accurate detection of anomalies. Vulnerability management and privacy regulations are driving the adoption of threat intelligence platforms and behavioral biometrics analysis to enhance fraud pattern recognition. Penetration testing and suspicious activity reporting are essential components of regulatory reporting, with AI-powered risk assessment and real-time fraud scoring playing a pivotal role in decision-making processes.
- Decision support systems and access control mechanisms are being augmented with AI-powered risk assessment and audit trails, ensuring a more proactive approach to fraud detection. Predictive modeling techniques and authentication protocols are also gaining traction, as loss prevention measures and network analysis methods become more sophisticated. According to recent industry reports, the global fraud management market is expected to grow by over 15% annually, as businesses across sectors recognize the importance of investing in robust fraud detection algorithms and transaction monitoring systems. Rule-based systems and incident response planning are being complemented with data sanitization and data loss prevention, as organizations prioritize data governance policies and compliance regulations.
What are the Key Data Covered in this AI In Fraud Management Market Research and Growth Report?
-
What is the expected growth of the AI In Fraud Management Market between 2025 and 2029?
-
USD 13.55 billion, at a CAGR of 20.4%
-
-
What segmentation does the market report cover?
-
The report is segmented by Solution (Software and Services), Application (Identity theft protection, Payment fraud prevention, Anti-money laundering, and Others), Sector (BFSI, Retail and consumer packaged goods, Healthcare, Government, and Others), and Geography (North America, APAC, Europe, Middle East and Africa, and South America)
-
-
Which regions are analyzed in the report?
-
North America, APAC, Europe, Middle East and Africa, and South America
-
-
What are the key growth drivers and market challenges?
-
Escalating sophistication and volume of fraudulent activities, Data quality, privacy, and accessibility constraints
-
-
Who are the major players in the AI In Fraud Management Market?
-
ACE Software Solutions Inc., ACTICO GmbH, BAE Systems Plc, Capgemini Service SAS, CLARA Analytics Inc., Cognizant Technology Solutions Corp., DataVisor Inc., Hewlett Packard Enterprise Co., International Business Machines Corp., JuicyScore, Mangopay, Matellio Inc., MaxMind Inc., NICE Actimize Ltd., Riskified Ltd., S.W.I.F.T. SC, SAS Institute Inc., Splunk Inc., SUBEX Ltd., and Temenos AG
-
Market Research Insights
- The market for AI in fraud management continues to advance, with increasing adoption of advanced technologies such as time series analysis, random forests, dimensionality reduction, decision trees, support vector machines, and various machine learning algorithms. One study reveals that the use of AI in fraud detection has led to a significant reduction in false negatives by up to 30%, improving overall accuracy and minimizing financial losses for businesses. Furthermore, industry analysts anticipate that the market will expand by over 20% annually in the coming years, reflecting the growing demand for more sophisticated fraud prevention solutions.
- For instance, pattern recognition algorithms and model interpretability have emerged as critical components in mitigating fraud risks, enabling organizations to make informed decisions and respond effectively to emerging threats.
We can help! Our analysts can customize this ai in fraud management market research report to meet your requirements.
 RIA -
RIA - 
