
AI In Life Science Analytics Market Size 2025-2029
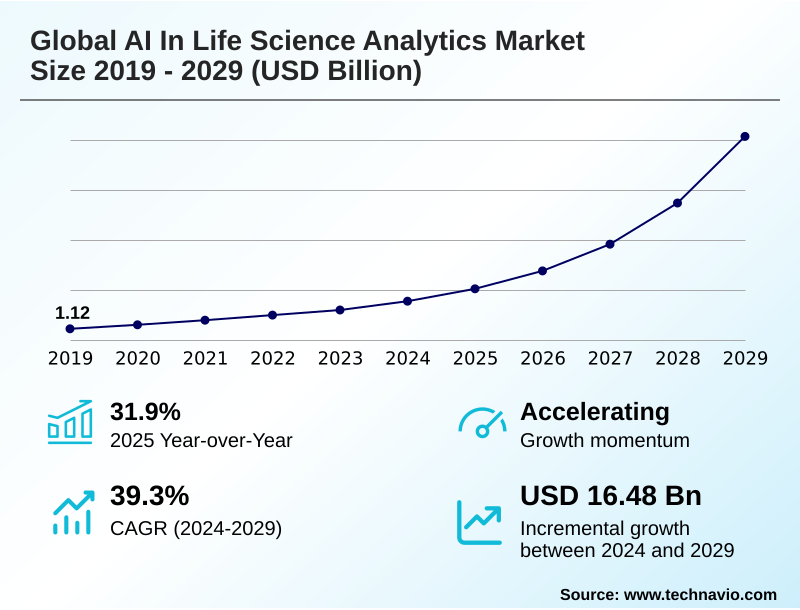
The ai in life science analytics market size is valued to increase by USD 16.48 billion, at a CAGR of 39.3% from 2024 to 2029. Imperative for enhanced operational efficiency and predictive maintenance will drive the ai in life science analytics market.
Major Market Trends & Insights
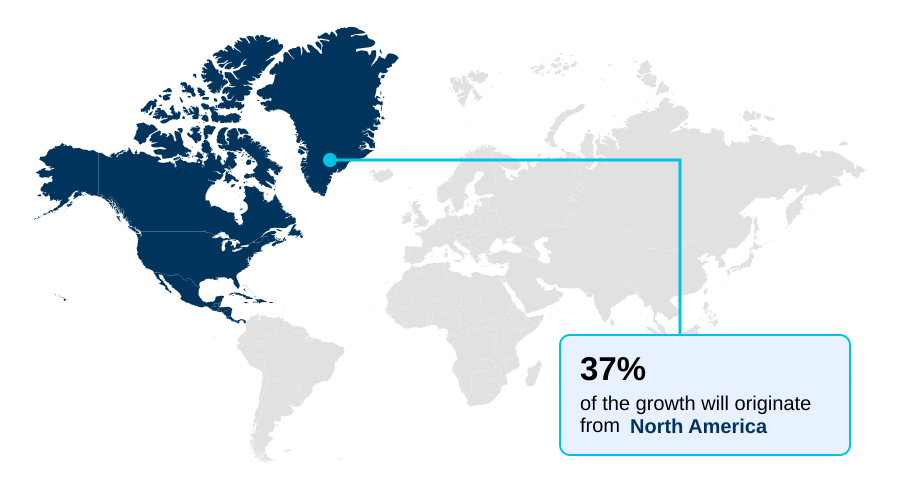
- North America dominated the market and accounted for a 37.3% growth during the forecast period.
- By Component - Solution segment was valued at in 2023
- By Deployment - Cloud-based segment accounted for the largest market revenue share in 2023
Market Size & Forecast
- Market Opportunities: USD 19.24 billion
- Market Future Opportunities: USD 16.48 billion
- CAGR from 2024 to 2029 : 39.3%
Market Summary
- The AI in life science analytics market is defined by the application of advanced computational methods to solve complex biological and healthcare challenges. A primary driver is the intense pressure on pharmaceutical firms to improve research and development efficiency, where AI-powered platforms accelerate drug discovery and optimize clinical trials.
- This is exemplified in scenarios where machine learning models analyze vast genomic datasets and real-world data to identify highly specific patient cohorts for rare disease trials, a task that was previously unfeasible. Key trends include the rise of generative AI for novel molecule design and the increasing use of natural language processing to extract insights from unstructured clinical notes.
- However, the market grapples with significant challenges related to data governance and the need for robust bioinformatics frameworks to ensure data integrity and patient privacy. The successful integration of these technologies is shifting the industry toward a more predictive, efficient, and personalized approach to medicine, fundamentally altering the discovery and development lifecycle.
What will be the Size of the AI In Life Science Analytics Market during the forecast period?
Get Key Insights on Market Forecast (PDF) Request Free Sample
How is the AI In Life Science Analytics Market Segmented?
The ai in life science analytics industry research report provides comprehensive data (region-wise segment analysis), with forecasts and estimates in "USD million" for the period 2025-2029, as well as historical data from 2019-2023 for the following segments.
- Component
- Software
- Services
- Deployment
- Cloud-based
- On-premises
- End-user
- Pharmaceutical
- Healthcare
- Biotechnology
- Others
- Geography
- North America
- US
- Canada
- Mexico
- Europe
- Germany
- UK
- France
- APAC
- China
- Japan
- India
- South America
- Brazil
- Argentina
- Colombia
- Middle East and Africa
- Saudi Arabia
- UAE
- South Africa
- Rest of World (ROW)
- North America
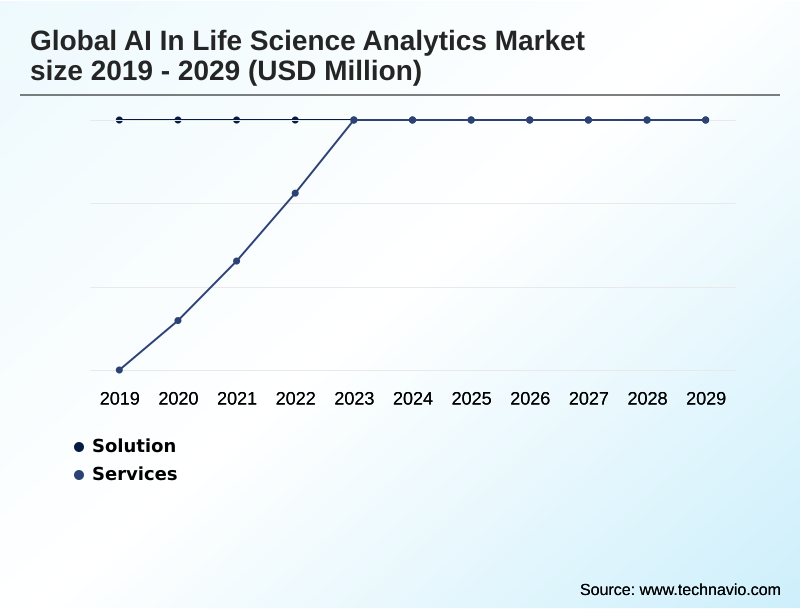
By Component Insights
The software segment is estimated to witness significant growth during the forecast period.
The software segment is central to the AI in life science analytics market, encompassing platforms that utilize machine learning and generative AI to transform the drug development lifecycle.
These solutions are enabling smart laboratories through robotic process automation and advanced AI-powered imaging analysis. Key applications include in silico drug design and sophisticated AI platforms for life sciences, which enhance AI for R&D productivity.
By leveraging cloud computing for AI healthcare, these tools facilitate AI-driven laboratory automation, with some organizations reporting a reduction in preclinical screening times by up to 40%.
This evolution underscores a strategic shift toward highly efficient, data-centric research models, establishing software as the core engine of innovation and operational excellence in the sector.
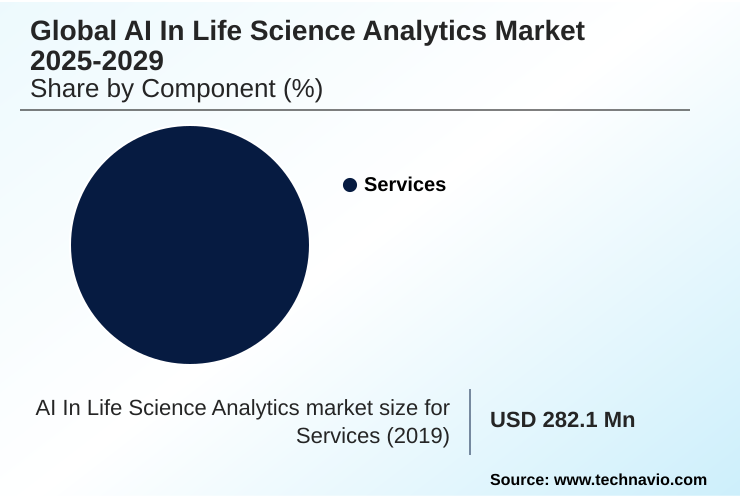
The Software segment was valued at in 2023 and showed a gradual increase during the forecast period.
Regional Analysis
North America is estimated to contribute 37.3% to the growth of the global market during the forecast period.Technavio’s analysts have elaborately explained the regional trends and drivers that shape the market during the forecast period.
See How AI In Life Science Analytics Market Demand is Rising in North America Request Free Sample
The geographic landscape of the AI in life science analytics market is led by North America, which is projected to account for 37.3% of the market's incremental growth, driven by its concentration of pharmaceutical leaders and technology innovators.
Meanwhile, APAC is the fastest-growing region, fueled by large-scale government initiatives and a vast patient population ideal for clinical trials. The effective use of electronic health records (EHR) and decentralized clinical trials is becoming a key differentiator across these regions.
Effective data governance and data interoperability remain critical challenges globally, influencing the success of AI-based patient recruitment and broader drug discovery efforts.
Strategic approaches to AI in clinical trial optimization and real-world evidence analytics are essential for navigating diverse regulatory pathways for AI software and adhering to regional AI governance in healthcare standards.
Market Dynamics
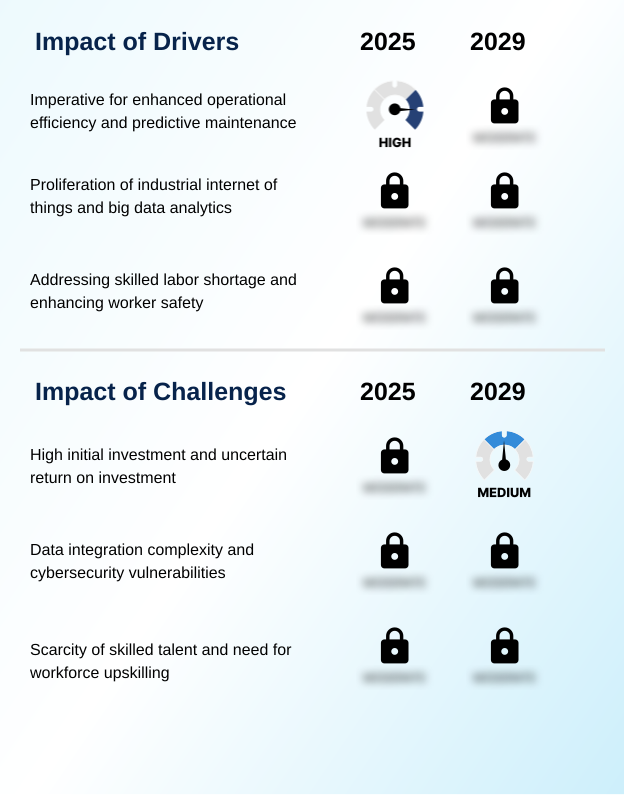
Our researchers analyzed the data with 2024 as the base year, along with the key drivers, trends, and challenges. A holistic analysis of drivers will help companies refine their marketing strategies to gain a competitive advantage.
- The strategic implementation of AI in life sciences is maturing beyond foundational analytics toward highly specialized applications that deliver significant competitive advantages. Organizations are increasingly using AI to accelerate drug discovery, where advanced platforms now process complex datasets in hours, a task that previously took weeks.
- This evolution includes sophisticated AI applications in patient stratification and the use of generative AI for novel molecule design, which are reshaping research and development paradigms. AI in rare disease diagnosis support is another critical area gaining traction, demonstrating the technology's potential to address unmet medical needs.
- The optimization of processes through machine learning for genomic data analysis and AI-powered pathology image interpretation is becoming standard practice. Furthermore, leveraging real-world data for precision medicine is enabling the development of more effective, targeted therapies. As these technologies become more integrated, mitigating algorithmic bias in healthcare AI is a primary focus to ensure equitable outcomes.
- The overarching goal is using AI to improve R&D productivity across the entire value chain, from initial research to late-stage clinical trials. This is supported by predictive analytics for clinical trial outcomes and the natural language processing of medical literature. To manage data privacy, federated learning for patient data privacy is being adopted, alongside AI-driven tools for companion diagnostics.
- The successful integration of these systems, including AI models for multiomics data integration and the role of AI in digital therapeutics, is crucial. This is particularly evident in deep learning for early cancer detection and the automation of R&D workflows with AI, supported by cloud-based AI platforms for biotech that facilitate AI for real-world evidence generation.
What are the key market drivers leading to the rise in the adoption of AI In Life Science Analytics Industry?
- The imperative for enhanced operational efficiency and the growing adoption of predictive maintenance are key drivers fueling market growth.
- The market is primarily driven by the imperative to accelerate research timelines and improve outcomes through AI for personalized medicine.
- The explosion of data from genomics, proteomics, and multiomics has created a need for advanced predictive analytics and AI-driven biomarker discovery, which can improve the success rate of preclinical candidates by 15%.
- This is particularly impactful in precision oncology, where multi-modal data integration allows for highly targeted treatment strategies.
- AI-driven platforms are analyzing real-world data to generate insights for precision medicine platforms, while AI in bioinformatics analysis is unlocking new understanding of disease pathways.
- The focus on AI in rare disease research is also a significant driver, as computational methods offer new hope for previously untreatable conditions, making AI a critical tool for modern life sciences.
What are the market trends shaping the AI In Life Science Analytics Industry?
- The emergence of generative AI and the deployment of industrial copilots are establishing themselves as a significant upcoming market trend. These technologies are poised to redefine operational workflows and analytical capabilities.
- Key trends are reshaping the AI in life science analytics market, driven by advancements in deep learning and natural language processing. The adoption of in silico screening and high-content screening is accelerating preclinical research, with AI models identifying novel drug targets with over 70% higher accuracy than traditional methods.
- The move toward explainable AI (XAI) is building trust in predictive models for healthcare, particularly in applications like predictive toxicology and drug repurposing. This trend is enhanced by the use of NLP for clinical documentation, which automates the extraction of critical data.
- Furthermore, generative AI for synthetic data is addressing data scarcity issues, enabling more robust model training for applications in machine learning in genomics and deep learning in medical imaging, ultimately improving the precision of AI for target identification.
What challenges does the AI In Life Science Analytics Industry face during its growth?
- The high initial investment required for implementation, coupled with an uncertain return on investment, presents a key challenge affecting industry growth.
- Navigating challenges related to implementation and ethics is a key focus in the AI in life science analytics market. The risk of algorithmic bias requires continuous AI model validation and a commitment to AI ethics in medical research, as biased AI-powered diagnostics can amplify health disparities.
- The persistent talent development for health AI, where demand for professionals skilled in computational biology outstrips supply by a ratio of nearly 3:1, constrains growth. Furthermore, deploying reliable clinical decision support and companion diagnostics is complicated by the need for transparent and trustworthy models.
- The adoption of privacy-preserving techniques like federated learning is critical but adds complexity to AI for drug development. Automating clinical trial reporting and advancing computational drug discovery are also hampered by these talent and ethical considerations, creating significant hurdles to widespread adoption.
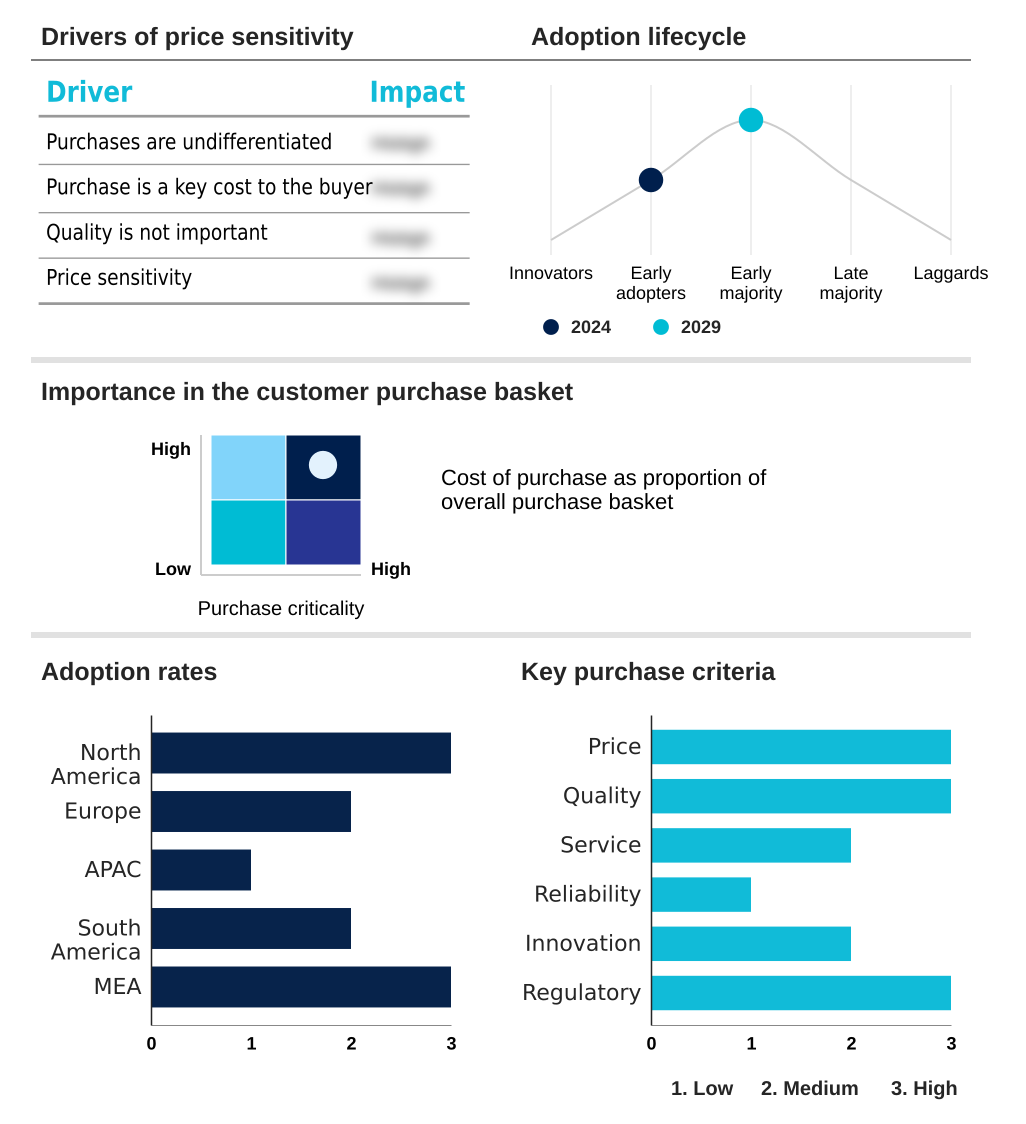
Exclusive Technavio Analysis on Customer Landscape
The ai in life science analytics market forecasting report includes the adoption lifecycle of the market, covering from the innovator’s stage to the laggard’s stage. It focuses on adoption rates in different regions based on penetration. Furthermore, the ai in life science analytics market report also includes key purchase criteria and drivers of price sensitivity to help companies evaluate and develop their market growth analysis strategies.
Customer Landscape of AI In Life Science Analytics Industry
Competitive Landscape
Companies are implementing various strategies, such as strategic alliances, ai in life science analytics market forecast, partnerships, mergers and acquisitions, geographical expansion, and product/service launches, to enhance their presence in the industry.
Atomwise Inc. - Offers analytics driven by deep learning to precisely predict molecular interactions, accelerating drug discovery pipelines.
The industry research and growth report includes detailed analyses of the competitive landscape of the market and information about key companies, including:
- Atomwise Inc.
- Axtria, Inc.
- BenevolentAI
- Biofourmis Inc.
- Clarify Health Solutions Inc.
- ConcertAI Inc.
- CureMetrix Inc.
- Databricks Inc.
- Deep Genomics Inc.
- Exscientia PLC
- Flatiron Health
- IBM Corp.
- Iktos
- IQVIA Holdings Inc.
- Lexalytics Inc.
- PathAI Inc.
- SAS Institute Inc.
- Sorcero Inc.
- Tempus Labs Inc.
Qualitative and quantitative analysis of companies has been conducted to help clients understand the wider business environment as well as the strengths and weaknesses of key industry players. Data is qualitatively analyzed to categorize companies as pure play, category-focused, industry-focused, and diversified; it is quantitatively analyzed to categorize companies as dominant, leading, strong, tentative, and weak.
Recent Development and News in Ai in life science analytics market
- In August 2024, Exscientia PLC announced a definitive agreement to merge with Recursion to create an end-to-end, technology-enabled drug discovery platform.
- In September 2024, Tempus Labs Inc. announced a partnership with BioNTech to apply its AI-driven analysis of real-world multimodal data to support the development of personalized cancer therapies.
- In November 2024, Sanofi, in partnership with OpenAI and Formation Bio, announced Muse, an AI-powered software tool designed to accelerate clinical trial recruitment by optimizing strategy.
- In January 2025, NVIDIA announced a partnership with the Mayo Clinic to develop next-generation pathology foundation models using its advanced computing systems, aiming to create a cornerstone for future AI applications.
Dive into Technavio’s robust research methodology, blending expert interviews, extensive data synthesis, and validated models for unparalleled AI In Life Science Analytics Market insights. See full methodology.
| Market Scope | |
|---|---|
| Page number | 294 |
| Base year | 2024 |
| Historic period | 2019-2023 |
| Forecast period | 2025-2029 |
| Growth momentum & CAGR | Accelerate at a CAGR of 39.3% |
| Market growth 2025-2029 | USD 16479.1 million |
| Market structure | Fragmented |
| YoY growth 2024-2025(%) | 31.9% |
| Key countries | US, Canada, Mexico, Germany, UK, France, Italy, The Netherlands, Spain, China, Japan, India, Australia, South Korea, Indonesia, Brazil, Argentina, Colombia, Saudi Arabia, UAE, South Africa, Israel and Turkey |
| Competitive landscape | Leading Companies, Market Positioning of Companies, Competitive Strategies, and Industry Risks |
Research Analyst Overview
- The AI in life science analytics market is fundamentally reshaping research and clinical paradigms through the application of deep learning and generative AI. These technologies are crucial for advancing drug discovery and optimizing clinical trials. The use of natural language processing to mine real-world data from electronic health records (EHR) provides critical insights for biomarker discovery and patient stratification.
- This data-centric approach necessitates robust data governance and data interoperability solutions, compelling board-level decisions on investments in privacy-preserving techniques like federated learning to ensure compliance. Key applications in digital pathology and companion diagnostics are powered by sophisticated predictive analytics. The integration of bioinformatics and computational biology is essential for managing multiomics data and enabling precision oncology.
- Advances in high-content screening, in silico screening, and predictive toxicology are streamlining the drug development lifecycle. The market is also seeing increased use of synthetic control arms and decentralized clinical trials, which improve efficiency and have been shown to reduce trial recruitment timelines by over 30%.
- The focus is on achieving AI model validation and deploying explainable AI (XAI) in clinical decision support systems, smart laboratories, and robotic process automation to drive drug repurposing and innovation.
What are the Key Data Covered in this AI In Life Science Analytics Market Research and Growth Report?
-
What is the expected growth of the AI In Life Science Analytics Market between 2025 and 2029?
-
USD 16.48 billion, at a CAGR of 39.3%
-
-
What segmentation does the market report cover?
-
The report is segmented by Component (Solution, Services), Deployment (Cloud-based, On-premises), End-user (Pharmaceutical, Healthcare, Biotechnology, Others) and Geography (North America, Europe, APAC, South America, Middle East and Africa)
-
-
Which regions are analyzed in the report?
-
North America, Europe, APAC, South America and Middle East and Africa
-
-
What are the key growth drivers and market challenges?
-
Imperative for enhanced operational efficiency and predictive maintenance, High initial investment and uncertain return on investment
-
-
Who are the major players in the AI In Life Science Analytics Market?
-
Atomwise Inc., Axtria, Inc., BenevolentAI, Biofourmis Inc., Clarify Health Solutions Inc., ConcertAI Inc., CureMetrix Inc., Databricks Inc., Deep Genomics Inc., Exscientia PLC, Flatiron Health, IBM Corp., Iktos, IQVIA Holdings Inc., Lexalytics Inc., PathAI Inc., SAS Institute Inc., Sorcero Inc. and Tempus Labs Inc.
-
Market Research Insights
- The dynamics of the AI in life science analytics market are shaped by the pursuit of tangible business outcomes through advanced technology. The deployment of predictive models for healthcare is measurably improving operational results, with some applications enhancing diagnostic accuracy by over 25%.
- Concurrently, AI for personalized medicine leverages deep analysis of real-world evidence analytics to tailor treatments, while AI in clinical trial optimization has been shown to reduce data processing timelines by more than 50%.
- The integration of AI-powered diagnostics and computational drug discovery platforms is creating a highly competitive environment where innovation in AI for target identification directly correlates with market leadership. These advancements are compelling organizations to adopt sophisticated systems to manage and interpret complex datasets effectively.
We can help! Our analysts can customize this ai in life science analytics market research report to meet your requirements.
 RIA -
RIA - 
