
AI In Medical Writing Market Size 2025-2029
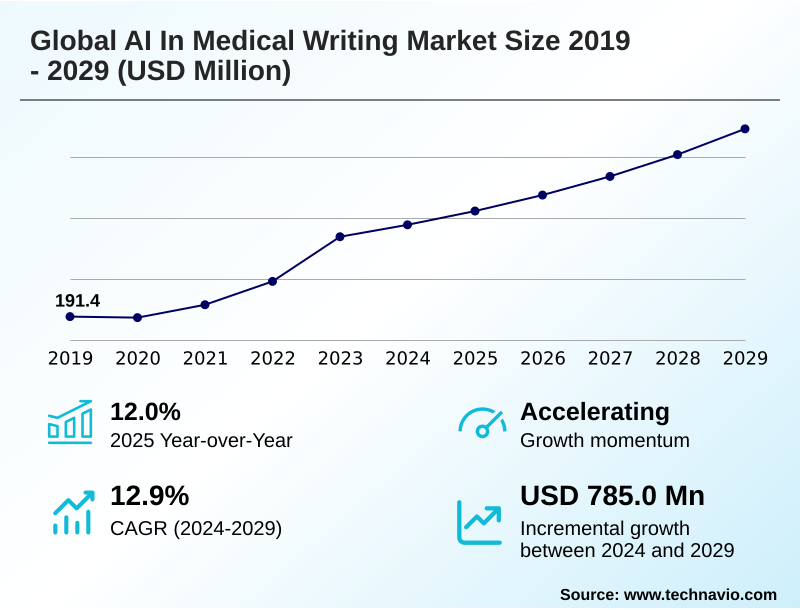
The ai in medical writing market size is valued to increase by USD 785 million, at a CAGR of 12.9% from 2024 to 2029. Escalating volume and complexity of clinical and real-world data will drive the ai in medical writing market.
Major Market Trends & Insights
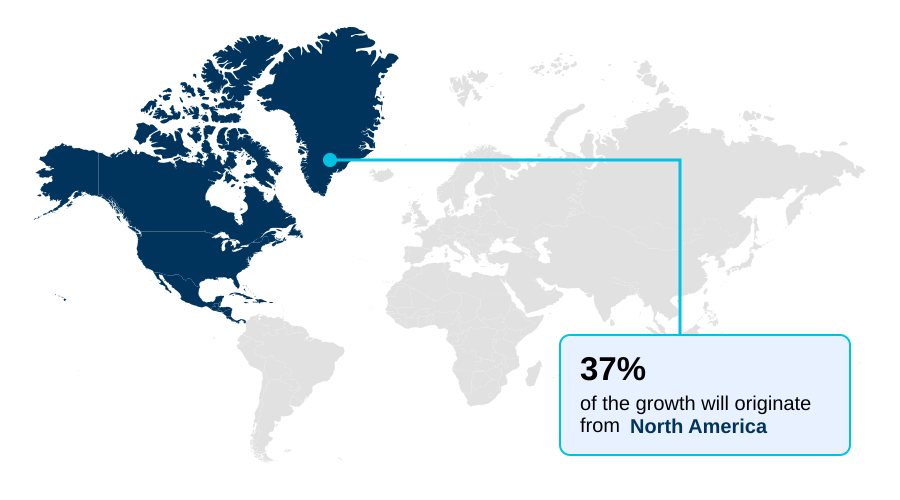
- North America dominated the market and accounted for a 36.6% growth during the forecast period.
- By Application - Regulatory writing segment was valued at USD 290.1 million in 2023
- By Technology - LLMs and generative AI segment accounted for the largest market revenue share in 2023
Market Size & Forecast
- Market Opportunities: USD 1.54 billion
- Market Future Opportunities: USD 785 million
- CAGR from 2024 to 2029 : 12.9%
Market Summary
- The AI in medical writing market is characterized by a strategic shift toward intelligent automation to manage the increasing complexity of life sciences documentation. A core driver is the imperative to shorten drug development timelines and control costs, where traditional manual processes create significant bottlenecks. AI-powered platforms, leveraging natural language generation and structured data extraction, are transforming this landscape.
- For instance, in a typical clinical development scenario, automating the initial draft of patient safety narratives from a clinical database can free up medical writers to focus on higher-value strategic analysis, accelerating a critical path activity. This human-in-the-loop model, where technology handles repetitive tasks and experts provide oversight, is gaining traction.
- The market is also shaped by the trend of integrating AI directly into end-to-end clinical and regulatory software ecosystems. However, the industry grapples with challenges related to data privacy, the need for GxP compliant AI, and ensuring the scientific accuracy of AI-generated content.
- Navigating the evolving regulatory perspective on AI-generated submission documents remains a key factor for sustained market expansion and broad-scale adoption by pharmaceutical and biotechnology companies.
What will be the Size of the AI In Medical Writing Market during the forecast period?
Get Key Insights on Market Forecast (PDF) Request Free Sample
How is the AI In Medical Writing Market Segmented?
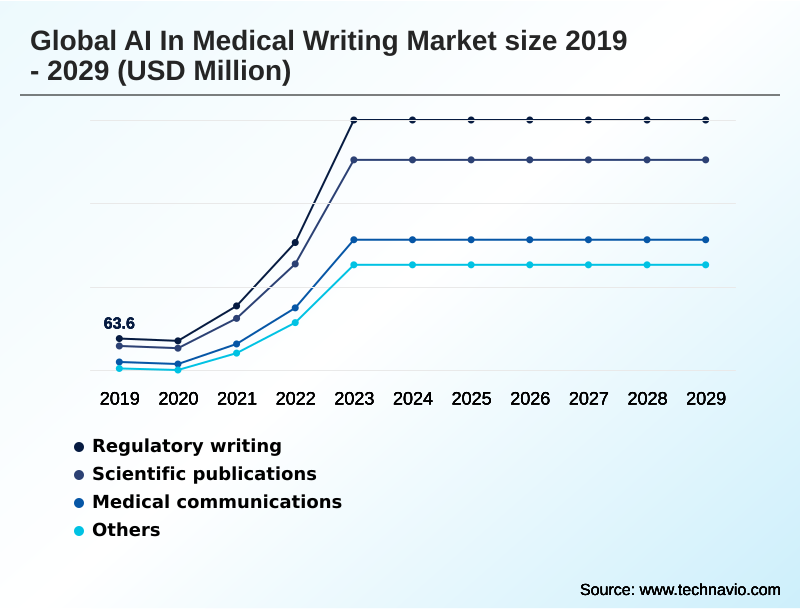
The ai in medical writing industry research report provides comprehensive data (region-wise segment analysis), with forecasts and estimates in "USD million" for the period 2025-2029, as well as historical data from 2019-2023 for the following segments.
- Application
- Regulatory writing
- Scientific publications
- Medical communications
- Others
- Technology
- LLMs and generative AI
- NLP
- Machine learning
- Robotic process automation
- End-user
- Pharmaceutical companies
- Biotechnology companies
- Contract research organizations
- Others
- Geography
- North America
- US
- Canada
- Mexico
- Europe
- Germany
- UK
- France
- APAC
- China
- Japan
- India
- South America
- Brazil
- Argentina
- Colombia
- Middle East and Africa
- Saudi Arabia
- UAE
- Israel
- Rest of World (ROW)
- North America
By Application Insights
The regulatory writing segment is estimated to witness significant growth during the forecast period.
The global ai in medical writing market 2025-2029 is segmented by application, technology, end-user, and geography. In regulatory writing, AI is reshaping the creation of submission-critical documents.
The integration of generative AI in life sciences is pivotal for streamlining the development of the common technical document, a cornerstone of regulatory submissions. AI-powered quality control tools are essential for managing the complexity and scale of these documents.
This automation accelerates the entire process, with some organizations reporting a reduction in manual quality control checks of over 40%. The use of NLP for biomedical literature review further enhances evidence synthesis.
This focus on AI for regulatory affairs is critical for reducing time-to-market with AI, providing a clear competitive advantage in the biopharmaceutical sector.
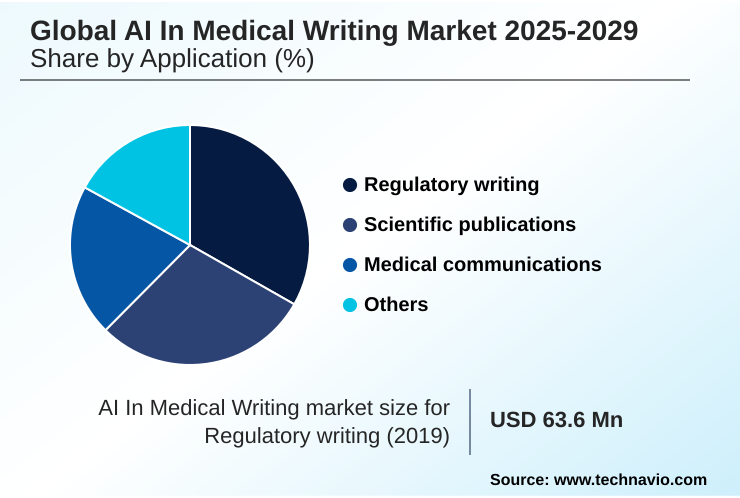
The Regulatory writing segment was valued at USD 290.1 million in 2023 and showed a gradual increase during the forecast period.
Regional Analysis
North America is estimated to contribute 36.6% to the growth of the global market during the forecast period.Technavio’s analysts have elaborately explained the regional trends and drivers that shape the market during the forecast period.
See How AI In Medical Writing Market Demand is Rising in North America Request Free Sample
The geographic landscape of the global ai in medical writing market 2025-2029 is led by North America, which accounts for over 36% of the market share, driven by a high concentration of pharmaceutical R&D and advanced technology infrastructure.
The region's leadership is reinforced by a robust ecosystem of AI innovators and significant venture capital investment. Europe follows, with its market shaped by stringent data privacy regulations like GDPR, which drive demand for secure, compliant AI solutions.
The APAC region is projected to be the fastest-growing, fueled by its expanding role as a clinical trial hub and strong government support for technology adoption.
In this region, CROs are leveraging AI-powered solutions to improve service delivery efficiency by up to 25%. South America and the Middle East and Africa represent smaller, emerging markets with long-term growth potential tied to modernizing healthcare infrastructure.
Market Dynamics
Our researchers analyzed the data with 2024 as the base year, along with the key drivers, trends, and challenges. A holistic analysis of drivers will help companies refine their marketing strategies to gain a competitive advantage.
- The strategic imperative for improving medical writing efficiency is driving significant innovation across the life sciences industry. Organizations are increasingly adopting generative AI for regulatory submissions, moving beyond basic automation to sophisticated content creation. A key application is automating CSRs with generative AI, which can dramatically reduce the time required for drafting complex, data-heavy documents.
- This process is underpinned by AI tools that ensure AI for ICH guideline compliance, a non-negotiable requirement for global filings. The operational impact is substantial, with a focus on reducing document review cycles; initial implementations show that automated quality checks can decrease internal review iterations by over 30% compared to purely manual workflows.
- Furthermore, the technology is expanding into external communications, with AI for medical communication content helping to create consistent and accurate materials for healthcare professionals. A growing area of focus is the use of AI tools for plain language summaries, addressing regulatory demands for greater patient-centricity and transparency in clinical research.
- This holistic approach to document automation, from internal reports to public-facing summaries, represents a fundamental shift in how medical information is managed and disseminated. This integrated strategy is central to achieving both operational excellence and enhanced stakeholder engagement.
What are the key market drivers leading to the rise in the adoption of AI In Medical Writing Industry?
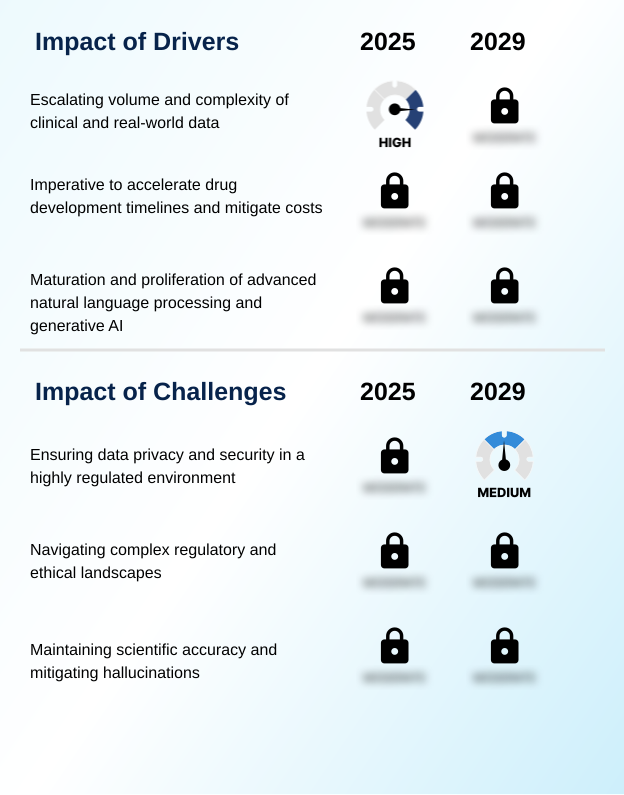
- A key market driver is the escalating volume and complexity of clinical and real-world data generated throughout the drug development lifecycle.
- The primary driver for the global ai in medical writing market 2025-2029 is the imperative to accelerate drug development timelines and mitigate costs. AI-powered platforms automate laborious tasks, allowing organizations to reallocate resources to strategic activities.
- This medical writing workflow optimization can compress documentation timelines by up to 30%. A second major driver is the maturation of advanced AI technologies, particularly natural language generation.
- The capability of modern systems to perform structured data extraction and produce coherent, contextually accurate text has fundamentally changed the value proposition, enabling applications like clinical study report automation.
- The adoption of these tools leads to a more efficient and consistent documentation process across the board.
What are the market trends shaping the AI In Medical Writing Industry?
- The development and adoption of domain-specific large language models represents a significant upcoming market trend. These specialized models are designed to enhance accuracy and compliance within the life sciences industry.
- A predominant trend in the global ai in medical writing market 2025-2029 is the shift toward domain-specific LLMs. These specialized models, fine-tuned on curated biomedical data, offer higher accuracy for tasks like patient safety narrative generation. They demonstrate a 20% lower error rate on average compared to general-purpose models.
- This focus on purpose-built technology is critical for gaining trust in a regulated environment. Another key trend is the integration of AI directly into comprehensive clinical and regulatory platforms, moving away from standalone tools. This creates a seamless workflow, improving data integrity and reducing manual data transfer errors by up to 40%.
- The result is a more holistic approach to clinical data summarization and documentation.
What challenges does the AI In Medical Writing Industry face during its growth?
- Ensuring data privacy and security within a highly regulated environment presents a key challenge that affects industry growth and adoption.
- A formidable challenge for the global ai in medical writing market 2025-2029 is ensuring data privacy and security. Handling sensitive patient data with third-party AI models introduces significant compliance risks, particularly under regulations like GDPR and HIPAA. This concern has led to a 50% increase in demand for on-premise or private cloud solutions.
- Another challenge is navigating the complex and evolving regulatory landscape, as agencies have yet to issue definitive guidance on AI-generated submissions. This uncertainty around AI ethics in pharma and the need for algorithmic transparency complicates AI model validation. Finally, maintaining scientific accuracy and mitigating 'hallucinations' remains a critical operational hurdle, requiring rigorous human oversight.
Exclusive Technavio Analysis on Customer Landscape
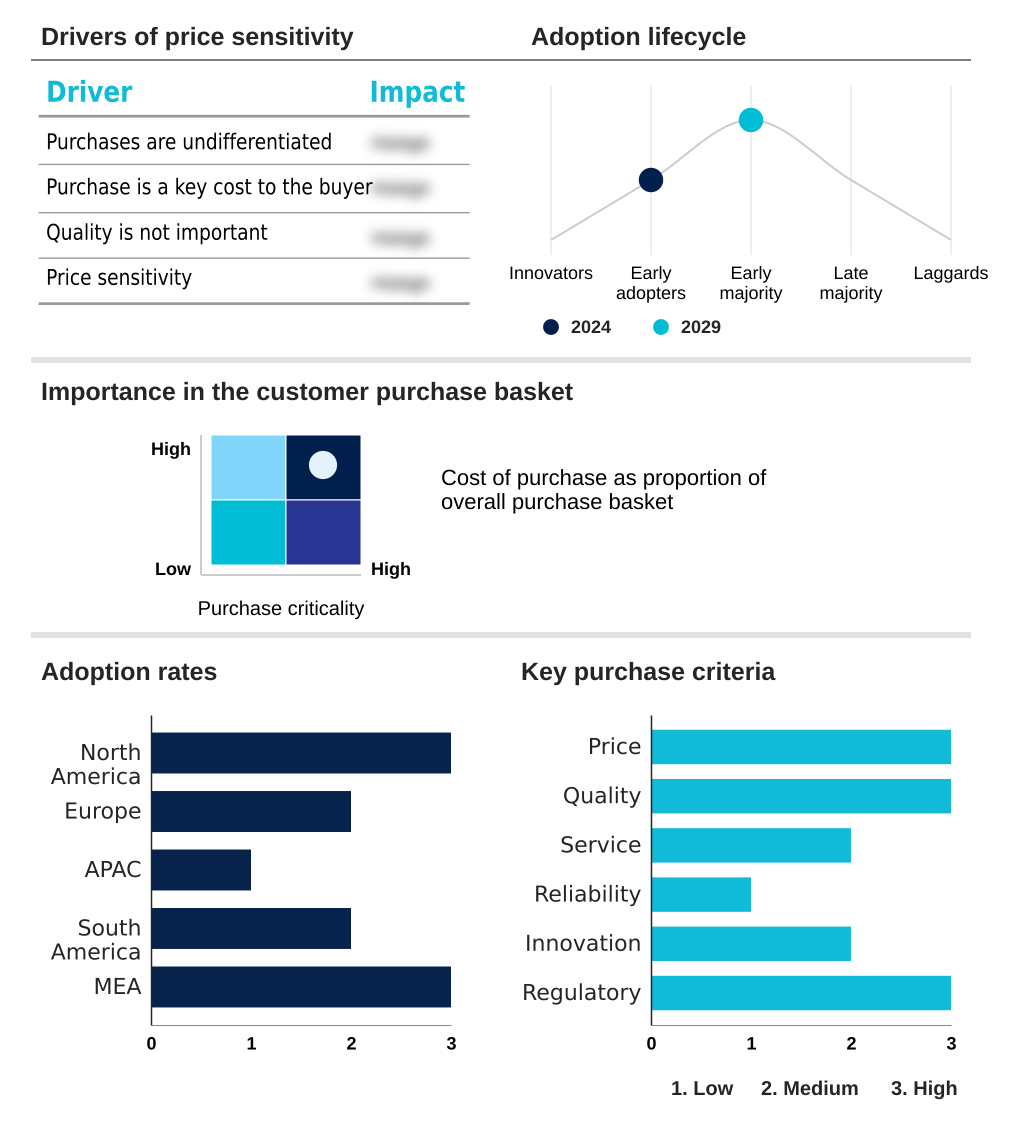
The ai in medical writing market forecasting report includes the adoption lifecycle of the market, covering from the innovator’s stage to the laggard’s stage. It focuses on adoption rates in different regions based on penetration. Furthermore, the ai in medical writing market report also includes key purchase criteria and drivers of price sensitivity to help companies evaluate and develop their market growth analysis strategies.
Customer Landscape of AI In Medical Writing Industry
Competitive Landscape
Companies are implementing various strategies, such as strategic alliances, ai in medical writing market forecast, partnerships, mergers and acquisitions, geographical expansion, and product/service launches, to enhance their presence in the industry.
AINGENS - Key offerings focus on AI-powered automation platforms that generate submission-ready regulatory and clinical documents, streamlining development workflows and ensuring compliance.
The industry research and growth report includes detailed analyses of the competitive landscape of the market and information about key companies, including:
- AINGENS
- Artos
- Cactus Communications Pvt. Ltd.
- Certara Inc.
- CopyAI Inc.
- DeepL SE
- GENINVO
- ICON plc
- Insilico Medicine
- IQVIA Holdings Inc.
- Litmap Ltd.
- OpenAI
- Oracle Corp.
- Parexel International Corp.
- SAS Institute Inc.
- Scite LLC
- Syneos Health
- TrialAssure
- Veeva Systems Inc.
Qualitative and quantitative analysis of companies has been conducted to help clients understand the wider business environment as well as the strengths and weaknesses of key industry players. Data is qualitatively analyzed to categorize companies as pure play, category-focused, industry-focused, and diversified; it is quantitatively analyzed to categorize companies as dominant, leading, strong, tentative, and weak.
Recent Development and News in Ai in medical writing market
- In August, 2024, a leading life sciences software provider announced the acquisition of a specialized AI startup, integrating advanced generative AI capabilities for clinical study report automation into its flagship regulatory information management platform.
- In November, 2024, a major contract research organization entered a strategic partnership with a top-tier technology corporation to co-develop a GxP-compliant, private cloud environment for AI-assisted medical writing, ensuring enhanced data security for its pharmaceutical clients.
- In February, 2025, a prominent AI research company launched a new, domain-specific large language model pre-trained exclusively on biomedical literature and clinical trial data, promising a significant reduction in factual errors for medical writing applications.
- In May, 2025, a consortium of pharmaceutical companies and technology vendors announced a new industry standard for the validation of AI models used in the generation of regulatory submission documents, aiming to create a clear framework for agency acceptance.
Dive into Technavio’s robust research methodology, blending expert interviews, extensive data synthesis, and validated models for unparalleled AI In Medical Writing Market insights. See full methodology.
| Market Scope | |
|---|---|
| Page number | 306 |
| Base year | 2024 |
| Historic period | 2019-2023 |
| Forecast period | 2025-2029 |
| Growth momentum & CAGR | Accelerate at a CAGR of 12.9% |
| Market growth 2025-2029 | USD 785.0 million |
| Market structure | Fragmented |
| YoY growth 2024-2025(%) | 12.0% |
| Key countries | US, Canada, Mexico, Germany, UK, France, Italy, Spain, The Netherlands, China, Japan, India, South Korea, Australia, Indonesia, Brazil, Argentina, Colombia, Saudi Arabia, UAE, Israel, South Africa and Turkey |
| Competitive landscape | Leading Companies, Market Positioning of Companies, Competitive Strategies, and Industry Risks |
Research Analyst Overview
- The global ai in medical writing market 2025-2029 is defined by the application of advanced algorithms to streamline the creation of complex scientific and regulatory content. Key technologies include natural language generation and domain-specific LLMs, which are becoming integral to pharmacovigilance automation and the generation of the common technical document.
- The primary objective is clinical study report automation, which addresses a significant bottleneck in drug development. For instance, firms implementing AI-powered quality control have demonstrated a capacity to reduce documentation errors by over 35%, a critical factor influencing boardroom decisions on technology investment and compliance strategy.
- The market is increasingly focused on GxP compliant AI and ensuring algorithmic transparency to meet stringent regulatory standards. Structured data extraction from disparate sources enables the automated creation of patient safety narratives, a task traditionally requiring extensive manual effort. The use of retrieval-augmented generation is a key technical trend aimed at improving factual accuracy.
- Ultimately, successful adoption hinges on robust AI model validation to ensure reliability and build trust among stakeholders.
What are the Key Data Covered in this AI In Medical Writing Market Research and Growth Report?
-
What is the expected growth of the AI In Medical Writing Market between 2025 and 2029?
-
USD 785 million, at a CAGR of 12.9%
-
-
What segmentation does the market report cover?
-
The report is segmented by Application (Regulatory writing, Scientific publications, Medical communications, Others), Technology (LLMs and generative AI, NLP, Machine learning, Robotic process automation), End-user (Pharmaceutical companies, Biotechnology companies, Contract research organizations, Others) and Geography (North America, Europe, APAC, South America, Middle East and Africa)
-
-
Which regions are analyzed in the report?
-
North America, Europe, APAC, South America and Middle East and Africa
-
-
What are the key growth drivers and market challenges?
-
Escalating volume and complexity of clinical and real-world data, Ensuring data privacy and security in a highly regulated environment
-
-
Who are the major players in the AI In Medical Writing Market?
-
AINGENS, Artos, Cactus Communications Pvt. Ltd., Certara Inc., CopyAI Inc., DeepL SE, GENINVO, ICON plc, Insilico Medicine, IQVIA Holdings Inc., Litmap Ltd., OpenAI, Oracle Corp., Parexel International Corp., SAS Institute Inc., Scite LLC, Syneos Health, TrialAssure and Veeva Systems Inc.
-
Market Research Insights
- The dynamics of the global ai in medical writing market 2025-2029 are shaped by the strategic integration of sophisticated AI models to enhance operational efficiency. Automating clinical documentation is a primary focus, with platforms demonstrating the ability to reduce document drafting times by more than 50% in certain use cases.
- This medical writing workflow optimization is critical for life sciences organizations aiming to accelerate development timelines. Adoption rates are highest where AI-assisted authoring tools provide a clear return on investment, such as in high-volume, template-driven tasks. For instance, companies leveraging these systems report a 30% improvement in consistency across large submission dossiers, directly impacting quality and reducing regulatory queries.
- This data-driven approach to content creation is becoming a standard practice.
We can help! Our analysts can customize this ai in medical writing market research report to meet your requirements.
 RIA -
RIA - 
