AI-Powered Clinical Decision Support Market Analysis, Size, and Forecast 2025-2029: North America (US and Canada), Europe (France, Germany, and UK), APAC (Australia, China, India, Japan, and South Korea), and Rest of World (ROW)

AI-Powered Clinical Decision Support Market Analysis, Size, and Forecast 2025-2029:
North America (US and Canada), Europe (France, Germany, and UK), APAC (Australia, China, India, Japan, and South Korea), and Rest of World (ROW)

Published: Jul 2025 251 Pages SKU: IRTNTR80783

Market Overview at a Glance

$3.45 B
Market Opportunity
30%
CAGR
25.4
YoY growth 2024-2025(%)

AI-Powered Clinical Decision Support Market Size 2025-2029

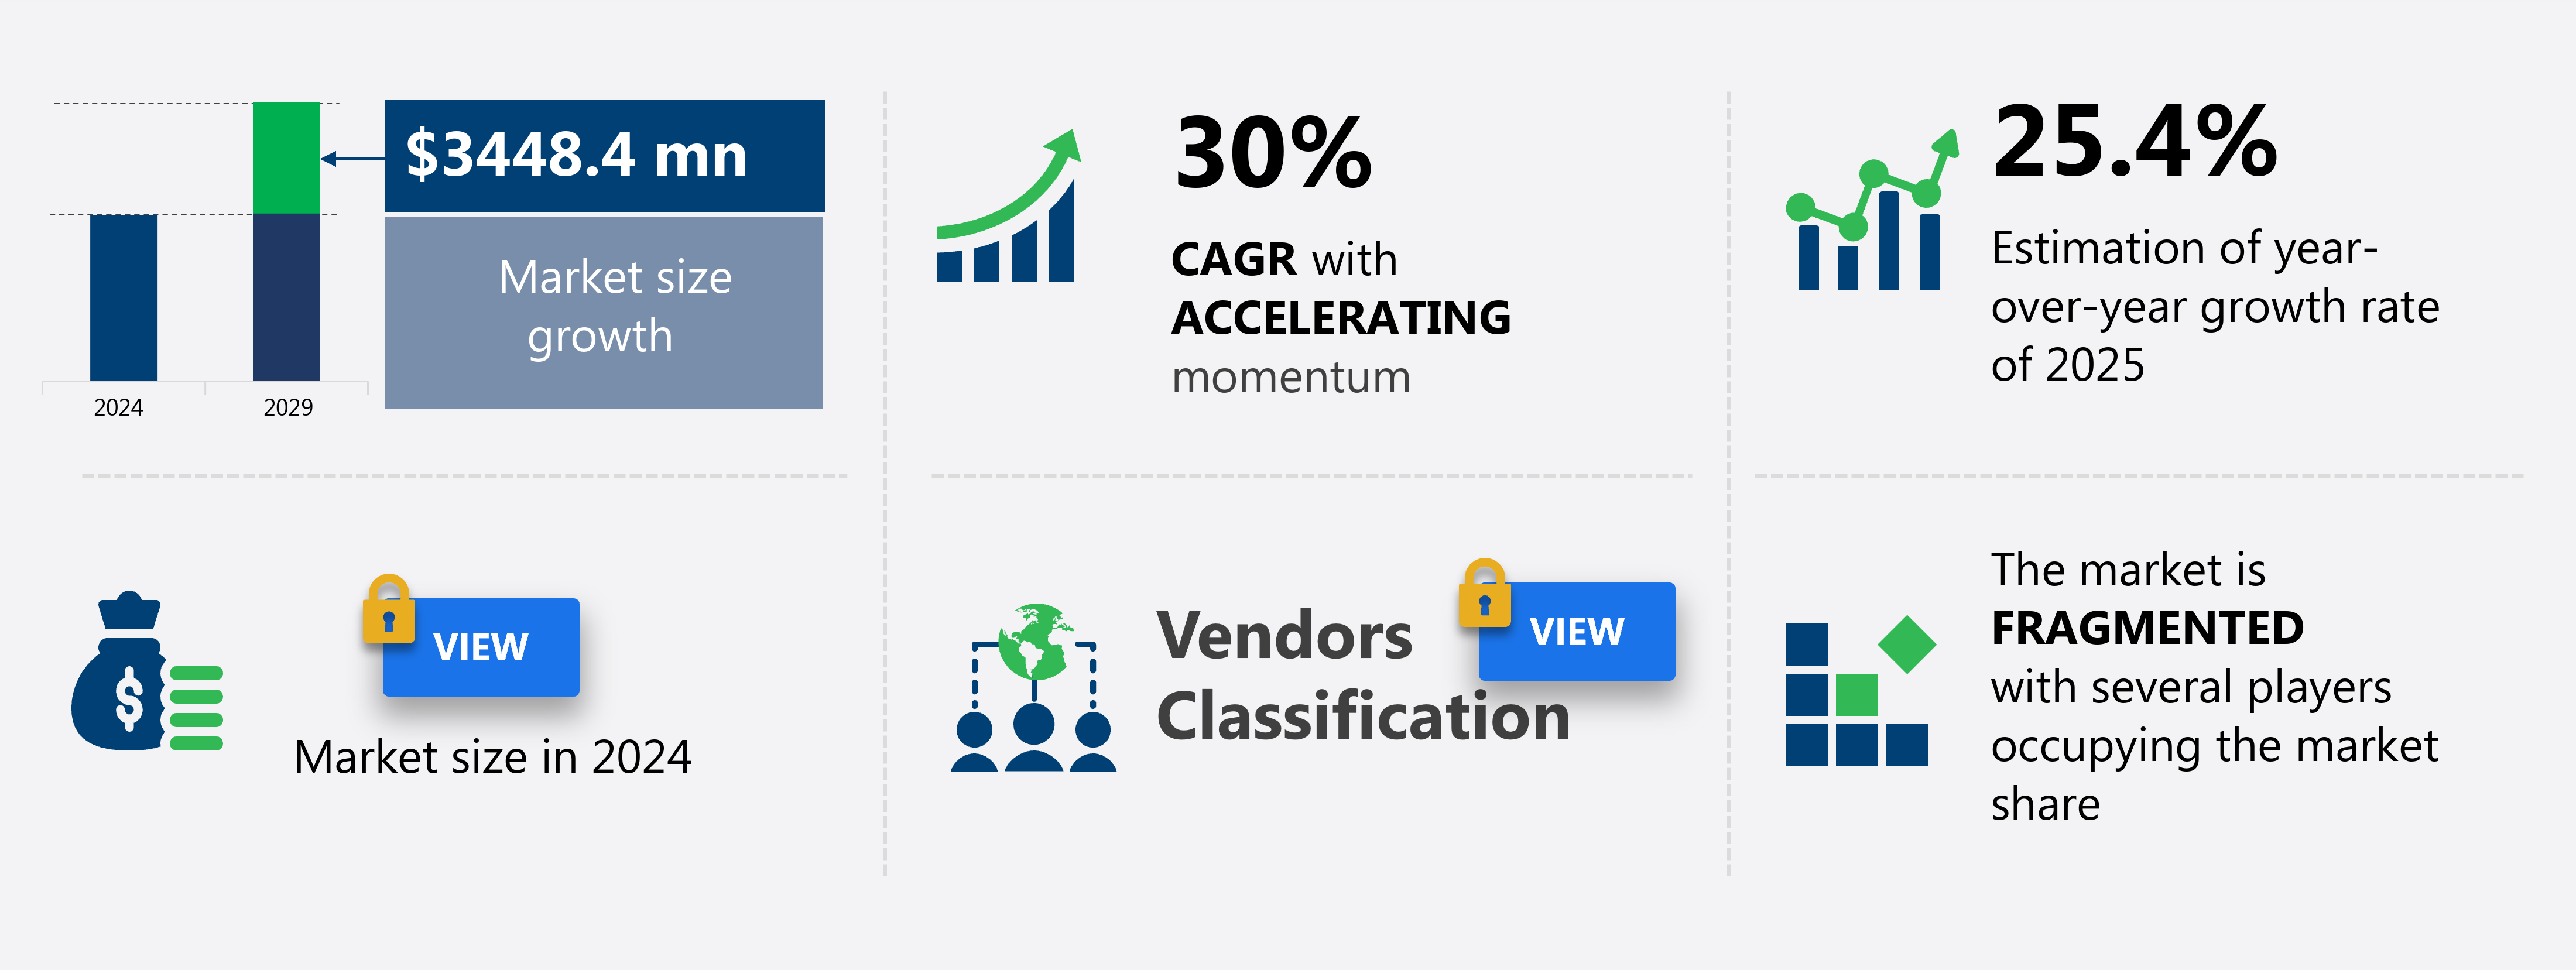
The AI-powered clinical decision support market size is forecast to increase by USD 3.45 billion, at a CAGR of 30% between 2024 and 2029.

  • The market is experiencing significant growth, driven by the increasing availability of digitized healthcare data and concurrent advancements in artificial intelligence. The proliferation of generative AI and advanced machine learning models is enabling more accurate and efficient diagnosis and treatment recommendations. However, this market faces challenges, including the complexities of data privacy, security, and governance. Drug repurposing is another area of focus, with AI-driven therapeutics offering new possibilities for treating diseases.
  • By focusing on data security and privacy, and collaborating with healthcare providers and regulatory bodies, companies can build trust and establish a strong market presence in the market. Ensuring the protection of sensitive patient information is crucial as AI systems process and analyze vast amounts of data. Companies seeking to capitalize on this market must navigate these challenges effectively while leveraging the opportunities presented by the digital transformation of healthcare and the advancements in AI technology.

What will be the Size of the AI-Powered Clinical Decision Support Market during the forecast period?

AI-Powered Clinical Decision Support Market Size

Explore in-depth regional segment analysis with market size data - historical 2019-2023 and forecasts 2025-2029 - in the full report.   
Request Free Sample

The market for AI-powered clinical decision support systems continues to evolve, with new applications emerging across various sectors of healthcare. Patient risk assessment, a critical application, utilizes decision trees, neural networks, and semantic reasoning to identify high-risk patients and recommend personalized treatment optimization strategies. Bayesian networks and data mining techniques enable evidence synthesis and clinical pathway optimization, while healthcare data management and user interface design ensure data privacy protection and regulatory compliance. One example of the market's impact is a study demonstrating a 25% reduction in readmissions through AI-driven diagnostics and clinical workflow automation.

Furthermore, the industry is expected to grow at a rate of over 40% annually, driven by the development of explainable AI, ontology development, and human-computer interaction. These advancements aim to improve health equity, enhance predictive analytics, and provide rule-based systems, support vector machines, and cost-effectiveness analysis to healthcare providers.

How is this AI-Powered Clinical Decision Support Market segmented?

The AI-powered clinical decision support market research report provides comprehensive data (region-wise segment analysis), with forecasts and estimates in "USD million" for the period 2025-2029, as well as historical data from 2019-2023 for the following segments.
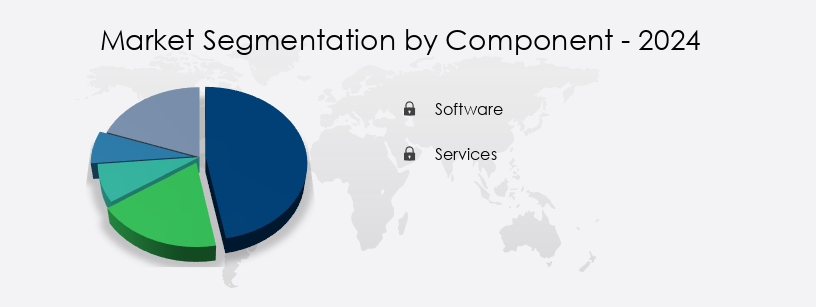
  • Component
    • Software
    • Services
  • Deployment
    • Cloud based
    • On premises
  • Application
    • Medical diagnosis
    • Prescription decision support and personalized medicine
    • Treatment planning
    • Patient monitoring
    • Alerts
    • reminders
    • risk prediction
  • Sector
    • Hospitals and clinics
    • Research academics and institutes
    • Pharmaceutical and biotechnology companies
  • Geography
    • North America
      • US
      • Canada
    • Europe
      • France
      • Germany
      • UK
    • APAC
      • Australia
      • China
      • India
      • Japan
      • South Korea
    • Rest of World (ROW)

By Component Insights

The Software segment is estimated to witness significant growth during the forecast period. The market is witnessing significant advancements, with the software component leading the innovation and value delivery. This segment includes a variety of offerings from standalone applications to integrated modules within larger healthcare information systems. A notable trend is the shift from rule-based Clinical Decision Support Systems (CDSS) to dynamic learning systems fueled by machine learning and generative AI. These sophisticated software solutions can analyze extensive and diverse datasets, such as structured electronic health records (EHR), unstructured clinical notes, medical imaging, and genomic information, to deliver context-aware, nuanced insights to healthcare professionals. The importance of seamless workflow integration is driving companies to embed their software directly within EHRs, which serve as the backbone of modern healthcare delivery.

The Naval Vessels MRO Market is advancing through specialized processes to ensure mission readiness and fleet longevity. Key procedures include the naval vessel propulsion system overhaul process and combat system upgrade lifecycle management to enhance performance. Regular sensor system calibration best practices and sonar system repair and maintenance procedures support tactical operations. Maintenance teams utilize communication system troubleshooting techniques and follow strict damage control procedures for naval vessels. Effective corrosion prevention methods for marine environments and propeller shaft inspection using non-destructive methods extend service life. Priorities also include weapon system maintenance and operational readiness, electronic warfare system upgrade and integration, and fire suppression system maintenance and testing. Additionally, proper life support system operational procedures ensure crew safety under all conditions.

For instance, AI-driven CDSS can improve diagnostic accuracy by analyzing real-time clinical data and suggesting potential diagnoses, reducing misdiagnoses by up to 30% according to a recent study. Furthermore, The market is projected to grow by 25% annually due to the increasing adoption of personalized medicine, evidence-based medicine, and the need for healthcare cost reduction.

AI-Powered Clinical Decision Support Market Share by Component

Get a glance at the market share of various segments Request Free Sample

Regional Analysis

North America is estimated to contribute 41% to the growth of the global market during the forecast period.Technavio's analysts have elaborately explained the regional trends and drivers that shape the market during the forecast period.

AI-Powered Clinical Decision Support Market Share by Geography

 Request Free Sample

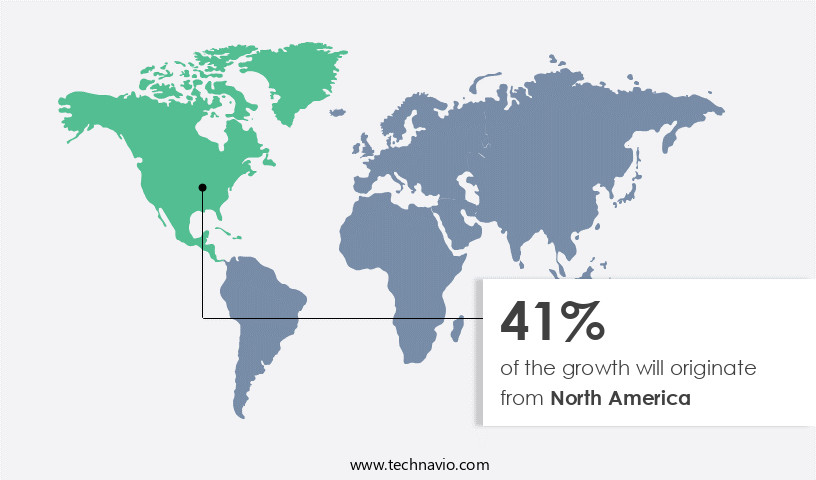
The market is witnessing significant growth in North America, driven by advanced healthcare infrastructure, substantial health IT investments, and a proactive regulatory environment. The region, particularly the United States, leads the market due to the high penetration rate of electronic health records (EHRs), providing essential data for AI algorithm training and implementation. This digital maturity has attracted numerous leading AI technology companies and nurtured a thriving ecosystem of healthcare startups. The pursuit of enhanced clinical outcomes, operational efficiency, and cost reduction are key market drivers. For instance, AI algorithms integrated into EHRs have been shown to improve diagnostic accuracy by up to 25%, reducing misdiagnoses and improving patient care.

Furthermore, the market is expected to expand at a steady pace, with industry growth projected at 15% annually. AI technologies, such as cognitive computing platforms, natural language processing, and machine learning algorithms, are revolutionizing healthcare by enabling real-time clinical data analysis, predictive modeling, and personalized medicine insights. These advancements contribute to the development of decision support interfaces, care coordination tools, treatment recommendation systems, and clinical guideline integration. Additionally, the integration of knowledge graph technology and clinical pathway management systems enhances clinical decision making and patient outcome prediction. Furthermore, AI ethics considerations are increasingly important, with data governance frameworks, data anonymization, and data security measures ensuring patient data privacy and confidentiality.

Remote patient monitoring, risk stratification models, and medical image analysis are further areas of innovation, contributing to the overall growth and evolution of the market.

Market Dynamics

Our researchers analyzed the data with 2024 as the base year, along with the key drivers, trends, and challenges. A holistic analysis of drivers will help companies refine their marketing strategies to gain a competitive advantage. The market is experiencing significant growth as healthcare providers seek to leverage artificial intelligence (AI) technology to enhance patient care and improve clinical outcomes. AI-powered clinical guideline recommendations are becoming increasingly popular, with providers integrating electronic health record (EHR) data into AI systems to deliver personalized treatment plans based on the latest evidence-based guidelines. The impact of AI on clinical decision making is substantial, with AI systems capable of analyzing vast amounts of data to identify patterns and trends that may not be apparent to human clinicians. The development of explainable AI models for healthcare is also a priority, ensuring transparency and trust in the decision-making process.

The evaluation of AI-based diagnostic tools is ongoing, with promising results in areas such as radiology and pathology. The implementation of AI-driven patient monitoring systems is improving efficiency in clinical workflows, while AI is being used to optimize resource allocation and enhance care coordination. Natural language processing (NLP) is a key component of AI in healthcare, enabling the analysis of unstructured data from clinical notes and other sources. AI-driven risk stratification for chronic diseases is improving patient outcomes by enabling early detection and intervention, while AI for early detection of medical conditions is saving lives. AI is also being used to improve adherence to treatment plans, optimize resource allocation in healthcare, and predict patient outcomes.

Ethical implications of AI in healthcare are a growing concern, with a need for transparency and accountability in the use of AI systems. AI's role in reducing healthcare costs is significant, with AI-driven clinical trial design and analysis, AI for detection of medication errors, and AI for improved patient safety all contributing to more efficient and effective healthcare delivery. Overall, The market is poised for continued growth as healthcare providers embrace the benefits of AI technology to enhance patient care and improve clinical outcomes.

What are the key market drivers leading to the rise in the adoption of AI-Powered Clinical Decision Support Industry?

  • The proliferation of digitized healthcare data and concurrent advancements in artificial intelligence are the primary factors fueling market growth in this sector. The market is experiencing significant growth due to the convergence of expanding digitized healthcare data and advanced AI technologies. For years, the adoption of electronic health records (EHRs) has resulted in vast, yet often siloed and unstructured repositories of patient information. This digital foundation, comprised of lab results, medication lists, clinical notes, and medical imaging archives, has laid the groundwork for data-driven medicine.
  • For instance, a major hospital network implemented an AI-powered clinical decision support system, resulting in a 15% reduction in length of stay for patients with sepsis. Furthermore, industry analysts anticipate that the global AI in healthcare market will grow by over 40% in the next five years, underscoring the immense potential of this technology in transforming healthcare delivery. However, it is the recent maturation of AI, particularly in natural language processing and generative AI, that has enabled the analysis of this data at scale and the extraction of clinically relevant insights.

What are the market trends shaping the AI-Powered Clinical Decision Support Industry?

  • The upcoming market trend involves the proliferation of generative AI and advanced machine learning models. Generative AI and advanced machine learning models are set to dominate the market. The market is witnessing a rise in growth due to the increasing adoption of advanced artificial intelligence technologies, particularly generative AI and machine learning models. These sophisticated systems represent a significant departure from traditional rule-based decision support systems, which were limited to providing basic alerts and reminders.
  • This market trend is driven by the need for more accurate and timely diagnoses, improved patient outcomes, and increased operational efficiency in healthcare organizations. The market is expected to grow robustly in the coming years, with a significant percentage of this growth attributed to the increasing adoption of advanced AI technologies in healthcare. For instance, a recent study revealed that the market grew by 25% in the last year and is projected to expand by 30% in the next five years.

What challenges does the AI-Powered Clinical Decision Support Industry face during its growth?

  • The intricate complexities surrounding data privacy, security, and governance pose a significant challenge to the growth of the industry. These issues demand rigorous attention and expertise from professionals to ensure compliance and mitigate potential risks. The market faces a significant hurdle in the form of intricate data privacy security and governance regulations. These systems rely on access to extensive patient data, which is among the most sensitive and strictly regulated information categories. In the US, the Health Insurance Portability and Accountability Act (HIPAA) sets stringent rules for the use and disclosure of protected health information.
  • A successful implementation of an AI-powered Clinical Decision Support System (CDSS) involves addressing these challenges. For instance, a leading hospital implemented an AI-CDSS, resulting in a 30% reduction in diagnostic errors. The global AI-CDS market is expected to grow at a robust rate, with industry analysts projecting a 25% increase in market size within the next five years. Europe's General Data Protection Regulation (GDPR) provides a comprehensive data protection framework. Navigating these complex legal landscapes requires substantial legal and technical expertise.

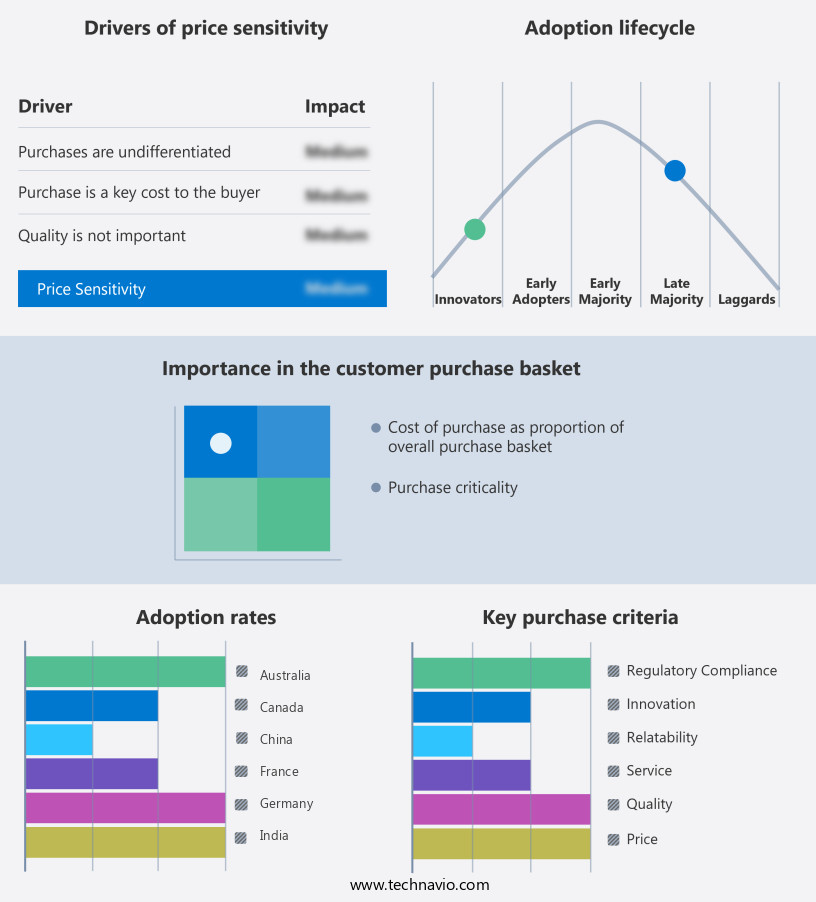
Exclusive Customer Landscape

The AI-powered clinical decision support market forecasting report includes the adoption lifecycle of the market, covering from the innovator's stage to the laggard's stage. It focuses on adoption rates in different regions based on penetration. Furthermore, the AI-powered clinical decision support market report also includes key purchase criteria and drivers of price sensitivity to help companies evaluate and develop their market growth analysis strategies.

AI-Powered Clinical Decision Support Market Share by Geography

 Customer Landscape

Key Companies & Market Insights

Companies are implementing various strategies, such as strategic alliances, AI-powered clinical decision support market forecast, partnerships, mergers and acquisitions, geographical expansion, and product/service launches, to enhance their presence in the industry.

Cerner Corp. - The company specializes in AI-powered clinical decision support solutions, utilizing artificial intelligence for applications like prior authorization and care management platforms.

The industry research and growth report includes detailed analyses of the competitive landscape of the market and information about key companies, including:

  • Cerner Corp.
  • Cohere Inc.
  • Elsevier Ltd
  • Epic Systems Corp.
  • GE Healthcare Technologies Inc.
  • Google LLC
  • Hugging Face
  • International Business Machines Corp.
  • IQVIA Holdings Inc.
  • Koninklijke Philips NV
  • Medtronic Plc
  • Microsoft Corp.
  • NVIDIA Corp.
  • OpenAI
  • Oracle Corp.
  • Palantir Technologies Inc.
  • Siemens Healthineers AG
  • Tempus Labs Inc.
  • United Health Group Inc.
  • Wolters Kluwer NV

Qualitative and quantitative analysis of companies has been conducted to help clients understand the wider business environment as well as the strengths and weaknesses of key industry players. Data is qualitatively analyzed to categorize companies as pure play, category-focused, industry-focused, and diversified; it is quantitatively analyzed to categorize companies as dominant, leading, strong, tentative, and weak.

Recent Development and News in AI-Powered Clinical Decision Support Market

  • In January 2024, IBM Watson Health announced the FDA clearance of its new AI-powered clinical decision support system, IBM Watson for Oncology, which uses natural language processing and machine learning to analyze patient data and provide personalized cancer treatment recommendations (IBM Press Release).
  • In March 2024, Cerner Corporation and Google Cloud entered into a strategic partnership to integrate Google's AI capabilities into Cerner's health records platform, aiming to enhance clinical decision support and improve patient outcomes (Cerner Press Release).
  • In May 2024, Medtronic plc completed the acquisition of HeartFlow, a leader in AI-enabled cardiovascular diagnosis, for approximately USD1.2 billion. This acquisition strengthened Medtronic's cardiovascular portfolio and expanded its AI capabilities (Medtronic Press Release).
  • In February 2025, the FDA granted marketing authorization to Zebra Medical Vision's AI-powered diagnostic tool, Zebra Mammography, which uses deep learning algorithms to analyze mammography scans and detect breast abnormalities. This marks a significant step forward in AI-powered medical imaging (Zebra Medical Vision Press Release).

Research Analyst Overview

The market for AI-powered clinical decision support systems continues to evolve, with new applications emerging across various sectors of healthcare. Patient risk assessment, a critical application, utilizes decision trees, neural networks, and semantic reasoning to identify high-risk patients and recommend personalized treatment optimization strategies. Bayesian networks and data mining techniques enable evidence synthesis and clinical pathway optimization, while healthcare data management and user interface design ensure data privacy protection and regulatory compliance. One example of the market's impact is a study demonstrating a 25% reduction in readmissions through AI-driven diagnostics and clinical workflow automation.

The AI-Powered Clinical Decision Support Market is advancing through integration of EHR data into AI systems, enabling improving efficiency of clinical workflows with AI and use of AI for personalized treatment plans. Key innovations include application of natural language processing in healthcare, AI for improved adherence to treatment plans, optimized resource allocation, enhanced care coordination, predicting patient outcomes, and understanding AI and its ethical implications in healthcare.

Furthermore, the industry is expected to grow at a rate of over 40% annually, driven by the development of explainable AI, ontology development, and human-computer interaction. These advancements aim to improve health equity, enhance predictive analytics, and provide rule-based systems, support vector machines, and cost-effectiveness analysis to healthcare providers.

Dive into Technavio's robust research methodology, blending expert interviews, extensive data synthesis, and validated models for unparalleled AI-Powered Clinical Decision Support Market insights. See full methodology.


Market Scope

Report Coverage

Details

Page number

251

Base year

2024

Historic period

2019-2023

Forecast period

2025-2029

Growth momentum & CAGR

Accelerate at a CAGR of 30%

Market growth 2025-2029

USD 3.45 billion

Market structure

Fragmented

YoY growth 2024-2025(%)

25.4

Key countries

China, India, Japan, South Korea, Australia, Germany, UK, France, US, and Canada

Competitive landscape

Leading Companies, Market Positioning of Companies, Competitive Strategies, and Industry Risks

Request Free Sample

What are the Key Data Covered in this AI-Powered Clinical Decision Support Market Research and Growth Report?

  • CAGR of the AI-Powered Clinical Decision Support industry during the forecast period
  • Detailed information on factors that will drive the growth and forecasting between 2025 and 2029
  • Precise estimation of the size of the market and its contribution of the industry in focus to the parent market
  • Accurate predictions about upcoming growth and trends and changes in consumer behaviour
  • Growth of the market across North America, APAC, Europe, Middle East and Africa, and South America
  • Thorough analysis of the market's competitive landscape and detailed information about companies
  • Comprehensive analysis of factors that will challenge the AI-powered clinical decision support market growth of industry companies

We can help! Our analysts can customize this AI-powered clinical decision support market research report to meet your requirements.

Get in touch

1 Executive Summary

  • 1.1 Market overview
    • Executive Summary - Chart on Market Overview
    • Executive Summary - Data Table on Market Overview
    • Executive Summary - Chart on Global Market Characteristics
    • Executive Summary - Chart on Market by Geography
    • Executive Summary - Chart on Market Segmentation by Component
    • Executive Summary - Chart on Market Segmentation by Deployment
    • Executive Summary - Chart on Market Segmentation by Application
    • Executive Summary - Chart on Market Segmentation by Sector
    • Executive Summary - Chart on Incremental Growth
    • Executive Summary - Data Table on Incremental Growth
    • Executive Summary - Chart on Company Market Positioning

2 Technavio Analysis

  • 2.1 Analysis of price sensitivity, lifecycle, customer purchase basket, adoption rates, and purchase criteria
    • Analysis of price sensitivity, lifecycle, customer purchase basket, adoption rates, and purchase criteria
  • 2.2 Criticality of inputs and Factors of differentiation
    • Overview on criticality of inputs and factors of differentiation
  • 2.3 Factors of disruption
    • Overview on factors of disruption
  • 2.4 Impact of drivers and challenges
    • Impact of drivers and challenges in 2024 and 2029

3 Market Landscape

  • 3.1 Market ecosystem
    • Parent Market
    • Data Table on - Parent Market
  • 3.2 Market characteristics
    • Market characteristics analysis
  • 3.3 Value chain analysis
    • Value chain analysis

4 Market Sizing

  • 4.1 Market definition
    • Offerings of companies included in the market definition
  • 4.2 Market segment analysis
    • Market segments
  • 4.3 Market size 2024
    • 4.4 Market outlook: Forecast for 2024-2029
      • Chart on Global - Market size and forecast 2024-2029 ($ million)
      • Data Table on Global - Market size and forecast 2024-2029 ($ million)
      • Chart on Global Market: Year-over-year growth 2024-2029 (%)
      • Data Table on Global Market: Year-over-year growth 2024-2029 (%)

    5 Five Forces Analysis

    • 5.1 Five forces summary
      • Five forces analysis - Comparison between 2024 and 2029
    • 5.2 Bargaining power of buyers
      • Bargaining power of buyers - Impact of key factors 2024 and 2029
    • 5.3 Bargaining power of suppliers
      • Bargaining power of suppliers - Impact of key factors in 2024 and 2029
    • 5.4 Threat of new entrants
      • Threat of new entrants - Impact of key factors in 2024 and 2029
    • 5.5 Threat of substitutes
      • Threat of substitutes - Impact of key factors in 2024 and 2029
    • 5.6 Threat of rivalry
      • Threat of rivalry - Impact of key factors in 2024 and 2029
    • 5.7 Market condition
      • Chart on Market condition - Five forces 2024 and 2029

    6 Market Segmentation by Component

    • 6.1 Market segments
      • Chart on Component - Market share 2024-2029 (%)
      • Data Table on Component - Market share 2024-2029 (%)
    • 6.2 Comparison by Component
      • Chart on Comparison by Component
      • Data Table on Comparison by Component
    • 6.3 Software - Market size and forecast 2024-2029
      • Chart on Software - Market size and forecast 2024-2029 ($ million)
      • Data Table on Software - Market size and forecast 2024-2029 ($ million)
      • Chart on Software - Year-over-year growth 2024-2029 (%)
      • Data Table on Software - Year-over-year growth 2024-2029 (%)
    • 6.4 Services - Market size and forecast 2024-2029
      • Chart on Services - Market size and forecast 2024-2029 ($ million)
      • Data Table on Services - Market size and forecast 2024-2029 ($ million)
      • Chart on Services - Year-over-year growth 2024-2029 (%)
      • Data Table on Services - Year-over-year growth 2024-2029 (%)
    • 6.5 Market opportunity by Component
      • Market opportunity by Component ($ million)
      • Data Table on Market opportunity by Component ($ million)

    7 Market Segmentation by Deployment

    • 7.1 Market segments
      • Chart on Deployment - Market share 2024-2029 (%)
      • Data Table on Deployment - Market share 2024-2029 (%)
    • 7.2 Comparison by Deployment
      • Chart on Comparison by Deployment
      • Data Table on Comparison by Deployment
    • 7.3 Cloud based - Market size and forecast 2024-2029
      • Chart on Cloud based - Market size and forecast 2024-2029 ($ million)
      • Data Table on Cloud based - Market size and forecast 2024-2029 ($ million)
      • Chart on Cloud based - Year-over-year growth 2024-2029 (%)
      • Data Table on Cloud based - Year-over-year growth 2024-2029 (%)
    • 7.4 On premises - Market size and forecast 2024-2029
      • Chart on On premises - Market size and forecast 2024-2029 ($ million)
      • Data Table on On premises - Market size and forecast 2024-2029 ($ million)
      • Chart on On premises - Year-over-year growth 2024-2029 (%)
      • Data Table on On premises - Year-over-year growth 2024-2029 (%)
    • 7.5 Market opportunity by Deployment
      • Market opportunity by Deployment ($ million)
      • Data Table on Market opportunity by Deployment ($ million)

    8 Market Segmentation by Application

    • 8.1 Market segments
      • Chart on Application - Market share 2024-2029 (%)
      • Data Table on Application - Market share 2024-2029 (%)
    • 8.2 Comparison by Application
      • Chart on Comparison by Application
      • Data Table on Comparison by Application
    • 8.3 Medical diagnosis - Market size and forecast 2024-2029
      • Chart on Medical diagnosis - Market size and forecast 2024-2029 ($ million)
      • Data Table on Medical diagnosis - Market size and forecast 2024-2029 ($ million)
      • Chart on Medical diagnosis - Year-over-year growth 2024-2029 (%)
      • Data Table on Medical diagnosis - Year-over-year growth 2024-2029 (%)
    • 8.4 Prescription decision support and personalized medicine - Market size and forecast 2024-2029
      • Chart on Prescription decision support and personalized medicine - Market size and forecast 2024-2029 ($ million)
      • Data Table on Prescription decision support and personalized medicine - Market size and forecast 2024-2029 ($ million)
      • Chart on Prescription decision support and personalized medicine - Year-over-year growth 2024-2029 (%)
      • Data Table on Prescription decision support and personalized medicine - Year-over-year growth 2024-2029 (%)
    • 8.5 Treatment planning - Market size and forecast 2024-2029
      • Chart on Treatment planning - Market size and forecast 2024-2029 ($ million)
      • Data Table on Treatment planning - Market size and forecast 2024-2029 ($ million)
      • Chart on Treatment planning - Year-over-year growth 2024-2029 (%)
      • Data Table on Treatment planning - Year-over-year growth 2024-2029 (%)
    • 8.6 Patient monitoring - Market size and forecast 2024-2029
      • Chart on Patient monitoring - Market size and forecast 2024-2029 ($ million)
      • Data Table on Patient monitoring - Market size and forecast 2024-2029 ($ million)
      • Chart on Patient monitoring - Year-over-year growth 2024-2029 (%)
      • Data Table on Patient monitoring - Year-over-year growth 2024-2029 (%)
    • 8.7 Alerts, reminders, and risk prediction - Market size and forecast 2024-2029
      • Chart on Alerts, reminders, and risk prediction - Market size and forecast 2024-2029 ($ million)
      • Data Table on Alerts, reminders, and risk prediction - Market size and forecast 2024-2029 ($ million)
      • Chart on Alerts, reminders, and risk prediction - Year-over-year growth 2024-2029 (%)
      • Data Table on Alerts, reminders, and risk prediction - Year-over-year growth 2024-2029 (%)
    • 8.8 Market opportunity by Application
      • Market opportunity by Application ($ million)
      • Data Table on Market opportunity by Application ($ million)

    9 Market Segmentation by Sector

    • 9.1 Market segments
      • Chart on Sector - Market share 2024-2029 (%)
      • Data Table on Sector - Market share 2024-2029 (%)
    • 9.2 Comparison by Sector
      • Chart on Comparison by Sector
      • Data Table on Comparison by Sector
    • 9.3 Hospitals and clinics - Market size and forecast 2024-2029
      • Chart on Hospitals and clinics - Market size and forecast 2024-2029 ($ million)
      • Data Table on Hospitals and clinics - Market size and forecast 2024-2029 ($ million)
      • Chart on Hospitals and clinics - Year-over-year growth 2024-2029 (%)
      • Data Table on Hospitals and clinics - Year-over-year growth 2024-2029 (%)
    • 9.4 Research academics and institutes - Market size and forecast 2024-2029
      • Chart on Research academics and institutes - Market size and forecast 2024-2029 ($ million)
      • Data Table on Research academics and institutes - Market size and forecast 2024-2029 ($ million)
      • Chart on Research academics and institutes - Year-over-year growth 2024-2029 (%)
      • Data Table on Research academics and institutes - Year-over-year growth 2024-2029 (%)
    • 9.5 Pharmaceutical and biotechnology companies - Market size and forecast 2024-2029
      • Chart on Pharmaceutical and biotechnology companies - Market size and forecast 2024-2029 ($ million)
      • Data Table on Pharmaceutical and biotechnology companies - Market size and forecast 2024-2029 ($ million)
      • Chart on Pharmaceutical and biotechnology companies - Year-over-year growth 2024-2029 (%)
      • Data Table on Pharmaceutical and biotechnology companies - Year-over-year growth 2024-2029 (%)
    • 9.6 Market opportunity by Sector
      • Market opportunity by Sector ($ million)
      • Data Table on Market opportunity by Sector ($ million)

    10 Customer Landscape

    • 10.1 Customer landscape overview
      • Analysis of price sensitivity, lifecycle, customer purchase basket, adoption rates, and purchase criteria

    11 Geographic Landscape

    • 11.1 Geographic segmentation
      • Chart on Market share by geography 2024-2029 (%)
      • Data Table on Market share by geography 2024-2029 (%)
    • 11.2 Geographic comparison
      • Chart on Geographic comparison
      • Data Table on Geographic comparison
    • 11.3 North America - Market size and forecast 2024-2029
      • Chart on North America - Market size and forecast 2024-2029 ($ million)
      • Data Table on North America - Market size and forecast 2024-2029 ($ million)
      • Chart on North America - Year-over-year growth 2024-2029 (%)
      • Data Table on North America - Year-over-year growth 2024-2029 (%)
    • 11.4 APAC - Market size and forecast 2024-2029
      • Chart on APAC - Market size and forecast 2024-2029 ($ million)
      • Data Table on APAC - Market size and forecast 2024-2029 ($ million)
      • Chart on APAC - Year-over-year growth 2024-2029 (%)
      • Data Table on APAC - Year-over-year growth 2024-2029 (%)
    • 11.5 Europe - Market size and forecast 2024-2029
      • Chart on Europe - Market size and forecast 2024-2029 ($ million)
      • Data Table on Europe - Market size and forecast 2024-2029 ($ million)
      • Chart on Europe - Year-over-year growth 2024-2029 (%)
      • Data Table on Europe - Year-over-year growth 2024-2029 (%)
    • 11.6 Middle East and Africa - Market size and forecast 2024-2029
      • Chart on Middle East and Africa - Market size and forecast 2024-2029 ($ million)
      • Data Table on Middle East and Africa - Market size and forecast 2024-2029 ($ million)
      • Chart on Middle East and Africa - Year-over-year growth 2024-2029 (%)
      • Data Table on Middle East and Africa - Year-over-year growth 2024-2029 (%)
    • 11.7 South America - Market size and forecast 2024-2029
      • Chart on South America - Market size and forecast 2024-2029 ($ million)
      • Data Table on South America - Market size and forecast 2024-2029 ($ million)
      • Chart on South America - Year-over-year growth 2024-2029 (%)
      • Data Table on South America - Year-over-year growth 2024-2029 (%)
    • 11.8 US - Market size and forecast 2024-2029
      • Chart on US - Market size and forecast 2024-2029 ($ million)
      • Data Table on US - Market size and forecast 2024-2029 ($ million)
      • Chart on US - Year-over-year growth 2024-2029 (%)
      • Data Table on US - Year-over-year growth 2024-2029 (%)
    • 11.9 China - Market size and forecast 2024-2029
      • Chart on China - Market size and forecast 2024-2029 ($ million)
      • Data Table on China - Market size and forecast 2024-2029 ($ million)
      • Chart on China - Year-over-year growth 2024-2029 (%)
      • Data Table on China - Year-over-year growth 2024-2029 (%)
    • 11.10 Germany - Market size and forecast 2024-2029
      • Chart on Germany - Market size and forecast 2024-2029 ($ million)
      • Data Table on Germany - Market size and forecast 2024-2029 ($ million)
      • Chart on Germany - Year-over-year growth 2024-2029 (%)
      • Data Table on Germany - Year-over-year growth 2024-2029 (%)
    • 11.11 India - Market size and forecast 2024-2029
      • Chart on India - Market size and forecast 2024-2029 ($ million)
      • Data Table on India - Market size and forecast 2024-2029 ($ million)
      • Chart on India - Year-over-year growth 2024-2029 (%)
      • Data Table on India - Year-over-year growth 2024-2029 (%)
    • 11.12 UK - Market size and forecast 2024-2029
      • Chart on UK - Market size and forecast 2024-2029 ($ million)
      • Data Table on UK - Market size and forecast 2024-2029 ($ million)
      • Chart on UK - Year-over-year growth 2024-2029 (%)
      • Data Table on UK - Year-over-year growth 2024-2029 (%)
    • 11.13 Japan - Market size and forecast 2024-2029
      • Chart on Japan - Market size and forecast 2024-2029 ($ million)
      • Data Table on Japan - Market size and forecast 2024-2029 ($ million)
      • Chart on Japan - Year-over-year growth 2024-2029 (%)
      • Data Table on Japan - Year-over-year growth 2024-2029 (%)
    • 11.14 Canada - Market size and forecast 2024-2029
      • Chart on Canada - Market size and forecast 2024-2029 ($ million)
      • Data Table on Canada - Market size and forecast 2024-2029 ($ million)
      • Chart on Canada - Year-over-year growth 2024-2029 (%)
      • Data Table on Canada - Year-over-year growth 2024-2029 (%)
    • 11.15 South Korea - Market size and forecast 2024-2029
      • Chart on South Korea - Market size and forecast 2024-2029 ($ million)
      • Data Table on South Korea - Market size and forecast 2024-2029 ($ million)
      • Chart on South Korea - Year-over-year growth 2024-2029 (%)
      • Data Table on South Korea - Year-over-year growth 2024-2029 (%)
    • 11.16 Australia - Market size and forecast 2024-2029
      • Chart on Australia - Market size and forecast 2024-2029 ($ million)
      • Data Table on Australia - Market size and forecast 2024-2029 ($ million)
      • Chart on Australia - Year-over-year growth 2024-2029 (%)
      • Data Table on Australia - Year-over-year growth 2024-2029 (%)
    • 11.17 France - Market size and forecast 2024-2029
      • Chart on France - Market size and forecast 2024-2029 ($ million)
      • Data Table on France - Market size and forecast 2024-2029 ($ million)
      • Chart on France - Year-over-year growth 2024-2029 (%)
      • Data Table on France - Year-over-year growth 2024-2029 (%)
    • 11.18 Market opportunity by geography
      • Market opportunity by geography ($ million)
      • Data Tables on Market opportunity by geography ($ million)

    12 Drivers, Challenges, and Opportunity/Restraints

    • 12.1 Market drivers
      • 12.2 Market challenges
        • 12.3 Impact of drivers and challenges
          • Impact of drivers and challenges in 2024 and 2029
        • 12.4 Market opportunities/restraints

          13 Competitive Landscape

          • 13.1 Overview
            • 13.2 Competitive Landscape
              • Overview on criticality of inputs and factors of differentiation
            • 13.3 Landscape disruption
              • Overview on factors of disruption
            • 13.4 Industry risks
              • Impact of key risks on business

            14 Competitive Analysis

            • 14.1 Companies profiled
              • Companies covered
            • 14.2 Company ranking index
              • Company ranking index
            • 14.3 Market positioning of companies
              • Matrix on companies position and classification
            • 14.4 Cohere Inc.
              • Cohere Inc. - Overview
              • Cohere Inc. - Product / Service
              • Cohere Inc. - Key offerings
              • SWOT
            • 14.5 GE Healthcare Technologies Inc.
              • GE Healthcare Technologies Inc. - Overview
              • GE Healthcare Technologies Inc. - Business segments
              • GE Healthcare Technologies Inc. - Key news
              • GE Healthcare Technologies Inc. - Key offerings
              • GE Healthcare Technologies Inc. - Segment focus
              • SWOT
            • 14.6 Google LLC
              • Google LLC - Overview
              • Google LLC - Product / Service
              • Google LLC - Key offerings
              • SWOT
            • 14.7 International Business Machines Corp.
              • International Business Machines Corp. - Overview
              • International Business Machines Corp. - Business segments
              • International Business Machines Corp. - Key news
              • International Business Machines Corp. - Key offerings
              • International Business Machines Corp. - Segment focus
              • SWOT
            • 14.8 IQVIA Holdings Inc.
              • IQVIA Holdings Inc. - Overview
              • IQVIA Holdings Inc. - Business segments
              • IQVIA Holdings Inc. - Key offerings
              • IQVIA Holdings Inc. - Segment focus
              • SWOT
            • 14.9 Koninklijke Philips NV
              • Koninklijke Philips NV - Overview
              • Koninklijke Philips NV - Business segments
              • Koninklijke Philips NV - Key news
              • Koninklijke Philips NV - Key offerings
              • Koninklijke Philips NV - Segment focus
              • SWOT
            • 14.10 Medtronic Plc
              • Medtronic Plc - Overview
              • Medtronic Plc - Business segments
              • Medtronic Plc - Key news
              • Medtronic Plc - Key offerings
              • Medtronic Plc - Segment focus
              • SWOT
            • 14.11 Microsoft Corp.
              • Microsoft Corp. - Overview
              • Microsoft Corp. - Business segments
              • Microsoft Corp. - Key news
              • Microsoft Corp. - Key offerings
              • Microsoft Corp. - Segment focus
              • SWOT
            • 14.12 NVIDIA Corp.
              • NVIDIA Corp. - Overview
              • NVIDIA Corp. - Business segments
              • NVIDIA Corp. - Key news
              • NVIDIA Corp. - Key offerings
              • NVIDIA Corp. - Segment focus
              • SWOT
            • 14.13 OpenAI
              • OpenAI - Overview
              • OpenAI - Product / Service
              • OpenAI - Key offerings
              • SWOT
            • 14.14 Oracle Corp.
              • Oracle Corp. - Overview
              • Oracle Corp. - Business segments
              • Oracle Corp. - Key news
              • Oracle Corp. - Key offerings
              • Oracle Corp. - Segment focus
              • SWOT
            • 14.15 Siemens Healthineers AG
              • Siemens Healthineers AG - Overview
              • Siemens Healthineers AG - Business segments
              • Siemens Healthineers AG - Key news
              • Siemens Healthineers AG - Key offerings
              • Siemens Healthineers AG - Segment focus
              • SWOT
            • 14.16 Tempus Labs Inc.
              • Tempus Labs Inc. - Overview
              • Tempus Labs Inc. - Product / Service
              • Tempus Labs Inc. - Key offerings
              • SWOT
            • 14.17 United Health Group Inc.
              • United Health Group Inc. - Overview
              • United Health Group Inc. - Business segments
              • United Health Group Inc. - Key offerings
              • United Health Group Inc. - Segment focus
              • SWOT
            • 14.18 Wolters Kluwer NV
              • Wolters Kluwer NV - Overview
              • Wolters Kluwer NV - Business segments
              • Wolters Kluwer NV - Key news
              • Wolters Kluwer NV - Key offerings
              • Wolters Kluwer NV - Segment focus
              • SWOT

            15 Appendix

            • 15.1 Scope of the report
              • 15.2 Inclusions and exclusions checklist
                • Inclusions checklist
                • Exclusions checklist
              • 15.3 Currency conversion rates for US$
                • Currency conversion rates for US$
              • 15.4 Research methodology
                • Research methodology
              • 15.5 Data procurement
                • Information sources
              • 15.6 Data validation
                • Data validation
              • 15.7 Validation techniques employed for market sizing
                • Validation techniques employed for market sizing
              • 15.8 Data synthesis
                • Data synthesis
              • 15.9 360 degree market analysis
                • 360 degree market analysis
              • 15.10 List of abbreviations
                • List of abbreviations

              Research Methodology

              Technavio presents a detailed picture of the market by way of study, synthesis, and summation of data from multiple sources. The analysts have presented the various facets of the market with a particular focus on identifying the key industry influencers. The data thus presented is comprehensive, reliable, and the result of extensive research, both primary and secondary.

              INFORMATION SOURCES

              Primary sources

              • Manufacturers and suppliers
              • Channel partners
              • Industry experts
              • Strategic decision makers

              Secondary sources

              • Industry journals and periodicals
              • Government data
              • Financial reports of key industry players
              • Historical data
              • Press releases

              DATA ANALYSIS

              Data Synthesis

              • Collation of data
              • Estimation of key figures
              • Analysis of derived insights

              Data Validation

              • Triangulation with data models
              • Reference against proprietary databases
              • Corroboration with industry experts

              REPORT WRITING

              Qualitative

              • Market drivers
              • Market challenges
              • Market trends
              • Five forces analysis

              Quantitative

              • Market size and forecast
              • Market segmentation
              • Geographical insights
              • Competitive landscape

              Interested in this report?

              Get your sample now to see our research methodology and insights!

              Download Now

              Frequently Asked Questions

              Ai-Powered Clinical Decision Support market growth will increase by $ 3448.4 mn during 2025-2029.

              The Ai-Powered Clinical Decision Support market is expected to grow at a CAGR of 30% during 2025-2029.

              Ai-Powered Clinical Decision Support market is segmented by Component( Software, Services) Deployment( Cloud based, On premises) Application( Medical diagnosis, Prescription decision support and personalized medicine, Treatment planning, Patient monitoring, Alerts)

              Cerner Corp., Cohere Inc., Elsevier Ltd, Epic Systems Corp., GE Healthcare Technologies Inc., Google LLC, Hugging Face, International Business Machines Corp., IQVIA Holdings Inc., Koninklijke Philips NV, Medtronic Plc, Microsoft Corp., NVIDIA Corp., OpenAI, Oracle Corp., Palantir Technologies Inc., Siemens Healthineers AG, Tempus Labs Inc., United Health Group Inc., Wolters Kluwer NV are a few of the key vendors in the Ai-Powered Clinical Decision Support market.

              North America will register the highest growth rate of 41% among the other regions. Therefore, the Ai-Powered Clinical Decision Support market in North America is expected to garner significant business opportunities for the vendors during the forecast period.

              China, India, Japan, South Korea, Australia, Germany, UK, France, US, Canada

              • Proliferation of digitized healthcare data and concurrent advancements in artificial intelligenceA primary driver propelling the global AI-powered clinical decision support market is the synergistic combination of an exponential increase in digitized healthcare data and rapid advancements in AI technologies capable of interpreting it. For decades the adoption of electronic health records (EHRs) has been creating vast albeit often siloed and unstructured repositories of patient information. This digital foundation which includes everything from lab results and medication lists to unstructured clinical notes and medical imaging archives has created the raw material necessary for data-driven medicine. However it is the recent and rapid maturation of AI particularly in natural language processing and generative AI that has finally unlocked the ability to analyze this data at scale and extract clinically relevant insights. These advanced algorithms can now read and comprehend unstructured text interpret complex medical images and synthesize information from millions of data points to identify patterns that are beyond the scope of human analysis. This technological leap is evidenced by a flurry of recent industry activities. A landmark instance is the expanded partnership between Microsoft and Epic Systems announced in April 2023 and broadened in August 2023 to integrate Microsoft Azure OpenAI Service directly into the Epic EHR platform. This collaboration aims to leverage generative AI to automatically summarize lengthy patient records and help draft clinical documentation directly turning unstructured data into actionable clinical summaries. Similarly Oracle following its acquisition of Cerner announced in June 2024 the general availability of its Clinical Digital Assistant which uses generative AI to listen to patient encounters and automate note generation within the EHR. Beyond the EHR specialized data platforms are being created specifically to fuel AI-driven insights. In November 2023 the selection of Palantir to provide the Federated Data Platform for NHS England signaled a major governmental commitment to creating a unified data ecosystem for analysis enabling the development of CDSS tools on a national scale while maintaining data governance. This deluge of data and the tools to process it create a powerful self-reinforcing cycle: as AI tools demonstrate their value they incentivize further data digitization and integration which in turn provides more data to train even more sophisticated and accurate models. is the driving factor this market.

              The Ai-Powered Clinical Decision Support market vendors should focus on grabbing business opportunities from the Software segment as it accounted for the largest market share in the base year.
              RIA - Research AI Assistant
              Ask RIA