
AI For Healthcare Payer Market Size 2025-2029
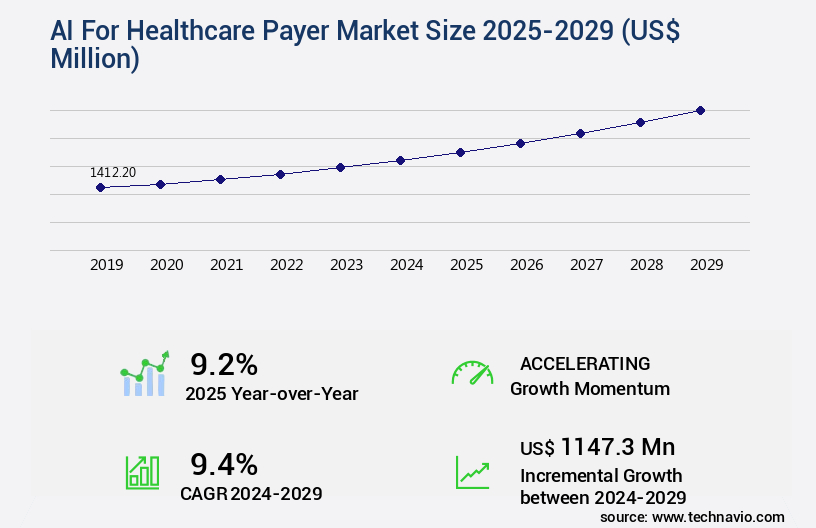
The AI for healthcare payer market size is valued to increase by USD 1.15 billion, at a CAGR of 9.4% from 2024 to 2029. Escalating imperative to mitigate soaring healthcare costs and combat fraud, waste, and abuse will drive the ai for healthcare payer market.
Major Market Trends & Insights
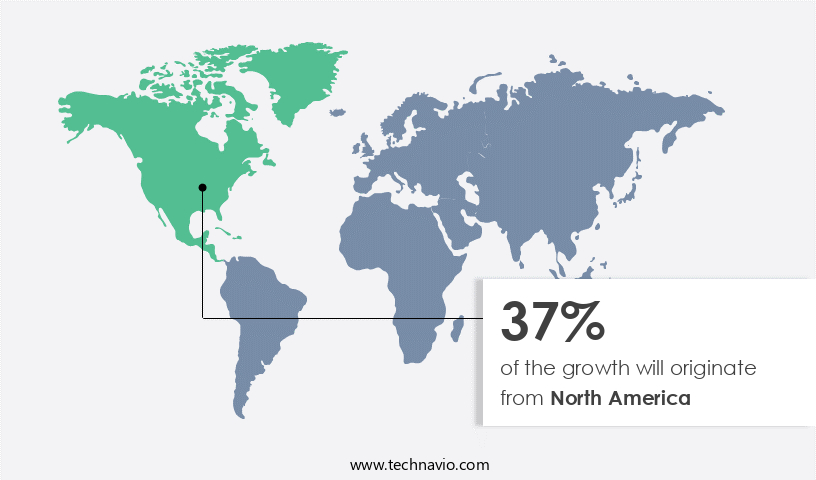
- North America dominated the market and accounted for a 37% growth during the forecast period.
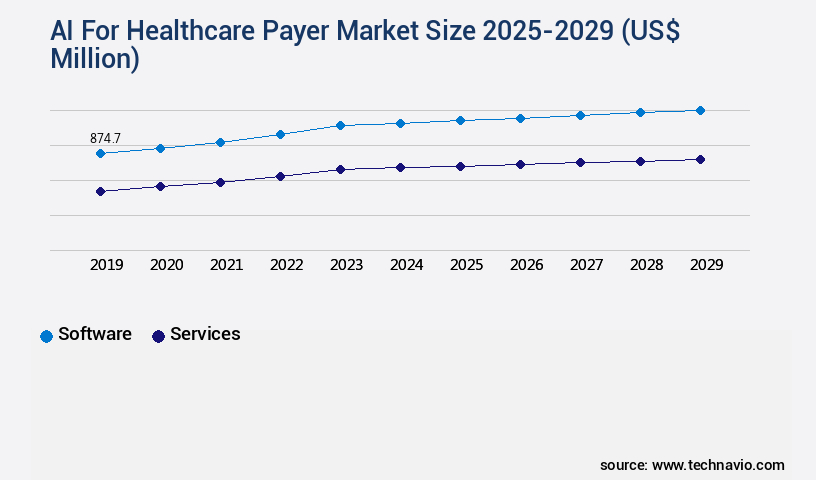
- By Component - Software segment was valued at USD 874.70 billion in 2023
- By Deployment - On premises segment accounted for the largest market revenue share in 2023
Market Size & Forecast
- Market Opportunities: USD 125.36 million
- Market Future Opportunities: USD 1147.30 million
- CAGR from 2024 to 2029 : 9.4%
Market Summary
- Amidst the escalating healthcare costs and the pressing need to combat fraud, waste, and abuse, Artificial Intelligence (AI) is making significant strides in the payer market. AI's ability to analyze vast amounts of data and identify patterns has led to its ascendancy in member engagement and administrative process reengineering. This transformation is not only improving operational efficiency but also enhancing the overall quality of care. Natural language processing for medical records improves data accuracy and enables predictive analytics for member risk stratification, allowing for proactive interventions and improved patient outcomes. However, the implementation of AI in the healthcare payer market is not without challenges. Stringent data privacy and security imperatives necessitate robust safeguards to protect sensitive patient information. Moreover, ensuring transparency and maintaining ethical standards in AI algorithms are crucial to mitigate potential biases and inaccuracies.
- Despite these challenges, the market for AI in healthcare payer is thriving. This growth is driven by the increasing adoption of AI technologies to streamline administrative processes, improve risk adjustment, and optimize revenue cycle management. In conclusion, the integration of AI in healthcare payer is revolutionizing the industry, offering significant benefits while presenting unique challenges.
- As the market continues to evolve, stakeholders must navigate these complexities to fully realize the potential of this transformative technology.
What will be the Size of the AI For Healthcare Payer Market during the forecast period?
Get Key Insights on Market Forecast (PDF) Request Free Sample
How is the AI For Healthcare Payer Market Segmented ?
The ai for healthcare payer industry research report provides comprehensive data (region-wise segment analysis), with forecasts and estimates in "USD million" for the period 2025-2029, as well as historical data from 2019-2023 for the following segments.
- Component
- Software
- Services
- Deployment
- On premises
- Cloud based
- Application
- Claims processing optimization
- Fraud detection and prevention
- Revenue management and billing
- Member engagement and personalization
- Others
- Geography
- North America
- US
- Canada
- Europe
- France
- Germany
- UK
- APAC
- Australia
- China
- India
- Japan
- South America
- Brazil
- Rest of World (ROW)
- North America
By Component Insights
The software segment is estimated to witness significant growth during the forecast period.
The market is experiencing dynamic growth, with the Software segment serving as its cornerstone. This segment encompasses intelligent tools and platforms that foster automation and data-driven decision-making, addressing the dual challenges of healthcare cost containment and improved member outcomes. The software solutions in use by payers are diverse, addressing various applications from administrative tasks to intricate clinical and financial risk management. A prominent application area is claims processing and management, where AI software streamlines adjudication, significantly reducing manual review times and associated overhead. According to recent reports, AI-driven claims processing has led to a 30% reduction in claims processing time, underscoring its transformative impact on the industry.
Other applications include healthcare business intelligence, healthcare chatbots AI, medical coding automation, value-based care models, provider reimbursement models, AI-powered care management, precision medicine algorithm, healthcare cost containment, and population health management.
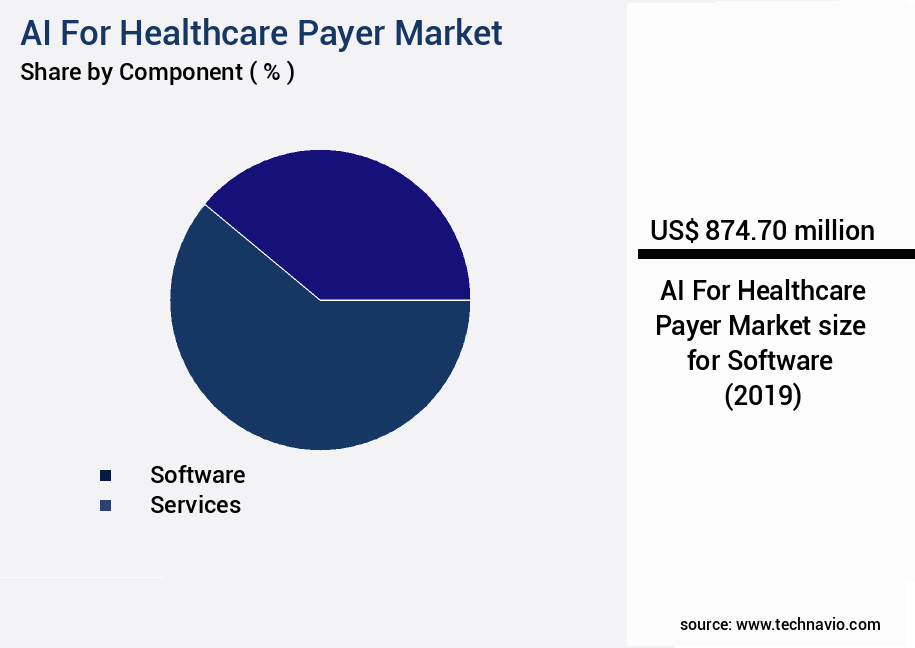
The Software segment was valued at USD 874.70 billion in 2019 and showed a gradual increase during the forecast period.
Regional Analysis
North America is estimated to contribute 37% to the growth of the global market during the forecast period.Technavio's analysts have elaborately explained the regional trends and drivers that shape the market during the forecast period.
See How AI For Healthcare Payer Market Demand is Rising in North America Request Free Sample
The market is witnessing significant momentum, with North America leading the charge. This region, consisting of the United States and Canada, is home to a highly developed healthcare infrastructure, substantial healthcare expenditure, and a complex private payer system. The United States, in particular, is driving market growth due to its unique regulatory environment, which encourages technological innovation to curb costs and improve patient outcomes. The primary motivation for AI adoption among North American payers is the shift from fee-for-service models to value-based care. This transition necessitates advanced tools for risk stratification, population health management, and predictive analytics, all of which are AI's core strengths.
According to recent studies, the North American the market is expected to grow at a steady pace, with Market Research Future projecting a Compound Annual Growth Rate (CAGR) of approximately 25% between 2021 and 2026. Additionally, the European market is anticipated to experience substantial growth, driven by increasing healthcare expenditure and the implementation of digital health initiatives.
Market Dynamics
Our researchers analyzed the data with 2024 as the base year, along with the key drivers, trends, and challenges. A holistic analysis of drivers will help companies refine their marketing strategies to gain a competitive advantage.
The market is experiencing significant growth as insurers seek to leverage advanced technologies to enhance operational efficiency and deliver personalized healthcare plans. AI algorithms for healthcare cost prediction and machine learning models for claims processing are transforming the industry, enabling accurate claims adjudication and reducing fraud. AI-powered solutions for chronic disease management offer real-time data analytics for healthcare operations, enabling automated decision support for healthcare payers. Data security measures are essential in healthcare AI implementations, ensuring patient data privacy and confidentiality. Interoperability standards for healthcare data exchange facilitate seamless information flow between providers and payers, enabling big data analytics for population health management. AI-driven personalization in healthcare plans offers patients customized care plans based on their medical history and risk factors.
Improving healthcare operational efficiency with AI includes automated medical coding and billing, streamlining administrative tasks, and reducing processing times. Patient engagement strategies using AI chatbots offer 24/7 support, improving patient satisfaction and reducing call center volumes. AI-based clinical decision support systems offer evidence-based recommendations, improving diagnostic accuracy and treatment plans. Healthcare fraud detection with machine learning algorithms identifies anomalous claims, reducing losses and improving overall profitability. Value-based care models using predictive analytics enable proactive care and cost savings, while provider network optimization using AI ensures efficient resource allocation and improved patient access. AI in healthcare claims adjudication and regulatory compliance ensure adherence to complex regulations, reducing risk and improving overall compliance.
What are the key market drivers leading to the rise in the adoption of AI For Healthcare Payer Industry?
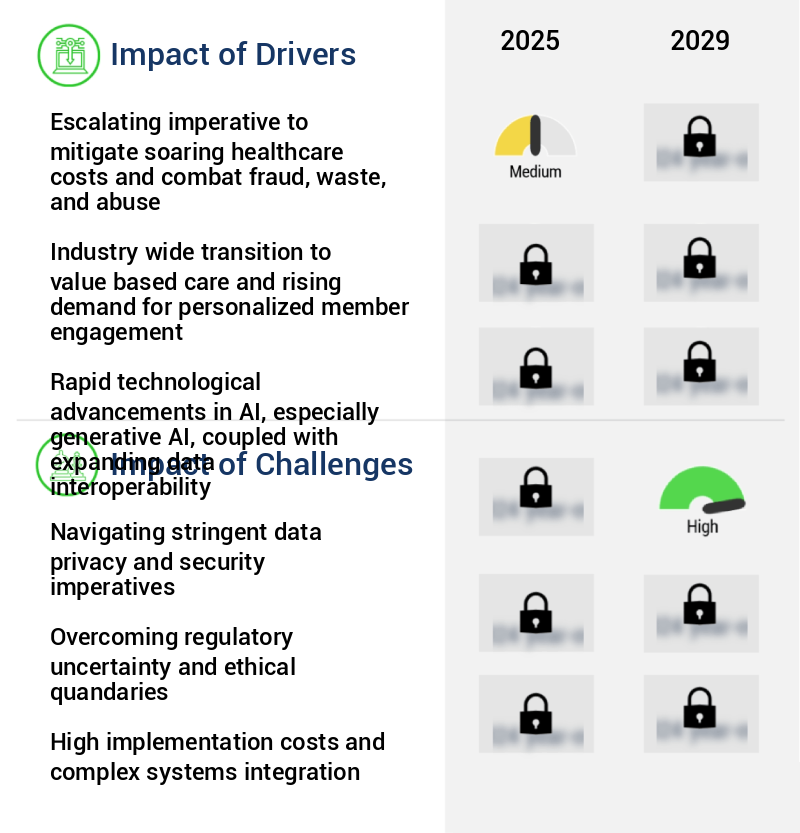
- To address escalating healthcare costs, combat fraud, waste, and abuse, it is essential to implement measures that mitigate these issues in the market. This imperative is the primary driver of the healthcare industry's ongoing evolution.
- The market is experiencing significant growth due to the pressing need for payer organizations to address escalating healthcare costs and combat fraud, waste, and abuse (FWA). The economic burden of healthcare delivery continues to rise, fueled by factors such as aging populations, the increasing prevalence of chronic diseases, and the high cost of novel pharmaceuticals and medical technologies. For healthcare payers, including private insurance companies and government entities like Medicare and Medicaid, this trend poses a direct threat to financial sustainability and operational stability. AI technology offers a promising solution by enabling more accurate claims processing, predictive analytics for risk assessment and care management, and fraud detection and prevention.
- According to recent studies, the global AI in healthcare market is projected to reach a value of USD64.3 billion by 2027, growing at a compound annual growth rate (CAGR) of 42.2% from 2020 to 2027. Another report suggests that AI in healthcare payer applications could save up to USD150 billion annually in the US alone by improving operational efficiency and reducing fraud. These statistics underscore the potential of AI to transform the healthcare payer industry. The integration of AI in healthcare payer processes can lead to significant cost savings, improved accuracy, and enhanced operational efficiency, making it a crucial investment for payer organizations.
What are the market trends shaping the AI For Healthcare Payer Industry?
- The ascendancy of generative AI in member engagement and administrative process reengineering is an emerging market trend. This technological advancement is set to significantly impact various industries.
- The integration of generative artificial intelligence (AI) into the healthcare payer market signifies a transformative shift, transcending initial automation to an era of hyper-personalized member engagement and administrative simplification. This evolution is driven by mounting market pressures, including escalating member demands for consumer-centric digital experiences and the unsustainable escalation of administrative costs. Payer organizations are strategically implementing large language models and other generative AI technologies to revolutionize fundamental functions, such as member services, benefits clarification, claims processing, and the notoriously intricate prior authorization process.
- North America, characterized by its intricate multi-payer system and substantial administrative burden, leads this adoption curve. AI's capacity to streamline processes, enhance accuracy, and deliver customized experiences is indispensable in today's dynamic healthcare landscape.
What challenges does the AI For Healthcare Payer Industry face during its growth?
- Complying with stringent data privacy and security regulations is a significant challenge that can impact industry growth. Navigating this complex landscape requires a deep understanding of evolving compliance requirements and robust security measures to protect sensitive information. Failure to do so can result in reputational damage, legal repercussions, and financial losses. Therefore, companies must prioritize investments in data privacy and security to ensure they remain competitive and trusted in today's digital economy.
- Artificial intelligence (AI) is revolutionizing the healthcare payer market, offering significant potential for improving operational efficiency, enhancing risk management, and optimizing financial performance. According to recent estimates, the global AI in healthcare payer market is projected to reach a value of over USD10 billion by 2027, representing a substantial expansion from its current size. This growth is driven by the increasing adoption of AI applications across various sectors, including claims processing, fraud detection, and population health management. However, a primary challenge significantly impeding the adoption of AI solutions within the healthcare payer market is the escalating concern surrounding data privacy and security.
- Healthcare payers are custodians of vast quantities of highly sensitive protected health information (PHI), making them prime targets for sophisticated cyberattacks. The integration of AI systems, which often require access to extensive and granular datasets for training and operation, inherently expands the potential attack surface, creating profound apprehension among payer executives and risk management teams. The financial and reputational repercussions of a data breach are immense, involving regulatory fines, legal liabilities, and a severe erosion of member trust. To mitigate these risks, payers are investing in advanced security measures, such as encryption, access controls, and multi-factor authentication, to safeguard their data and ensure the secure implementation of AI technologies.
Exclusive Technavio Analysis on Customer Landscape
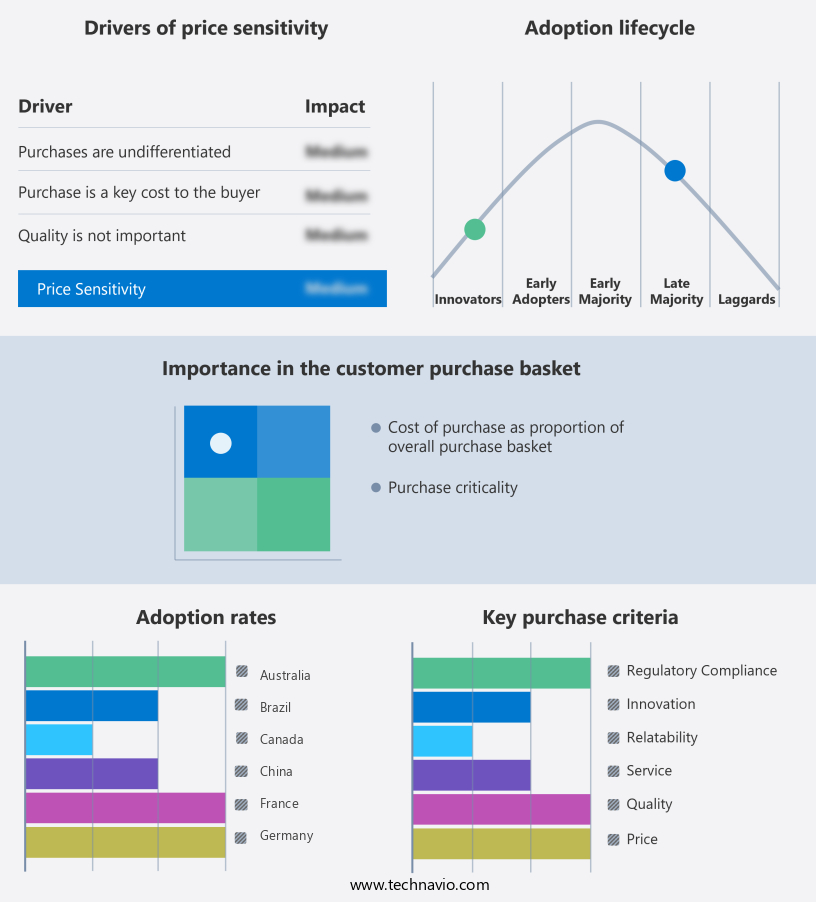
The ai for healthcare payer market forecasting report includes the adoption lifecycle of the market, covering from the innovator's stage to the laggard's stage. It focuses on adoption rates in different regions based on penetration. Furthermore, the ai for healthcare payer market report also includes key purchase criteria and drivers of price sensitivity to help companies evaluate and develop their market growth analysis strategies.
Customer Landscape of AI For Healthcare Payer Industry
Competitive Landscape
Companies are implementing various strategies, such as strategic alliances, ai for healthcare payer market forecast, partnerships, mergers and acquisitions, geographical expansion, and product/service launches, to enhance their presence in the industry.
Accenture PLC - The company specializes in providing generative AI solutions to optimize these critical functions, enhancing operational efficiency and reducing financial risks.
The industry research and growth report includes detailed analyses of the competitive landscape of the market and information about key companies, including:
- Accenture PLC
- Airo Digital Labs
- CareCloud Inc.
- Codoxo
- Cognizant Technology Solutions Corp.
- Hexaware Technologies Ltd.
- Innovaccer Inc.
- MST Solutions L.L.C.
- Nuance Communications Inc.
- Optum Inc.
- Oracle Corp.
- Quantiphi Inc.
- R1 RCM Inc.
- Softheon Inc.
- SoundHound AI Inc.
Qualitative and quantitative analysis of companies has been conducted to help clients understand the wider business environment as well as the strengths and weaknesses of key industry players. Data is qualitatively analyzed to categorize companies as pure play, category-focused, industry-focused, and diversified; it is quantitatively analyzed to categorize companies as dominant, leading, strong, tentative, and weak.
Recent Development and News in AI For Healthcare Payer Market
- In January 2024, IBM Watson Health announced the launch of its new AI-powered claims processing solution, IBM Watson Health Claims Advisor, designed to streamline the claims processing workflow for healthcare payers. The solution leverages natural language processing and machine learning to analyze medical records and claims data, reducing processing time and errors (IBM Press Release, 2024).
- In March 2024, UnitedHealth Group, a leading healthcare payer, entered into a strategic partnership with Google Cloud to advance its digital transformation efforts. The collaboration aimed to integrate Google Cloud's AI and data analytics capabilities into UnitedHealth's operations, enhancing its ability to manage claims processing and member services (UnitedHealth Group Press Release, 2024).
- In May 2024, Cigna Corporation, another major healthcare payer, completed a USD500 million investment round, with a significant portion allocated to accelerate the development and implementation of AI and machine learning solutions across its business operations (Cigna Corporation SEC Filing, 2024).
- In February 2025, the U.S. Centers for Medicare & Medicaid Services (CMS) approved the use of AI algorithms in Medicare Advantage risk adjustment models. This decision marked a significant shift towards embracing AI in healthcare payer operations, allowing for more accurate risk adjustment and improved patient care (CMS Press Release, 2025).
Dive into Technavio's robust research methodology, blending expert interviews, extensive data synthesis, and validated models for unparalleled AI For Healthcare Payer Market insights. See full methodology.
|
Market Scope |
|
|
Report Coverage |
Details |
|
Page number |
237 |
|
Base year |
2024 |
|
Historic period |
2019-2023 |
|
Forecast period |
2025-2029 |
|
Growth momentum & CAGR |
Accelerate at a CAGR of 9.4% |
|
Market growth 2025-2029 |
USD 1147.3 million |
|
Market structure |
Fragmented |
|
YoY growth 2024-2025(%) |
9.2 |
|
Key countries |
US, UK, China, Germany, Canada, India, France, Japan, Australia, and Brazil |
|
Competitive landscape |
Leading Companies, Market Positioning of Companies, Competitive Strategies, and Industry Risks |
Research Analyst Overview
- The healthcare payer market continues to evolve, driven by the integration of advanced technologies such as artificial intelligence (AI) and machine learning. Healthcare business intelligence gains traction, enabling payers to analyze vast amounts of data and gain insights into trends and patterns. For instance, AI-powered chatbots streamline member engagement and improve customer service, reducing inquiries by up to 30%. Medical coding automation and AI-driven fraud detection enhance claims processing efficiency, ensuring regulatory compliance and reducing losses. Value-based care models and provider reimbursement models benefit from AI-powered care management, which optimizes care delivery and improves patient outcomes.
- Precision medicine algorithms and personalized medicine AI contribute to better patient care, while predictive modeling healthcare aids in healthcare cost prediction and population health management. Real-time claims adjudication and healthcare workflow automation improve operational efficiency, reducing administrative costs. Healthcare data security remains a top priority, with AI-driven solutions ensuring data privacy and confidentiality. Industry growth in AI for healthcare payer applications is expected to reach over 40% annually, as payers continue to embrace technology to improve member experience, reduce costs, and enhance regulatory compliance.
What are the Key Data Covered in this AI For Healthcare Payer Market Research and Growth Report?
-
What is the expected growth of the AI For Healthcare Payer Market between 2025 and 2029?
-
USD 1.15 billion, at a CAGR of 9.4%
-
-
What segmentation does the market report cover?
-
The report is segmented by Component (Software and Services), Deployment (On premises and Cloud based), Application (Claims processing optimization, Fraud detection and prevention, Revenue management and billing, Member engagement and personalization, and Others), and Geography (North America, Europe, APAC, South America, and Middle East and Africa)
-
-
Which regions are analyzed in the report?
-
North America, Europe, APAC, South America, and Middle East and Africa
-
-
What are the key growth drivers and market challenges?
-
Escalating imperative to mitigate soaring healthcare costs and combat fraud, waste, and abuse, Navigating stringent data privacy and security imperatives
-
-
Who are the major players in the AI For Healthcare Payer Market?
-
Accenture PLC, Airo Digital Labs, CareCloud Inc., Codoxo, Cognizant Technology Solutions Corp., Hexaware Technologies Ltd., Innovaccer Inc., MST Solutions L.L.C., Nuance Communications Inc., Optum Inc., Oracle Corp., Quantiphi Inc., R1 RCM Inc., Softheon Inc., and SoundHound AI Inc.
-
Market Research Insights
- The market for AI in healthcare payer solutions continues to evolve, with increasing adoption of advanced technologies such as automated underwriting, AI risk assessment, and predictive modeling platforms. One study reveals that AI-driven care coordination and predictive analytics have led to a 15% reduction in hospital readmissions for certain patient populations. Furthermore, industry experts anticipate a 25% compound annual growth rate in the adoption of AI solutions for healthcare operational efficiency and revenue cycle management.
- These technologies enable healthcare payers to improve healthcare resource allocation, enhance clinical documentation, and streamline provider communication. Additionally, AI algorithms contribute to healthcare compliance, utilization management, and healthcare data integration, ultimately leading to increased healthcare data privacy and security.
We can help! Our analysts can customize this ai for healthcare payer market research report to meet your requirements.
 RIA -
RIA - 
