AI In Natural Language Processing Market Analysis, Size, and Forecast 2025-2029: North America (US, Canada, and Mexico), APAC (China, Japan, and India), Europe (Germany, UK, and France), Middle East and Africa (South Africa, UAE, and Saudi Arabia), South America (Brazil, Argentina, and Colombia), and Rest of World (ROW)

AI In Natural Language Processing Market Analysis, Size, and Forecast 2025-2029:
North America (US, Canada, and Mexico), APAC (China, Japan, and India), Europe (Germany, UK, and France), Middle East and Africa (South Africa, UAE, and Saudi Arabia), South America (Brazil, Argentina, and Colombia), and Rest of World (ROW)

Published: Dec 2025 322 Pages SKU: IRTNTR81108

Market Overview at a Glance

$38.32 B
Market Opportunity
35.2%
CAGR 2024 - 2029
36.9%
North America Growth
$5.83 B
Solutions segment 2023

AI In Natural Language Processing Market Size 2025-2029

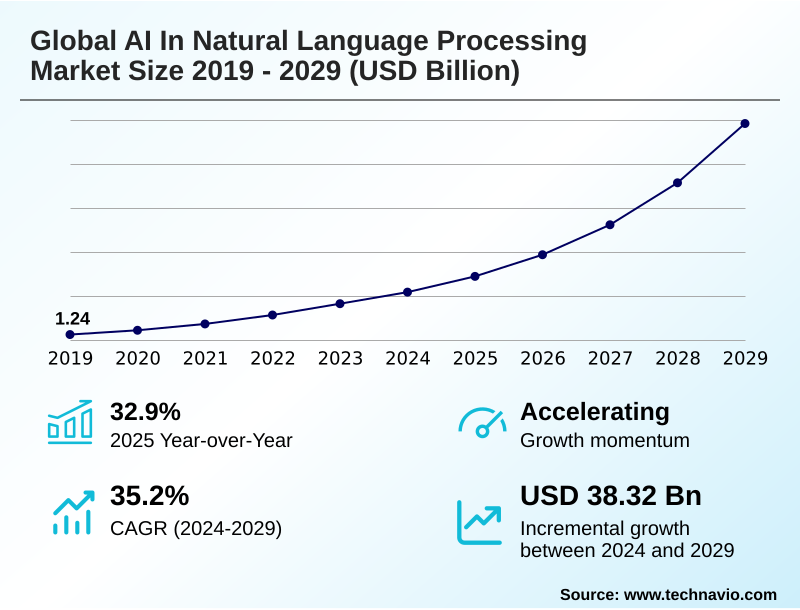
The ai in natural language processing market size is valued to increase by USD 38.32 billion, at a CAGR of 35.2% from 2024 to 2029. Proliferation and democratization of generative AI and large language models will drive the ai in natural language processing market.

Major Market Trends & Insights

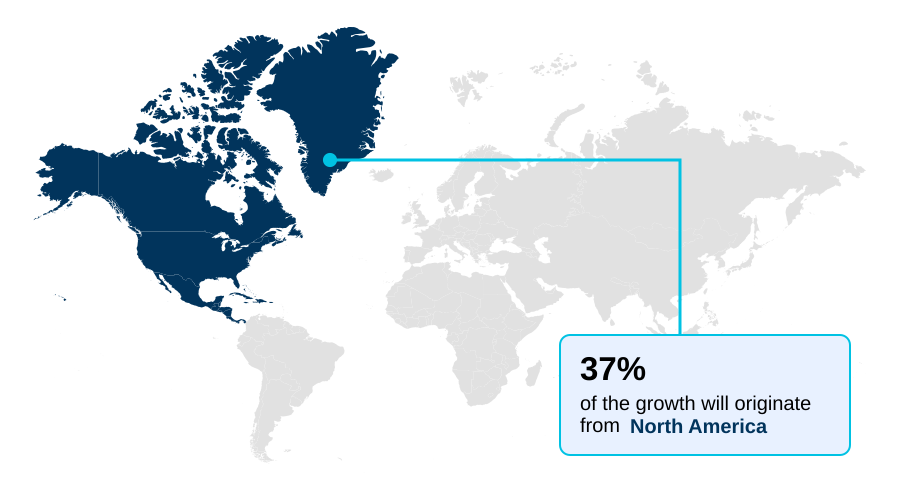
  • North America dominated the market and accounted for a 36.9% growth during the forecast period.
  • By Component - Solutions segment was valued at USD 5.83 billion in 2023
  • By Application - Virtual assistants and chatbots segment accounted for the largest market revenue share in 2023

Market Size & Forecast

  • Market Opportunities: USD 47.96 billion
  • Market Future Opportunities: USD 38.32 billion
  • CAGR from 2024 to 2029 : 35.2%

Market Summary

  • The AI in natural language processing market is defined by technologies that allow machines to interpret, generate, and respond to human language. This field leverages computational linguistics, machine learning, and advanced deep learning models, particularly those based on transformer architectures, to process massive text and speech datasets.
  • The core capability of natural language understanding enables applications such as automated chatbots for customer service, real-time machine translation, and sophisticated sentiment analysis. The advent of large language models has introduced unprecedented capabilities for text generation, creating coherent and contextually aware content.
  • In a key business scenario, financial institutions are deploying these systems to analyze unstructured data from market reports and news feeds, identifying investment signals and assessing risk with a speed unattainable through manual methods. As a critical component of digital transformation, AI in NLP is fundamentally reshaping how organizations automate knowledge-based workflows and engage with customers.

What will be the Size of the AI In Natural Language Processing Market during the forecast period?

Get Key Insights on Market Forecast (PDF) Request Free Sample

How is the AI In Natural Language Processing Market Segmented?

The ai in natural language processing industry research report provides comprehensive data (region-wise segment analysis), with forecasts and estimates in "USD million" for the period 2025-2029, as well as historical data from 2019-2023 for the following segments.
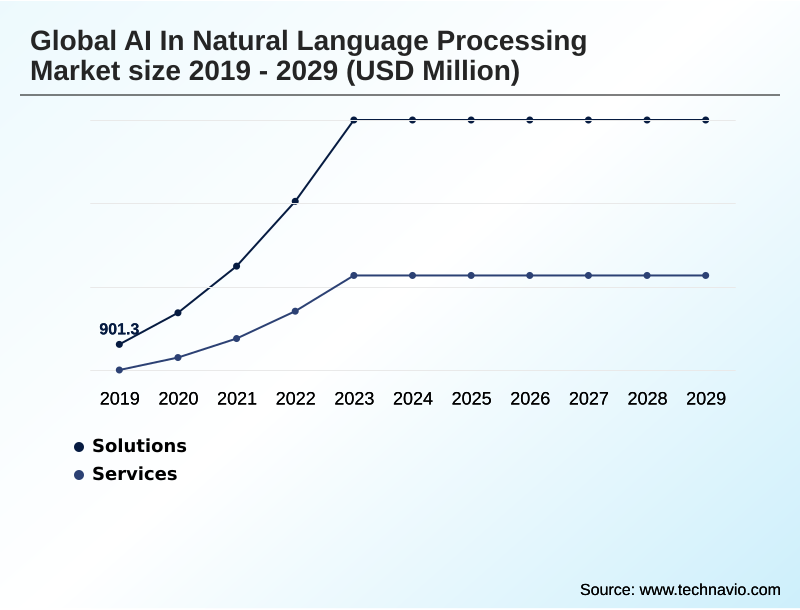
  • Component
    • Solutions
    • Services
  • Application
    • Virtual assistants and chatbots
    • Customer experience management
    • Sentiment analysis
    • Social media monitoring
  • End-user
    • IT and telecommunication
    • BFSI
    • Healthcare
    • Retail
    • Others
  • Geography
    • North America
      • US
      • Canada
      • Mexico
    • APAC
      • China
      • Japan
      • India
    • Europe
      • Germany
      • UK
      • France
    • Middle East and Africa
      • South Africa
      • UAE
      • Saudi Arabia
    • South America
      • Brazil
      • Argentina
      • Colombia
    • Rest of World (ROW)

By Component Insights

The solutions segment is estimated to witness significant growth during the forecast period.

Solutions in the AI in natural language processing market are evolving from task-specific tools to comprehensive generative AI platforms. This shift is centered on large language models and transformer architectures, which enable advanced natural language understanding and text generation.

Modern platforms integrate deep learning models for applications ranging from sentiment analysis to complex semantic analysis.

Enterprises are leveraging these solutions for intelligent process automation and to build domain-specific solutions, with some achieving over a 25% improvement in the accuracy of automated data extraction from unstructured text data.

The move toward model-as-a-service offerings accelerates adoption, providing scalable tools for hyper-personalized customer experiences and knowledge-based workflows without requiring deep in-house expertise in computational linguistics.

Request Free Sample

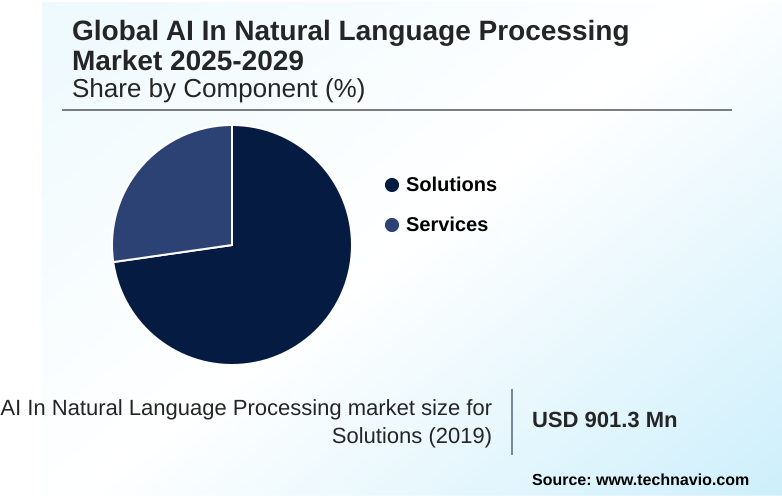
The Solutions segment was valued at USD 5.83 billion in 2023 and showed a gradual increase during the forecast period.

Request Free Sample

Regional Analysis

North America is estimated to contribute 36.9% to the growth of the global market during the forecast period.Technavio’s analysts have elaborately explained the regional trends and drivers that shape the market during the forecast period.

See How AI In Natural Language Processing Market Demand is Rising in North America Request Free Sample

The geographic landscape is led by North America, which accounts for approximately 37% of the incremental growth, fueled by a concentration of pioneering technology firms and significant private sector investment in large language models.

The region's leadership is reinforced by a mature ecosystem for AI safety research and development in areas like speech processing and computer vision. Concurrently, APAC is the fastest-growing region, contributing nearly 30% of market expansion.

This growth is driven by massive digitalization, strong government support for enterprise-grade AI, and the rise of regional technology leaders developing domain-specific solutions.

This dynamic creates a competitive environment where both natural language understanding and generation technologies are advancing rapidly, driven by diverse commercial and governmental needs across both established and emerging economic centers.

Market Dynamics

Our researchers analyzed the data with 2024 as the base year, along with the key drivers, trends, and challenges. A holistic analysis of drivers will help companies refine their marketing strategies to gain a competitive advantage.

  • Strategic adoption across industries is fueling demand for specialized applications. NLP for automated document processing is streamlining back-office functions, while AI in NLP for software development is accelerating coding cycles. In high-stakes environments, AI NLP for fraud detection and NLP for regulatory compliance automation are becoming essential risk management tools.
  • The focus on customer-centricity is driving growth in NLP in customer experience management and the deployment of AI-powered virtual assistants and chatbots. The computational costs of training LLMs remain a significant consideration, influencing the trend toward cloud-based NLP services adoption and the use of open source large language models.
  • The large language model fine-tuning cost is a key factor for companies seeking custom solutions. In operational technology, NLP for predictive maintenance tasks is gaining traction. The market is also seeing strong growth in AI-driven social media monitoring and real-time sentiment analysis applications.
  • The energy required for these systems is a notable factor, with data center electricity use projected to more than double in the near term. For specific sectors, AI NLP in healthcare clinical notes and NLP applications in BFSI sector are transformative.
  • The complexity of these systems necessitates a focus on ethical considerations in NLP models and the development of explainable AI in NLP models to ensure trust. Furthermore, applications like generative AI for content creation, multimodal AI for data analysis, and NLP for supply chain optimization are creating new efficiencies.

What are the key market drivers leading to the rise in the adoption of AI In Natural Language Processing Industry?

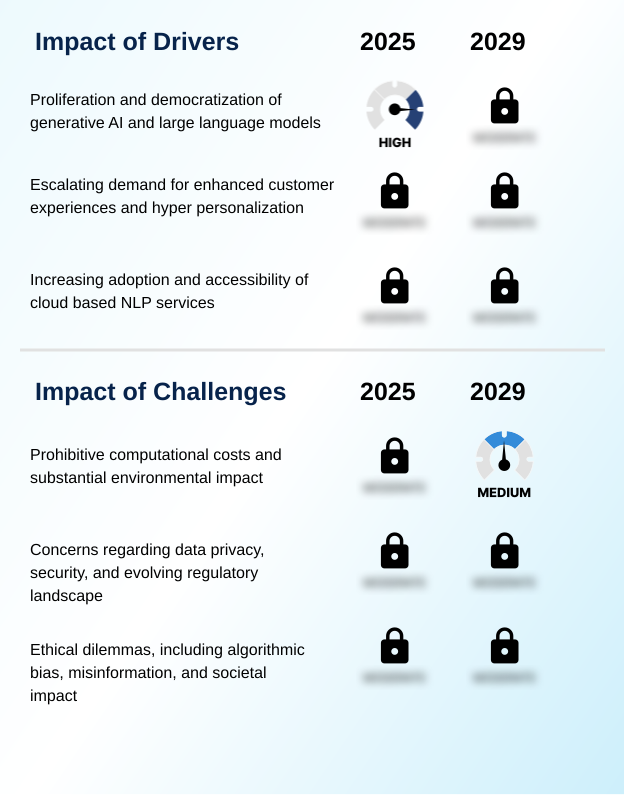
  • The proliferation and democratization of generative AI and large language models serve as a key driver propelling market growth and innovation.

  • The primary market driver is the proliferation of powerful large language models, which has lowered barriers to entry and spurred widespread adoption.
  • The accessibility of these models via cloud-based model-as-a-service platforms has been critical, with data center revenues for key hardware suppliers growing over 400%, reflecting massive infrastructure investment. This technological democratization enables businesses to deliver hyper-personalized customer experiences at scale.
  • For instance, some firms have deployed conversational AI agents that manage the equivalent workload of 700 full-time employees.
  • This proven ROI, coupled with a 25% reduction in repeat inquiries in certain implementations, creates a compelling business case for integrating advanced natural language generation and text summarization capabilities into core operations.

What are the market trends shaping the AI In Natural Language Processing Industry?

  • The proliferation of enterprise-grade generative AI represents a defining market trend. It is fueled by the widespread availability and adoption of powerful large language models across industries.

  • The market is rapidly advancing toward multimodal AI systems, converging natural language understanding with computer vision and speech processing. This trend enables a new class of enterprise-grade AI applications that interpret varied data inputs, with adoption rates in some sectors increasing by over 40% year-over-year.
  • The focus on AI ethics is also intensifying, as the EU's AI Act imposes stringent transparency requirements on high-risk systems, compelling developers to prioritize AI model governance. Consequently, there is a growing demand for explainable AI and tools for mitigating algorithmic bias.
  • This shift is highlighted by the formation of industry groups dedicated to AI safety research, demonstrating that trustworthiness has become a primary driver of adoption, with a 15% rise in enterprise spending on compliance-related tools.

What challenges does the AI In Natural Language Processing Industry face during its growth?

  • Prohibitive computational costs and a substantial environmental impact present a key challenge that constrains limitless industry growth and development.

  • A formidable market challenge is the prohibitive computational cost and environmental impact of training large-scale deep learning models. The expense for a single training run for a frontier model can exceed one hundred million dollars, creating a significant financial barrier. This concentrates development power among a few well-funded entities.
  • Furthermore, the industry's environmental footprint is a growing concern, as data center electricity consumption is projected to double by 2026. These factors force difficult trade-offs between model capability and sustainability, with resource-intensive transformer architectures driving up both financial and energy demands.
  • The need for AI ethics and responsible development adds another layer of complexity, demanding investment in frameworks to manage model decision making and ensure fairness.

Exclusive Technavio Analysis on Customer Landscape

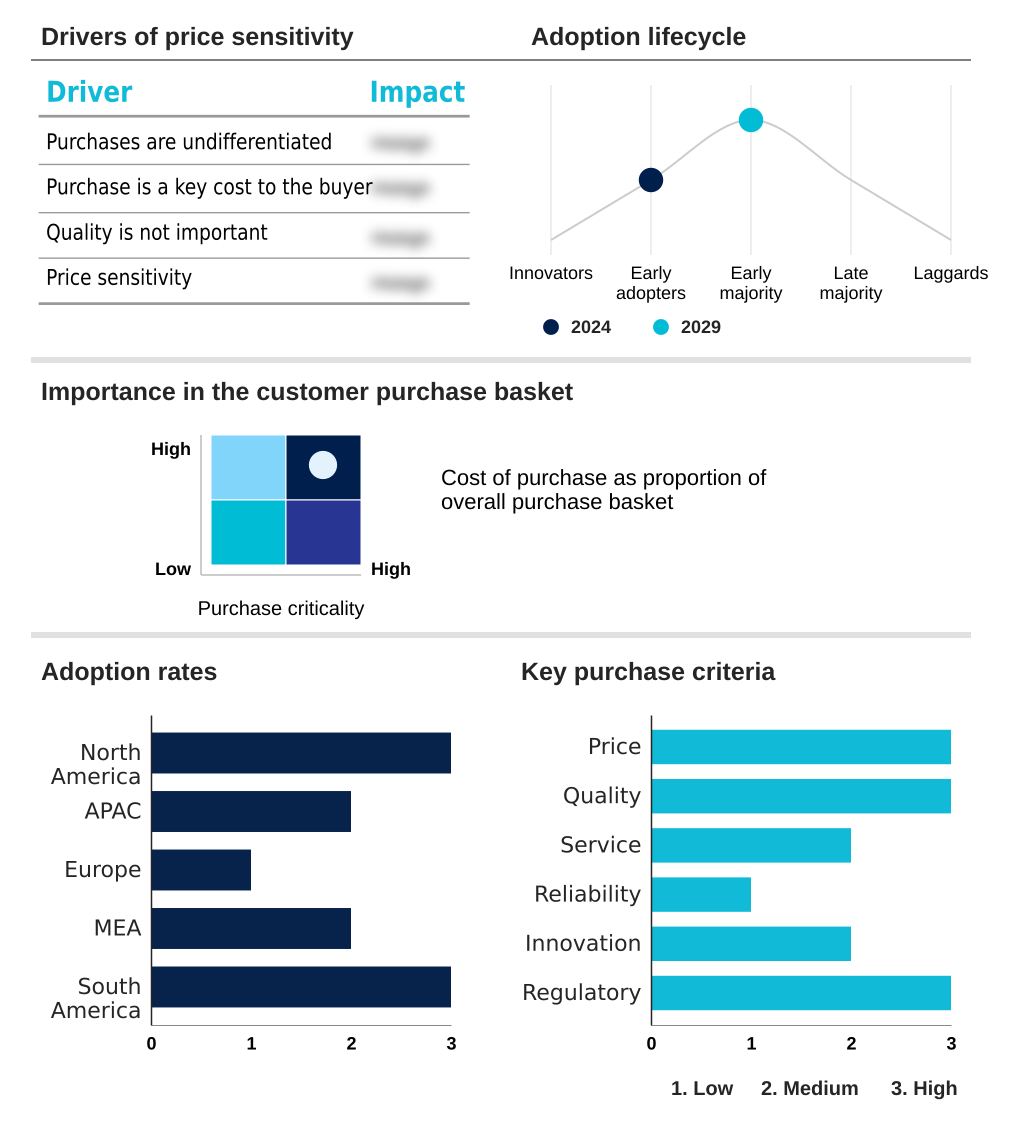
The ai in natural language processing market forecasting report includes the adoption lifecycle of the market, covering from the innovator’s stage to the laggard’s stage. It focuses on adoption rates in different regions based on penetration. Furthermore, the ai in natural language processing market report also includes key purchase criteria and drivers of price sensitivity to help companies evaluate and develop their market growth analysis strategies.

Customer Landscape of AI In Natural Language Processing Industry

Competitive Landscape

Companies are implementing various strategies, such as strategic alliances, ai in natural language processing market forecast, partnerships, mergers and acquisitions, geographical expansion, and product/service launches, to enhance their presence in the industry.

Amazon Web Services Inc. - Provides a comprehensive suite of managed cloud services, enabling developers to build and scale sophisticated AI in NLP applications with enhanced efficiency and reliability.

The industry research and growth report includes detailed analyses of the competitive landscape of the market and information about key companies, including:

  • Amazon Web Services Inc.
  • Anthropic
  • Baidu Inc.
  • C3.ai Inc.
  • Databricks Inc.
  • Dataiku Inc.
  • Google LLC
  • Hugging Face
  • IBM Corp.
  • Meta Platforms Inc.
  • Microsoft Corp.
  • NICE Ltd.
  • Oracle Corp.
  • Palantir Technologies Inc.
  • Salesforce Inc.
  • SAP SE
  • SAS Institute Inc.
  • Snowflake Inc.
  • Verint Systems Inc.

Qualitative and quantitative analysis of companies has been conducted to help clients understand the wider business environment as well as the strengths and weaknesses of key industry players. Data is qualitatively analyzed to categorize companies as pure play, category-focused, industry-focused, and diversified; it is quantitatively analyzed to categorize companies as dominant, leading, strong, tentative, and weak.

Recent Development and News in Ai in natural language processing market

  • In May 2025, OpenAI launched its flagship model GPT-4o, designed for natively multimodal input and output, which can engage in real-time spoken conversations and interpret live video feeds.
  • In April 2025, Meta Platforms Inc. released Llama 3, its next-generation open-source large language model, making powerful, state-of-the-art AI freely available for commercial and research use to foster innovation.
  • In March 2025, Anthropic released its Claude 3 model family, explicitly targeting the enterprise market by emphasizing performance on complex analytical tasks, speed, and a commitment to AI safety.
  • In September 2024, Amazon Web Services Inc. announced the general availability of Amazon Bedrock, a platform providing access to a wide choice of foundation models from leading AI companies through a single API.

Dive into Technavio’s robust research methodology, blending expert interviews, extensive data synthesis, and validated models for unparalleled AI In Natural Language Processing Market insights. See full methodology.

Market Scope
Page number 322
Base year 2024
Historic period 2019-2023
Forecast period 2025-2029
Growth momentum & CAGR Accelerate at a CAGR of 35.2%
Market growth 2025-2029 USD 38322.4 million
Market structure Fragmented
YoY growth 2024-2025(%) 32.9%
Key countries US, Canada, Mexico, China, Japan, India, South Korea, Australia, Indonesia, Germany, UK, France, Italy, Spain, The Netherlands, South Africa, UAE, Saudi Arabia, Israel, Turkey, Brazil, Argentina and Colombia
Competitive landscape Leading Companies, Market Positioning of Companies, Competitive Strategies, and Industry Risks

Request Free Sample

Research Analyst Overview

  • The AI in natural language processing market is advancing at an unprecedented pace, driven by innovations in generative AI and large language models. The underlying technology, rooted in transformer architectures, deep learning models, and neural networks, has enabled breakthroughs in natural language understanding, text generation, and machine translation.
  • Foundational techniques like contextual embeddings, attention mechanisms, and word vector representations are continually refined. Capabilities such as sentiment analysis, semantic analysis, and named entity recognition are now standard, while advanced processes like retrieval augmented generation and fine-tuning allow for high degrees of customization. The evolution includes zero-shot learning and few-shot learning, reducing data dependency.
  • For boardroom consideration, the rise of AI model governance and the need to address algorithmic bias are paramount for compliance and risk management, directly impacting brand reputation. Enterprises are deploying these systems at scale, with some achieving significant operational efficiencies, such as automating two-thirds of customer interactions.
  • Core processes like tokenization, part-of-speech tagging, and coreference resolution, alongside language modeling and text classification using knowledge graphs and latent semantic indexing, underpin these powerful sequence-to-sequence models and their natural language generation capabilities, with explainable AI becoming a critical requirement for enterprise adoption.

What are the Key Data Covered in this AI In Natural Language Processing Market Research and Growth Report?

  • What is the expected growth of the AI In Natural Language Processing Market between 2025 and 2029?

    • USD 38.32 billion, at a CAGR of 35.2%

  • What segmentation does the market report cover?

    • The report is segmented by Component (Solutions, and Services), Application (Virtual assistants and chatbots, Customer experience management, Sentiment analysis, and Social media monitoring), End-user (IT and telecommunication, BFSI, Healthcare, Retail, and Others) and Geography (North America, APAC, Europe, Middle East and Africa, South America)

  • Which regions are analyzed in the report?

    • North America, APAC, Europe, Middle East and Africa and South America

  • What are the key growth drivers and market challenges?

    • Proliferation and democratization of generative AI and large language models, Prohibitive computational costs and substantial environmental impact

  • Who are the major players in the AI In Natural Language Processing Market?

    • Amazon Web Services Inc., Anthropic, Baidu Inc., C3.ai Inc., Databricks Inc., Dataiku Inc., Google LLC, Hugging Face, IBM Corp., Meta Platforms Inc., Microsoft Corp., NICE Ltd., Oracle Corp., Palantir Technologies Inc., Salesforce Inc., SAP SE, SAS Institute Inc., Snowflake Inc. and Verint Systems Inc.

Market Research Insights

  • Market dynamics are shaped by the drive for hyper-personalized customer experiences and intelligent process automation, enabled by enterprise-grade AI. The adoption of conversational AI agents is accelerating, with some platforms handling the equivalent workload of 700 full-time agents and reducing repeat customer inquiries by 25%. This efficiency is powered by innovations in prompt engineering, advanced data analytics, and MLOps for NLP.
  • As organizations build data-driven enterprises, they leverage domain-specific solutions for knowledge-based workflows and automated content creation. The model-as-a-service paradigm, central to human-computer interaction, is supported by AI governance frameworks to ensure regulatory compliance and AI ethics. Key technologies include voice synthesis, text-to-video generation, and ambient clinical intelligence, all of which benefit from AI safety research and privacy-preserving techniques.
  • AI-powered assistants and code generation assistants are becoming standard, while the use of AIOps and human-in-the-loop systems with robust data annotation refines model decision-making from unstructured text data, offering real-time language translation and sophisticated opinion mining.

We can help! Our analysts can customize this ai in natural language processing market research report to meet your requirements.

Get in touch

1. Executive Summary

1.1 Market overview

Executive Summary - Chart on Market Overview
Executive Summary - Data Table on Market Overview
Executive Summary - Chart on Global Market Characteristics
Executive Summary - Chart on Market by Geography
Executive Summary - Chart on Market Segmentation by Component
Executive Summary - Chart on Market Segmentation by Application
Executive Summary - Chart on Market Segmentation by End-user
Executive Summary - Chart on Incremental Growth
Executive Summary - Data Table on Incremental Growth
Executive Summary - Chart on Company Market Positioning

2. Technavio Analysis

2.1 Analysis of price sensitivity, lifecycle, customer purchase basket, adoption rates, and purchase criteria

2.2 Criticality of inputs and Factors of differentiation

Chart on Overview on criticality of inputs and factors of differentiation

2.3 Factors of disruption

Chart on Overview on factors of disruption

2.4 Impact of drivers and challenges

Chart on Impact of drivers and challenges in 2024 and 2029

3. Market Landscape

3.1 Market ecosystem

Chart on Parent Market
Data Table on - Parent Market

3.2 Market characteristics

Chart on Market characteristics analysis

3.3 Value chain analysis

Chart on Value chain analysis

4. Market Sizing

4.1 Market definition

Data Table on Offerings of companies included in the market definition

4.2 Market segment analysis

Market segments

4.3 Market size 2024

4.4 Market outlook: Forecast for 2024-2029

Chart on Global - Market size and forecast 2024-2029 ($ million)
Data Table on Global - Market size and forecast 2024-2029 ($ million)
Chart on Global Market: Year-over-year growth 2024-2029 (%)
Data Table on Global Market: Year-over-year growth 2024-2029 (%)

5. Historic Market Size

5.1 Global AI In Natural Language Processing Market 2019 - 2023

Historic Market Size - Data Table on Global AI In Natural Language Processing Market 2019 - 2023 ($ million)

5.2 Component segment analysis 2019 - 2023

Historic Market Size - Component Segment 2019 - 2023 ($ million)

5.3 Application segment analysis 2019 - 2023

Historic Market Size - Application Segment 2019 - 2023 ($ million)

5.4 End-user segment analysis 2019 - 2023

Historic Market Size - End-user Segment 2019 - 2023 ($ million)

5.5 Geography segment analysis 2019 - 2023

Historic Market Size - Geography Segment 2019 - 2023 ($ million)

5.6 Country segment analysis 2019 - 2023

Historic Market Size - Country Segment 2019 - 2023 ($ million)

6. Qualitative Analysis

6.1

7. Five Forces Analysis

7.1 Five forces summary

Five forces analysis - Comparison between 2024 and 2029

7.2 Bargaining power of buyers

Bargaining power of buyers - Impact of key factors 2024 and 2029

7.3 Bargaining power of suppliers

Bargaining power of suppliers - Impact of key factors in 2024 and 2029

7.4 Threat of new entrants

Threat of new entrants - Impact of key factors in 2024 and 2029

7.5 Threat of substitutes

Threat of substitutes - Impact of key factors in 2024 and 2029

7.6 Threat of rivalry

Threat of rivalry - Impact of key factors in 2024 and 2029

7.7 Market condition

Chart on Market condition - Five forces 2024 and 2029

8. Market Segmentation by Component

8.1 Market segments

Chart on Component - Market share 2024-2029 (%)
Data Table on Component - Market share 2024-2029 (%)

8.2 Comparison by Component

Chart on Comparison by Component
Data Table on Comparison by Component

8.3 Solutions - Market size and forecast 2024-2029

Chart on Solutions - Market size and forecast 2024-2029 ($ million)
Data Table on Solutions - Market size and forecast 2024-2029 ($ million)
Chart on Solutions - Year-over-year growth 2024-2029 (%)
Data Table on Solutions - Year-over-year growth 2024-2029 (%)

8.4 Services - Market size and forecast 2024-2029

Chart on Services - Market size and forecast 2024-2029 ($ million)
Data Table on Services - Market size and forecast 2024-2029 ($ million)
Chart on Services - Year-over-year growth 2024-2029 (%)
Data Table on Services - Year-over-year growth 2024-2029 (%)

8.5 Market opportunity by Component

Market opportunity by Component ($ million)
Data Table on Market opportunity by Component ($ million)

9. Market Segmentation by Application

9.1 Market segments

Chart on Application - Market share 2024-2029 (%)
Data Table on Application - Market share 2024-2029 (%)

9.2 Comparison by Application

Chart on Comparison by Application
Data Table on Comparison by Application

9.3 Virtual assistants and chatbots - Market size and forecast 2024-2029

Chart on Virtual assistants and chatbots - Market size and forecast 2024-2029 ($ million)
Data Table on Virtual assistants and chatbots - Market size and forecast 2024-2029 ($ million)
Chart on Virtual assistants and chatbots - Year-over-year growth 2024-2029 (%)
Data Table on Virtual assistants and chatbots - Year-over-year growth 2024-2029 (%)

9.4 Customer experience management - Market size and forecast 2024-2029

Chart on Customer experience management - Market size and forecast 2024-2029 ($ million)
Data Table on Customer experience management - Market size and forecast 2024-2029 ($ million)
Chart on Customer experience management - Year-over-year growth 2024-2029 (%)
Data Table on Customer experience management - Year-over-year growth 2024-2029 (%)

9.5 Sentiment analysis - Market size and forecast 2024-2029

Chart on Sentiment analysis - Market size and forecast 2024-2029 ($ million)
Data Table on Sentiment analysis - Market size and forecast 2024-2029 ($ million)
Chart on Sentiment analysis - Year-over-year growth 2024-2029 (%)
Data Table on Sentiment analysis - Year-over-year growth 2024-2029 (%)

9.6 Social media monitoring - Market size and forecast 2024-2029

Chart on Social media monitoring - Market size and forecast 2024-2029 ($ million)
Data Table on Social media monitoring - Market size and forecast 2024-2029 ($ million)
Chart on Social media monitoring - Year-over-year growth 2024-2029 (%)
Data Table on Social media monitoring - Year-over-year growth 2024-2029 (%)

9.7 Market opportunity by Application

Market opportunity by Application ($ million)
Data Table on Market opportunity by Application ($ million)

10. Market Segmentation by End-user

10.1 Market segments

Chart on End-user - Market share 2024-2029 (%)
Data Table on End-user - Market share 2024-2029 (%)

10.2 Comparison by End-user

Chart on Comparison by End-user
Data Table on Comparison by End-user

10.3 IT and telecommunication - Market size and forecast 2024-2029

Chart on IT and telecommunication - Market size and forecast 2024-2029 ($ million)
Data Table on IT and telecommunication - Market size and forecast 2024-2029 ($ million)
Chart on IT and telecommunication - Year-over-year growth 2024-2029 (%)
Data Table on IT and telecommunication - Year-over-year growth 2024-2029 (%)

10.4 BFSI - Market size and forecast 2024-2029

Chart on BFSI - Market size and forecast 2024-2029 ($ million)
Data Table on BFSI - Market size and forecast 2024-2029 ($ million)
Chart on BFSI - Year-over-year growth 2024-2029 (%)
Data Table on BFSI - Year-over-year growth 2024-2029 (%)

10.5 Healthcare - Market size and forecast 2024-2029

Chart on Healthcare - Market size and forecast 2024-2029 ($ million)
Data Table on Healthcare - Market size and forecast 2024-2029 ($ million)
Chart on Healthcare - Year-over-year growth 2024-2029 (%)
Data Table on Healthcare - Year-over-year growth 2024-2029 (%)

10.6 Retail - Market size and forecast 2024-2029

Chart on Retail - Market size and forecast 2024-2029 ($ million)
Data Table on Retail - Market size and forecast 2024-2029 ($ million)
Chart on Retail - Year-over-year growth 2024-2029 (%)
Data Table on Retail - Year-over-year growth 2024-2029 (%)

10.7 Others - Market size and forecast 2024-2029

Chart on Others - Market size and forecast 2024-2029 ($ million)
Data Table on Others - Market size and forecast 2024-2029 ($ million)
Chart on Others - Year-over-year growth 2024-2029 (%)
Data Table on Others - Year-over-year growth 2024-2029 (%)

10.8 Market opportunity by End-user

Market opportunity by End-user ($ million)
Data Table on Market opportunity by End-user ($ million)

11. Customer Landscape

11.1 Customer landscape overview

Analysis of price sensitivity, lifecycle, customer purchase basket, adoption rates, and purchase criteria

12. Geographic Landscape

12.1 Geographic segmentation

Chart on Market share by geography 2024-2029 (%)
Data Table on Market share by geography 2024-2029 (%)

12.2 Geographic comparison

Chart on Geographic comparison
Data Table on Geographic comparison

12.3 North America - Market size and forecast 2024-2029

Chart on North America - Market size and forecast 2024-2029 ($ million)
Data Table on North America - Market size and forecast 2024-2029 ($ million)
Chart on North America - Year-over-year growth 2024-2029 (%)
Data Table on North America - Year-over-year growth 2024-2029 (%)
Chart on Regional Comparison - North America
Data Table on Regional Comparison - North America

12.3.1 US - Market size and forecast 2024-2029

Chart on US - Market size and forecast 2024-2029 ($ million)
Data Table on US - Market size and forecast 2024-2029 ($ million)
Chart on US - Year-over-year growth 2024-2029 (%)
Data Table on US - Year-over-year growth 2024-2029 (%)

12.3.2 Canada - Market size and forecast 2024-2029

Chart on Canada - Market size and forecast 2024-2029 ($ million)
Data Table on Canada - Market size and forecast 2024-2029 ($ million)
Chart on Canada - Year-over-year growth 2024-2029 (%)
Data Table on Canada - Year-over-year growth 2024-2029 (%)

12.3.3 Mexico - Market size and forecast 2024-2029

Chart on Mexico - Market size and forecast 2024-2029 ($ million)
Data Table on Mexico - Market size and forecast 2024-2029 ($ million)
Chart on Mexico - Year-over-year growth 2024-2029 (%)
Data Table on Mexico - Year-over-year growth 2024-2029 (%)

12.4 APAC - Market size and forecast 2024-2029

Chart on APAC - Market size and forecast 2024-2029 ($ million)
Data Table on APAC - Market size and forecast 2024-2029 ($ million)
Chart on APAC - Year-over-year growth 2024-2029 (%)
Data Table on APAC - Year-over-year growth 2024-2029 (%)
Chart on Regional Comparison - APAC
Data Table on Regional Comparison - APAC

12.4.1 China - Market size and forecast 2024-2029

Chart on China - Market size and forecast 2024-2029 ($ million)
Data Table on China - Market size and forecast 2024-2029 ($ million)
Chart on China - Year-over-year growth 2024-2029 (%)
Data Table on China - Year-over-year growth 2024-2029 (%)

12.4.2 Japan - Market size and forecast 2024-2029

Chart on Japan - Market size and forecast 2024-2029 ($ million)
Data Table on Japan - Market size and forecast 2024-2029 ($ million)
Chart on Japan - Year-over-year growth 2024-2029 (%)
Data Table on Japan - Year-over-year growth 2024-2029 (%)

12.4.3 India - Market size and forecast 2024-2029

Chart on India - Market size and forecast 2024-2029 ($ million)
Data Table on India - Market size and forecast 2024-2029 ($ million)
Chart on India - Year-over-year growth 2024-2029 (%)
Data Table on India - Year-over-year growth 2024-2029 (%)

12.4.4 South Korea - Market size and forecast 2024-2029

Chart on South Korea - Market size and forecast 2024-2029 ($ million)
Data Table on South Korea - Market size and forecast 2024-2029 ($ million)
Chart on South Korea - Year-over-year growth 2024-2029 (%)
Data Table on South Korea - Year-over-year growth 2024-2029 (%)

12.4.5 Australia - Market size and forecast 2024-2029

Chart on Australia - Market size and forecast 2024-2029 ($ million)
Data Table on Australia - Market size and forecast 2024-2029 ($ million)
Chart on Australia - Year-over-year growth 2024-2029 (%)
Data Table on Australia - Year-over-year growth 2024-2029 (%)

12.4.6 Indonesia - Market size and forecast 2024-2029

Chart on Indonesia - Market size and forecast 2024-2029 ($ million)
Data Table on Indonesia - Market size and forecast 2024-2029 ($ million)
Chart on Indonesia - Year-over-year growth 2024-2029 (%)
Data Table on Indonesia - Year-over-year growth 2024-2029 (%)

12.5 Europe - Market size and forecast 2024-2029

Chart on Europe - Market size and forecast 2024-2029 ($ million)
Data Table on Europe - Market size and forecast 2024-2029 ($ million)
Chart on Europe - Year-over-year growth 2024-2029 (%)
Data Table on Europe - Year-over-year growth 2024-2029 (%)
Chart on Regional Comparison - Europe
Data Table on Regional Comparison - Europe

12.5.1 Germany - Market size and forecast 2024-2029

Chart on Germany - Market size and forecast 2024-2029 ($ million)
Data Table on Germany - Market size and forecast 2024-2029 ($ million)
Chart on Germany - Year-over-year growth 2024-2029 (%)
Data Table on Germany - Year-over-year growth 2024-2029 (%)

12.5.2 UK - Market size and forecast 2024-2029

Chart on UK - Market size and forecast 2024-2029 ($ million)
Data Table on UK - Market size and forecast 2024-2029 ($ million)
Chart on UK - Year-over-year growth 2024-2029 (%)
Data Table on UK - Year-over-year growth 2024-2029 (%)

12.5.3 France - Market size and forecast 2024-2029

Chart on France - Market size and forecast 2024-2029 ($ million)
Data Table on France - Market size and forecast 2024-2029 ($ million)
Chart on France - Year-over-year growth 2024-2029 (%)
Data Table on France - Year-over-year growth 2024-2029 (%)

12.5.4 Italy - Market size and forecast 2024-2029

Chart on Italy - Market size and forecast 2024-2029 ($ million)
Data Table on Italy - Market size and forecast 2024-2029 ($ million)
Chart on Italy - Year-over-year growth 2024-2029 (%)
Data Table on Italy - Year-over-year growth 2024-2029 (%)

12.5.5 Spain - Market size and forecast 2024-2029

Chart on Spain - Market size and forecast 2024-2029 ($ million)
Data Table on Spain - Market size and forecast 2024-2029 ($ million)
Chart on Spain - Year-over-year growth 2024-2029 (%)
Data Table on Spain - Year-over-year growth 2024-2029 (%)

12.5.6 The Netherlands - Market size and forecast 2024-2029

Chart on The Netherlands - Market size and forecast 2024-2029 ($ million)
Data Table on The Netherlands - Market size and forecast 2024-2029 ($ million)
Chart on The Netherlands - Year-over-year growth 2024-2029 (%)
Data Table on The Netherlands - Year-over-year growth 2024-2029 (%)

12.6 Middle East and Africa - Market size and forecast 2024-2029

Chart on Middle East and Africa - Market size and forecast 2024-2029 ($ million)
Data Table on Middle East and Africa - Market size and forecast 2024-2029 ($ million)
Chart on Middle East and Africa - Year-over-year growth 2024-2029 (%)
Data Table on Middle East and Africa - Year-over-year growth 2024-2029 (%)
Chart on Regional Comparison - Middle East and Africa
Data Table on Regional Comparison - Middle East and Africa

12.6.1 South Africa - Market size and forecast 2024-2029

Chart on South Africa - Market size and forecast 2024-2029 ($ million)
Data Table on South Africa - Market size and forecast 2024-2029 ($ million)
Chart on South Africa - Year-over-year growth 2024-2029 (%)
Data Table on South Africa - Year-over-year growth 2024-2029 (%)

12.6.2 UAE - Market size and forecast 2024-2029

Chart on UAE - Market size and forecast 2024-2029 ($ million)
Data Table on UAE - Market size and forecast 2024-2029 ($ million)
Chart on UAE - Year-over-year growth 2024-2029 (%)
Data Table on UAE - Year-over-year growth 2024-2029 (%)

12.6.3 Saudi Arabia - Market size and forecast 2024-2029

Chart on Saudi Arabia - Market size and forecast 2024-2029 ($ million)
Data Table on Saudi Arabia - Market size and forecast 2024-2029 ($ million)
Chart on Saudi Arabia - Year-over-year growth 2024-2029 (%)
Data Table on Saudi Arabia - Year-over-year growth 2024-2029 (%)

12.6.4 Israel - Market size and forecast 2024-2029

Chart on Israel - Market size and forecast 2024-2029 ($ million)
Data Table on Israel - Market size and forecast 2024-2029 ($ million)
Chart on Israel - Year-over-year growth 2024-2029 (%)
Data Table on Israel - Year-over-year growth 2024-2029 (%)

12.6.5 Turkey - Market size and forecast 2024-2029

Chart on Turkey - Market size and forecast 2024-2029 ($ million)
Data Table on Turkey - Market size and forecast 2024-2029 ($ million)
Chart on Turkey - Year-over-year growth 2024-2029 (%)
Data Table on Turkey - Year-over-year growth 2024-2029 (%)

12.7 South America - Market size and forecast 2024-2029

Chart on South America - Market size and forecast 2024-2029 ($ million)
Data Table on South America - Market size and forecast 2024-2029 ($ million)
Chart on South America - Year-over-year growth 2024-2029 (%)
Data Table on South America - Year-over-year growth 2024-2029 (%)
Chart on Regional Comparison - South America
Data Table on Regional Comparison - South America

12.7.1 Brazil - Market size and forecast 2024-2029

Chart on Brazil - Market size and forecast 2024-2029 ($ million)
Data Table on Brazil - Market size and forecast 2024-2029 ($ million)
Chart on Brazil - Year-over-year growth 2024-2029 (%)
Data Table on Brazil - Year-over-year growth 2024-2029 (%)

12.7.2 Argentina - Market size and forecast 2024-2029

Chart on Argentina - Market size and forecast 2024-2029 ($ million)
Data Table on Argentina - Market size and forecast 2024-2029 ($ million)
Chart on Argentina - Year-over-year growth 2024-2029 (%)
Data Table on Argentina - Year-over-year growth 2024-2029 (%)

12.7.3 Colombia - Market size and forecast 2024-2029

Chart on Colombia - Market size and forecast 2024-2029 ($ million)
Data Table on Colombia - Market size and forecast 2024-2029 ($ million)
Chart on Colombia - Year-over-year growth 2024-2029 (%)
Data Table on Colombia - Year-over-year growth 2024-2029 (%)

12.8 Market opportunity by geography

Market opportunity by geography ($ million)
Data Tables on Market opportunity by geography ($ million)

13. Drivers, Challenges, and Opportunity

13.1 Market drivers

Proliferation and democratization of generative AI and large language models
Escalating demand for enhanced customer experiences and hyper personalization
Increasing adoption and accessibility of cloud based NLP services

13.2 Market challenges

Prohibitive computational costs and substantial environmental impact
Concerns regarding data privacy, security, and evolving regulatory landscape
Ethical dilemmas, including algorithmic bias, misinformation, and societal impact

13.3 Impact of drivers and challenges

Impact of drivers and challenges in 2024 and 2029

13.4 Market opportunities

Proliferation of enterprise grade generative AI and large language models
Rise of multimodal AI and convergence of NLP with vision and speech
Intensified focus on responsible AI, governance, and regulatory compliance

14. Competitive Landscape

14.1 Overview

14.2

Overview on criticality of inputs and factors of differentiation

14.3 Landscape disruption

Overview on factors of disruption

14.4 Industry risks

Impact of key risks on business

15. Competitive Analysis

15.1 Companies profiled

Companies covered

15.2 Company ranking index

15.3 Market positioning of companies

Matrix on companies position and classification

15.4 Amazon Web Services Inc.

Amazon Web Services Inc. - Overview
Amazon Web Services Inc. - Product / Service
Amazon Web Services Inc. - Key news
Amazon Web Services Inc. - Key offerings
SWOT

15.5 Anthropic

Anthropic - Overview
Anthropic - Product / Service
Anthropic - Key offerings
SWOT

15.6 Baidu Inc.

Baidu Inc. - Overview
Baidu Inc. - Business segments
Baidu Inc. - Key offerings
Baidu Inc. - Segment focus
SWOT

15.7 Databricks Inc.

Databricks Inc. - Overview
Databricks Inc. - Product / Service
Databricks Inc. - Key offerings
SWOT

15.8 Google LLC

Google LLC - Overview
Google LLC - Product / Service
Google LLC - Key offerings
SWOT

15.9 Hugging Face

Hugging Face - Overview
Hugging Face - Product / Service
Hugging Face - Key offerings
SWOT

15.10 IBM Corp.

IBM Corp. - Overview
IBM Corp. - Business segments
IBM Corp. - Key news
IBM Corp. - Key offerings
IBM Corp. - Segment focus
SWOT

15.11 Meta Platforms Inc.

Meta Platforms Inc. - Overview
Meta Platforms Inc. - Business segments
Meta Platforms Inc. - Key offerings
Meta Platforms Inc. - Segment focus
SWOT

15.12 Microsoft Corp.

Microsoft Corp. - Overview
Microsoft Corp. - Business segments
Microsoft Corp. - Key news
Microsoft Corp. - Key offerings
Microsoft Corp. - Segment focus
SWOT

15.13 Oracle Corp.

Oracle Corp. - Overview
Oracle Corp. - Business segments
Oracle Corp. - Key news
Oracle Corp. - Key offerings
Oracle Corp. - Segment focus
SWOT

15.14 Salesforce Inc.

Salesforce Inc. - Overview
Salesforce Inc. - Product / Service
Salesforce Inc. - Key news
Salesforce Inc. - Key offerings
SWOT

15.15 SAP SE

SAP SE - Overview
SAP SE - Business segments
SAP SE - Key news
SAP SE - Key offerings
SAP SE - Segment focus
SWOT

15.16 SAS Institute Inc.

SAS Institute Inc. - Overview
SAS Institute Inc. - Product / Service
SAS Institute Inc. - Key news
SAS Institute Inc. - Key offerings
SWOT

15.17 Snowflake Inc.

Snowflake Inc. - Overview
Snowflake Inc. - Product / Service
Snowflake Inc. - Key offerings
SWOT

15.18 Verint Systems Inc.

Verint Systems Inc. - Overview
Verint Systems Inc. - Product / Service
Verint Systems Inc. - Key offerings
SWOT

16. Appendix

16.1 Scope of the report

Market definition
Objectives
Notes and caveats

16.2 Inclusions and exclusions checklist

Inclusions checklist
Exclusions checklist

16.3 Currency conversion rates for US$

16.4 Research methodology

16.5 Data procurement

Information sources

16.6 Data validation

16.7 Validation techniques employed for market sizing

16.8 Data synthesis

16.9 360 degree market analysis

16.10 List of abbreviations

Research Methodology

Technavio presents a detailed picture of the market by way of study, synthesis, and summation of data from multiple sources. The analysts have presented the various facets of the market with a particular focus on identifying the key industry influencers. The data thus presented is comprehensive, reliable, and the result of extensive research, both primary and secondary.

INFORMATION SOURCES

Primary sources

  • Manufacturers and suppliers
  • Channel partners
  • Industry experts
  • Strategic decision makers

Secondary sources

  • Industry journals and periodicals
  • Government data
  • Financial reports of key industry players
  • Historical data
  • Press releases

DATA ANALYSIS

Data Synthesis

  • Collation of data
  • Estimation of key figures
  • Analysis of derived insights

Data Validation

  • Triangulation with data models
  • Reference against proprietary databases
  • Corroboration with industry experts

REPORT WRITING

Qualitative

  • Market drivers
  • Market challenges
  • Market trends
  • Five forces analysis

Quantitative

  • Market size and forecast
  • Market segmentation
  • Geographical insights
  • Competitive landscape

Interested in this report?

Get your sample now to see our research methodology and insights!

Download Now

Frequently Asked Questions

AI In Natural Language Processing market growth will increase by USD 38322.4 million during 2025-2029.

The AI In Natural Language Processing market is expected to grow at a CAGR of 35.2% during 2025-2029.

AI In Natural Language Processing market is segmented by Component (Solutions, Services) Application (Virtual assistants and chatbots, Customer experience management, Sentiment analysis, Social media monitoring) End-user (IT and telecommunication, BFSI, Healthcare, Retail, Others)

Amazon Web Services Inc., Anthropic, Baidu Inc., C3.ai Inc., Databricks Inc., Dataiku Inc., Google LLC, Hugging Face, IBM Corp., Meta Platforms Inc., Microsoft Corp., NICE Ltd., Oracle Corp., Palantir Technologies Inc., Salesforce Inc., SAP SE, SAS Institute Inc., Snowflake Inc., Verint Systems Inc. are a few of the key vendors in the AI In Natural Language Processing market.

North America will register the highest growth rate of 36.9% among the other regions. Therefore, the AI In Natural Language Processing market in North America is expected to garner significant business opportunities for the vendors during the forecast period.

US, Canada, Mexico, China, Japan, India, South Korea, Australia, Indonesia, Germany, UK, France, Italy, Spain, The Netherlands, South Africa, UAE, Saudi Arabia, Israel, Turkey, Brazil, Argentina, Colombia

  • Proliferation and democratization of generative AI and large language models is the driving factor this market.

The AI In Natural Language Processing market vendors should focus on grabbing business opportunities from the Component segment as it accounted for the largest market share in the base year.