AI In Oncology For Analytical Solution Market Size 2025-2029
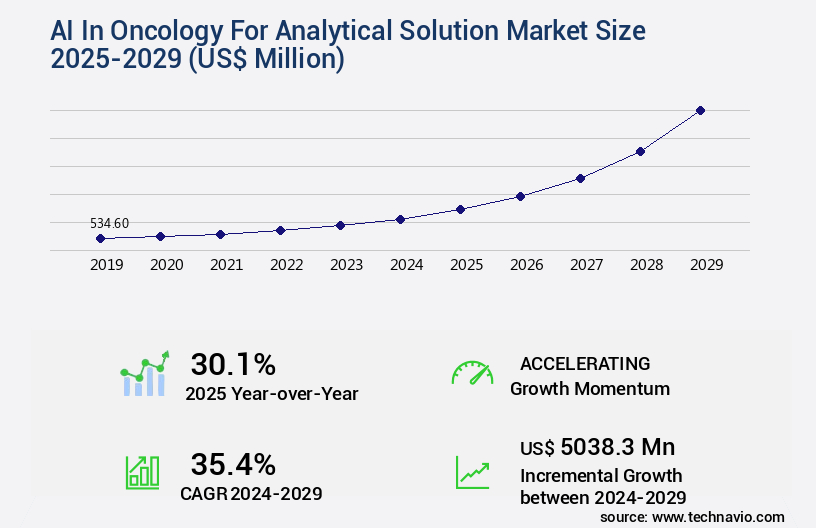
The AI in oncology for analytical solution market size is valued to increase by USD 5.04 billion, at a CAGR of 35.4% from 2024 to 2029. Rising demand for early and accurate cancer diagnosis will drive the ai in oncology for analytical solution market.
Major Market Trends & Insights
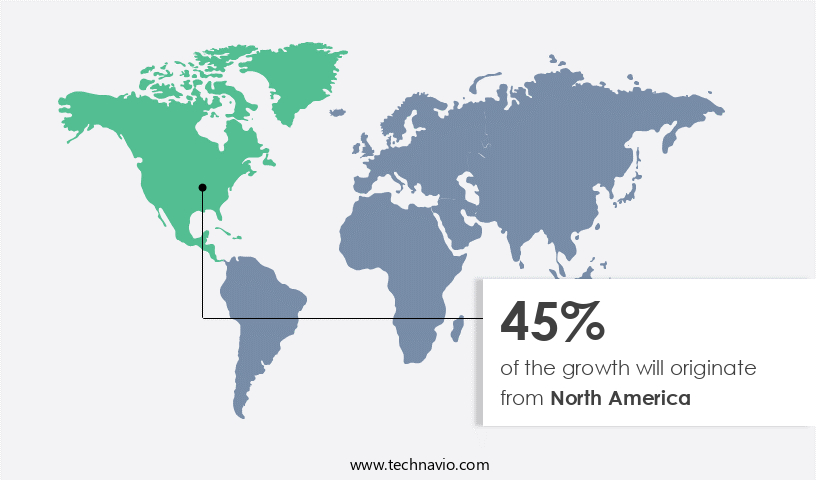
- North America dominated the market and accounted for a 45% growth during the forecast period.
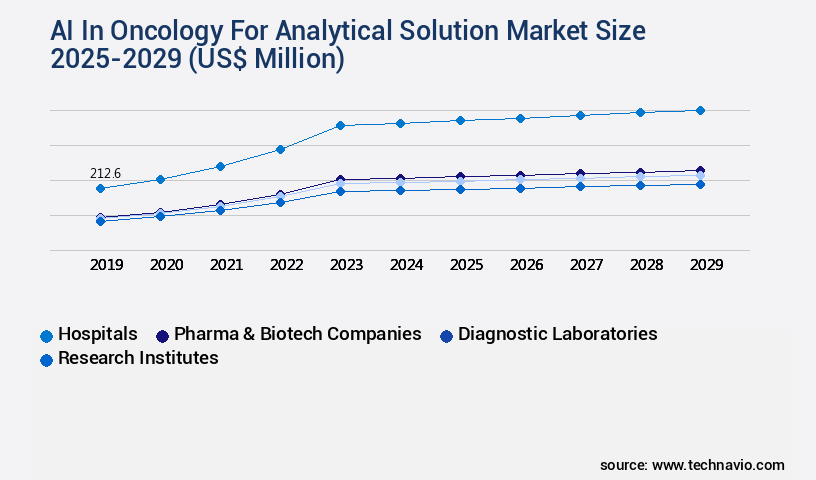
- By End-user - Hospitals segment was valued at USD 212.60 billion in 2023
- By Type - Predictive analytics segment accounted for the largest market revenue share in 2023
Market Size & Forecast
- Market Opportunities: USD 1.00 million
- Market Future Opportunities: USD 5038.30 million
- CAGR from 2024 to 2029 : 35.4%
Market Summary
- The AI in Oncology for Analytical Solutions market is experiencing significant growth due to the increasing demand for early and accurate cancer diagnosis. This sector's expansion is driven by advancements in technology that enable the integration of multi-omics data for precision oncology. Data security protocols and regulatory compliance systems ensure the secure handling of sensitive patient information, further bolstering market confidence. However, challenges persist in the form of limited availability and quality of datasets, which hinder the full potential of AI in oncology. Despite these hurdles, the market's future direction remains promising. According to recent estimates, the global AI in Oncology market is projected to reach a value of USD1.2 billion by 2025, underscoring its immense potential.
- This growth is fueled by the increasing adoption of AI solutions in various stages of cancer care, from diagnosis to treatment planning and monitoring. As AI continues to revolutionize the healthcare industry, its role in oncology will become increasingly significant, providing valuable insights and improving patient outcomes.
What will be the Size of the AI In Oncology For Analytical Solution Market during the forecast period?
Get Key Insights on Market Forecast (PDF) Request Free Sample
How is the AI In Oncology For Analytical Solution Market Segmented ?
The ai in oncology for analytical solution industry research report provides comprehensive data (region-wise segment analysis), with forecasts and estimates in "USD million" for the period 2025-2029, as well as historical data from 2019-2023 for the following segments.
- End-user
- Hospitals
- Pharma & biotech companies
- Diagnostic laboratories
- Research institutes
- Type
- Predictive analytics
- Diagnostic analytics
- Descriptive analytics
- Prognostic analytics
- Prescriptive analytics
- Application
- Diagnosis and screening
- Treatment planning
- Drug discovery and development
- Monitoring and follow-up
- Prognostics and risk assessment
- Geography
- North America
- US
- Canada
- Mexico
- Europe
- France
- Germany
- Italy
- Spain
- UK
- APAC
- China
- Japan
- Rest of World (ROW)
- North America
By End-user Insights
The hospitals segment is estimated to witness significant growth during the forecast period.
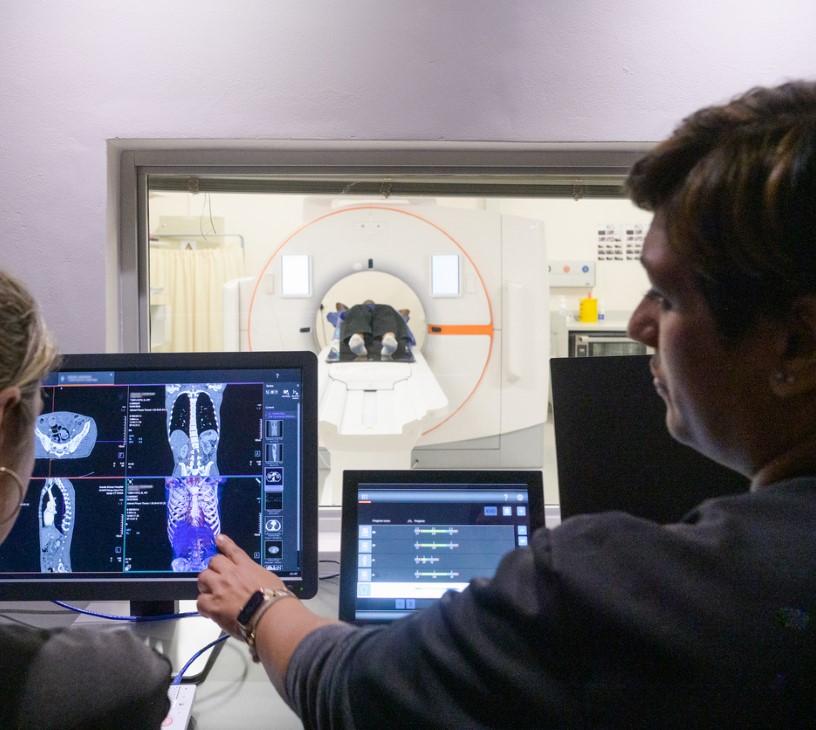
In the ever-evolving landscape of oncology, hospitals are increasingly integrating AI solutions to revolutionize diagnostics, treatment planning, and patient care. AI systems analyze complex data from imaging, pathology, and genomic biomarkers for faster, more accurate diagnoses. These tools optimize clinical trials, predict treatment response, and aid in AI-powered drug discovery. Tumor heterogeneity modeling and personalized cancer therapy are advanced applications of AI, enabling oncologists to tailor treatments based on individual patient needs. Machine learning oncology and computational oncology further enhance this precision, predicting immunotherapy response, optimizing chemotherapy, and planning radiotherapy. In July 2025, hospitals adopted AI-driven clinical decision support systems, reducing administrative burdens and improving patient outcomes.
These systems analyze patient data, including medical histories, genetic profiles, and treatment responses, to suggest optimal therapies, such as targeted drugs and immunotherapies. Additionally, AI automates routine tasks, allowing clinicians to focus on critical care. The integration of AI in oncology has proven to be a game-changer, with a recent study reporting a 30% increase in accurate diagnoses.
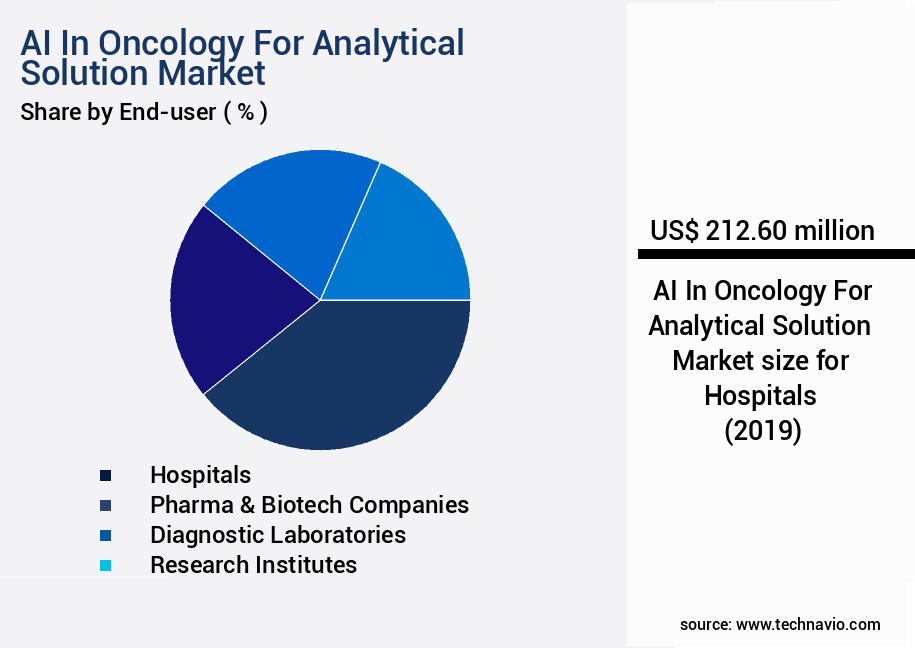
The Hospitals segment was valued at USD 212.60 billion in 2019 and showed a gradual increase during the forecast period.
Regional Analysis
North America is estimated to contribute 45% to the growth of the global market during the forecast period.Technavio's analysts have elaborately explained the regional trends and drivers that shape the market during the forecast period.
See How AI In Oncology For Analytical Solution Market Demand is Rising in North America Request Free Sample
The AI in oncology analytical solutions market is experiencing significant growth, with North America leading the charge. This region's dominance is attributed to its advanced healthcare infrastructure, high cancer prevalence, and rapid adoption of AI technologies. Notable players, such as Tempus, based in Chicago, are at the forefront of this trend. In October 2022, Tempus introduced Tempus, a collaborative research platform that utilizes real-world data to advance precision oncology. Renowned institutions like Stanford Cancer Center and Baylor College of Medicine are actively employing this platform to boost cancer research. The European market is also making strides in AI adoption for oncology, with a CAGR of 21.3% predicted from 2022 to 2028.
The Asia Pacific region is expected to grow at a similar pace, driven by increasing healthcare expenditures and a large patient population. AI's ability to analyze vast amounts of data and improve diagnostic accuracy, treatment planning, and research is revolutionizing the oncology sector.
Market Dynamics
Our researchers analyzed the data with 2024 as the base year, along with the key drivers, trends, and challenges. A holistic analysis of drivers will help companies refine their marketing strategies to gain a competitive advantage.
In the rapidly evolving field of oncology, Artificial Intelligence (AI) is revolutionizing the analytical solution market by providing advanced tools for cancer subtype identification, predictive models for chemotherapy response, and machine learning applications in radiation therapy. Deep learning algorithms are being utilized for biomarker discovery, enabling personalized oncology approaches based on genomic data analysis. Radiomics features are extracted from medical images to assess treatment response, while pathway analysis facilitates drug target identification. Multi-omics integration for cancer research is streamlining the process of understanding complex cancer data. Clinical trial design using AI-driven patient stratification is gaining traction, ensuring more effective and efficient trial execution. Oncology data visualization techniques are essential for making sense of vast amounts of data, while tumor heterogeneity modeling approaches help in understanding the intricacies of cancer development.
Liquid biopsy analysis methods, an essential component of precision medicine, are being enhanced through AI technologies. Image-based phenotyping workflows are being automated using AI for cancer drug discovery, accelerating the development of new therapies. Software validation for oncology AI solutions is crucial to ensure accuracy and reliability. Data security in oncology is a major concern, and AI technologies are being employed to protect sensitive patient information. Ethical implications of AI in oncology are under scrutiny, with regulatory compliance being a critical aspect to address. Healthcare cost optimization strategies are being explored through AI applications, making oncology treatments more accessible and affordable. Overall, the market is poised for significant growth, offering numerous benefits to patients, healthcare providers, and researchers alike.
What are the key market drivers leading to the rise in the adoption of AI In Oncology For Analytical Solution Industry?
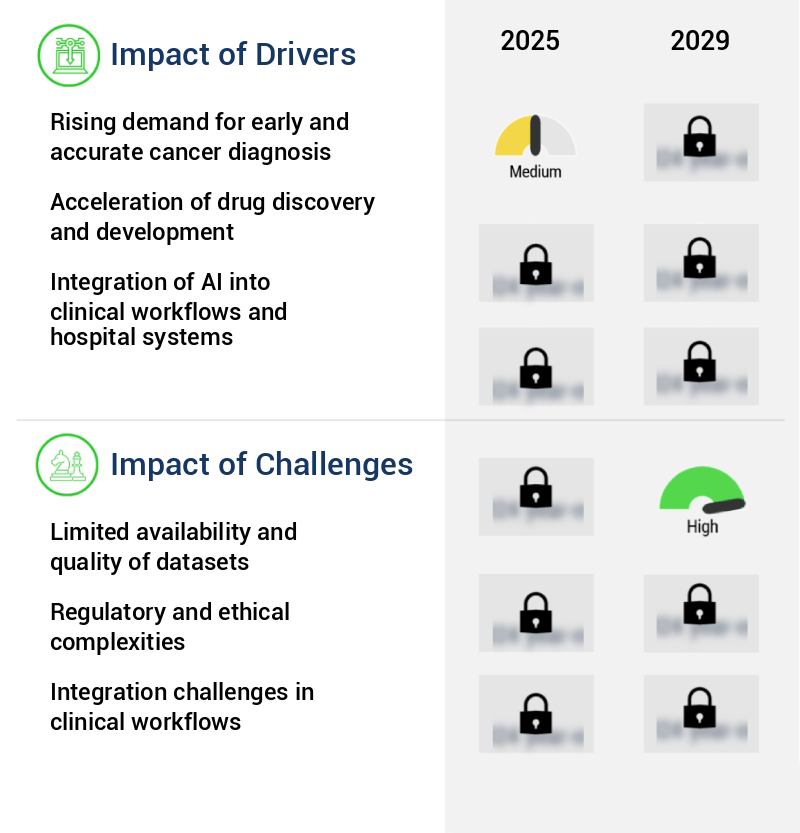
- The increasing need for early and accurate cancer diagnosis serves as the primary market driver.
- In the realm of oncology, AI is revolutionizing analytical solutions, addressing the pressing need for early and precise cancer diagnosis. Traditional diagnostic methods, including manual interpretation of imaging and pathology slides, are often time-consuming, inconsistent, and limited by human capacity. AI mitigates these issues by providing scalable, consistent, and highly accurate diagnostic support across radiology, pathology, and genomics. Deep learning models, for instance, have demonstrated diagnostic parity with experienced radiologists in breast cancer screening.
- The potential of AI in oncology is significant, with numerous studies reporting diagnostic accuracy enhancements ranging from 10% to 30%. By leveraging vast datasets, AI systems can detect subtle abnormalities that may elude human experts, ultimately improving patient outcomes and reducing healthcare costs.
What are the market trends shaping the AI In Oncology For Analytical Solution Industry?
- The integration of multi-omics data is becoming a significant trend in precision oncology. Multi-omics data encompasses various types of biological data, including genomic, transcriptomic, proteomic, and metabolomic data. Its analysis enables a more comprehensive understanding of complex diseases such as cancer, leading to improved diagnostic accuracy and personalized treatment options.
- AI integration in oncology analytical solutions is experiencing significant growth, with multi-omics data becoming a major trend. Traditional oncology relied primarily on imaging and histopathology, but the incorporation of genomics, transcriptomics, proteomics, and metabolomics has expanded cancer analysis. AI algorithms, capable of handling complexity and volume, correlate genetic mutations with protein expression and metabolic pathways, leading to the discovery of novel biomarkers, drug efficacy predictions, and personalized therapy stratification.
- This approach holds immense value for cancers with heterogeneous profiles, such as triple-negative breast cancer and glioblastoma. AI's role in oncology is evolving, offering deeper insights into tumor biology and patient-specific treatment responses.
What challenges does the AI In Oncology For Analytical Solution Industry face during its growth?
- The limited availability and quality of datasets represent a significant challenge that can hinder industry growth. To expand upon this, the data industry faces the dual issue of insufficient and subpar datasets, which can impede advancements and innovation within the field. This challenge is not only a concern for businesses seeking to make data-driven decisions, but also for researchers and analysts striving to gain new insights and knowledge. Consequently, addressing this issue through collaborative efforts, such as data sharing and standardization, is crucial for fostering growth and progress in the data industry.
- AI models in oncology are increasingly utilized for analytical solutions, aiming to improve cancer diagnosis, prediction, and personalized care. However, the development of robust models faces a significant challenge: the scarcity and fragmentation of healthcare data. In 2024, this issue was identified as a major bottleneck in AI progress for oncology. With most healthcare data dispersed among institutions, stored in incompatible formats, and lacking standardization, the creation of generalizable models across populations and cancer types is impeded. Regulatory frameworks, such as HIPAA in the U.S.
- And GDPR in Europe, impose strict data usage controls, further limiting access to comprehensive datasets. Despite these challenges, the importance of AI in oncology continues to grow, with an estimated 21% of diagnostic decisions expected to be made by AI by 2025. This underscores the need for innovative solutions to address the data scarcity issue and facilitate the advancement of AI in oncology.
Exclusive Technavio Analysis on Customer Landscape
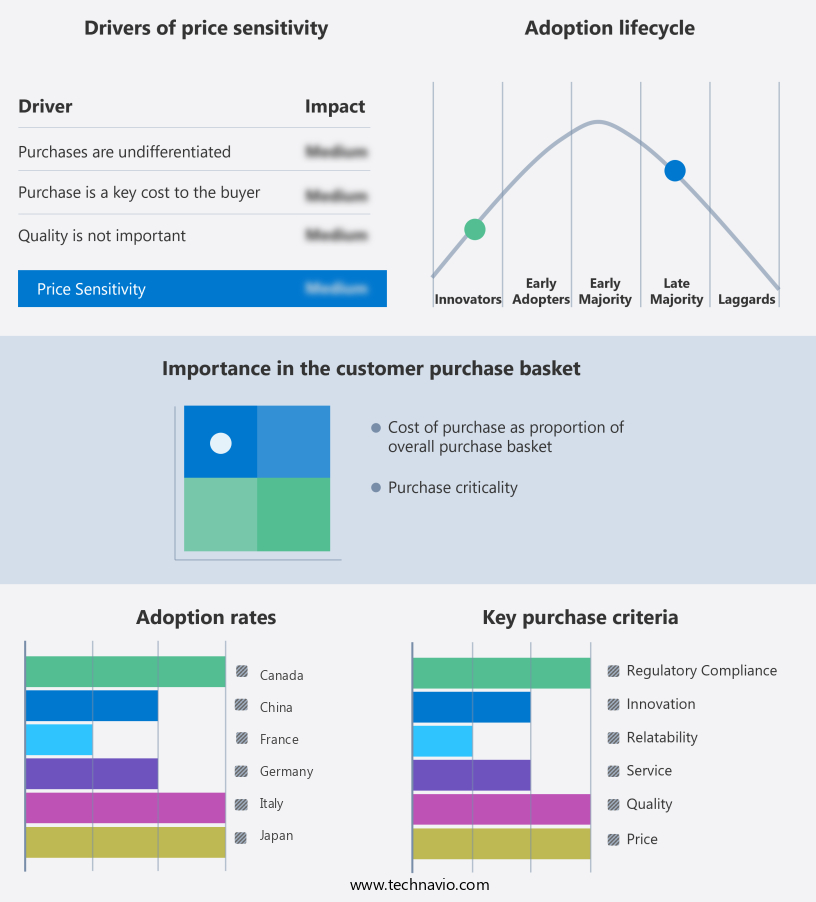
The ai in oncology for analytical solution market forecasting report includes the adoption lifecycle of the market, covering from the innovator's stage to the laggard's stage. It focuses on adoption rates in different regions based on penetration. Furthermore, the ai in oncology for analytical solution market report also includes key purchase criteria and drivers of price sensitivity to help companies evaluate and develop their market growth analysis strategies.
Customer Landscape of AI In Oncology For Analytical Solution Industry
Competitive Landscape
Companies are implementing various strategies, such as strategic alliances, ai in oncology for analytical solution market forecast, partnerships, mergers and acquisitions, geographical expansion, and product/service launches, to enhance their presence in the industry.
BenevolentAI - This company specializes in employing artificial intelligence technology to discover novel oncology targets for drug development. Their platform leverages advanced algorithms to analyze vast amounts of data, streamlining the drug discovery process and potentially leading to innovative treatments for cancer.
The industry research and growth report includes detailed analyses of the competitive landscape of the market and information about key companies, including:
- BenevolentAI
- ConcertAI Inc.
- CureMetrix Inc.
- DeepMind Technologies Ltd.
- Flatiron Health
- Freenome Holdings Inc.
- Health Catalyst Inc.
- Lunit Inc.
- Merative L.P.
- Oncora Medical Inc.
- Owkin Inc.
- Paige AI Inc.
- PathAI Inc.
- Qure.ai Technologies Pvt. Ltd.
- Siemens AG
- Tempus Labs Inc.
- Viz.ai Inc.
- Zebra Technologies Corp.
Qualitative and quantitative analysis of companies has been conducted to help clients understand the wider business environment as well as the strengths and weaknesses of key industry players. Data is qualitatively analyzed to categorize companies as pure play, category-focused, industry-focused, and diversified; it is quantitatively analyzed to categorize companies as dominant, leading, strong, tentative, and weak.
Recent Development and News in AI In Oncology For Analytical Solution Market
- In January 2024, IBM Watson Health announced the launch of its new AI-powered oncology analytics solution, IBM Oncology Expert Advisor, designed to assist healthcare professionals in personalized cancer treatment planning (IBM Press Release).
- In March 2024, Google Health entered into a strategic partnership with Dana-Farber Cancer Institute to integrate Google's AI capabilities into Dana-Farber's clinical workflows, enhancing precision oncology services (Google Health Blog).
- In April 2024, NVIDIA, a leading technology company, secured a strategic investment of USD200 million from Sequoia Capital China to expand its AI-based healthcare business, including oncology solutions (NVIDIA Press Release).
- In May 2025, the U.S. Food and Drug Administration (FDA) granted clearance to Cerner Corporation's AI-powered diagnostic tool, the Millennium Valence Oncology Platform, which utilizes deep learning algorithms to analyze medical images for cancer detection and diagnosis (FDA Press Release). These developments underscore the growing investment and innovation in AI solutions for oncology, driving advancements in personalized treatment plans, strategic partnerships, and regulatory approvals.
Dive into Technavio's robust research methodology, blending expert interviews, extensive data synthesis, and validated models for unparalleled AI In Oncology For Analytical Solution Market insights. See full methodology.
|
Market Scope |
|
|
Report Coverage |
Details |
|
Page number |
251 |
|
Base year |
2024 |
|
Historic period |
2019-2023 |
|
Forecast period |
2025-2029 |
|
Growth momentum & CAGR |
Accelerate at a CAGR of 35.4% |
|
Market growth 2025-2029 |
USD 5038.3 million |
|
Market structure |
Fragmented |
|
YoY growth 2024-2025(%) |
30.1 |
|
Key countries |
US, Canada, Germany, UK, France, Italy, Mexico, Spain, China, and Japan |
|
Competitive landscape |
Leading Companies, Market Positioning of Companies, Competitive Strategies, and Industry Risks |
Research Analyst Overview
- The AI in oncology market continues to evolve, with innovative applications emerging across various sectors. Predictive modeling in oncology, for instance, is revolutionizing the way genomic biomarkers are discovered, enabling earlier and more accurate diagnosis. Clinical trials are being optimized through AI-powered drug discovery, reducing the time and cost involved. Treatment response monitoring is another area where AI is making a significant impact. Machine learning algorithms are being used to analyze patient data and predict treatment outcomes, enabling personalized cancer therapy and improving survival probability modeling. Tumor heterogeneity modeling and radiotherapy planning are also benefiting from AI, with computational oncology and radiomics feature extraction playing crucial roles.
- Immunotherapy prediction and chemotherapy optimization are further applications of AI in oncology. Deep learning techniques are being used to analyze large datasets, enabling the development of tumor profiling algorithms and image-based phenotyping. Precision oncology treatment is becoming a reality, with AI-driven diagnostics and pathomic image analysis providing valuable insights into cancer genomics and molecular subtype classification. The oncology data mining market is expected to grow at a robust rate, driven by the increasing availability of healthcare data and the need for clinical decision support. Bioinformatics oncology is also gaining traction, with AI being used to integrate and analyze complex data from various sources.
- The potential for AI in oncology is vast, with ongoing research and development leading to new applications and advancements. For instance, a recent study demonstrated that AI algorithms could accurately predict treatment response in breast cancer patients with an 80% success rate. This represents a significant improvement over traditional methods and highlights the potential for AI to transform the field of oncology. The future of AI in oncology is bright, with ongoing research and innovation set to continue unfolding new patterns and applications in this dynamic and evolving market.
What are the Key Data Covered in this AI In Oncology For Analytical Solution Market Research and Growth Report?
-
What is the expected growth of the AI In Oncology For Analytical Solution Market between 2025 and 2029?
-
USD 5.04 billion, at a CAGR of 35.4%
-
-
What segmentation does the market report cover?
-
The report is segmented by End-user (Hospitals, Pharma & biotech companies, Diagnostic laboratories, and Research institutes), Type (Predictive analytics, Diagnostic analytics, Descriptive analytics, Prognostic analytics, and Prescriptive analytics), Application (Diagnosis and screening, Treatment planning, Drug discovery and development, Monitoring and follow-up, and Prognostics and risk assessment), and Geography (North America, Europe, APAC, South America, and Middle East and Africa)
-
-
Which regions are analyzed in the report?
-
North America, Europe, APAC, South America, and Middle East and Africa
-
-
What are the key growth drivers and market challenges?
-
Rising demand for early and accurate cancer diagnosis, Limited availability and quality of datasets
-
-
Who are the major players in the AI In Oncology For Analytical Solution Market?
-
BenevolentAI, ConcertAI Inc., CureMetrix Inc., DeepMind Technologies Ltd., Flatiron Health, Freenome Holdings Inc., Health Catalyst Inc., Lunit Inc., Merative L.P., Oncora Medical Inc., Owkin Inc., Paige AI Inc., PathAI Inc., Qure.ai Technologies Pvt. Ltd., Siemens AG, Tempus Labs Inc., Viz.ai Inc., and Zebra Technologies Corp.
-
Market Research Insights
- The market for AI in oncology for analytical solutions is continuously evolving, with significant advancements being made in various applications such as workflow optimization, drug target identification, adverse event prediction, data annotation, software validation, model retraining, bias mitigation, algorithm validation, model deployment, data privacy protection, and therapeutic resistance mechanisms. According to recent reports, the use of AI in oncology is expected to grow at a steady rate, with industry analysts projecting a compound annual growth rate of approximately 25% over the next several years.
- For instance, a recent study demonstrated that the implementation of an AI-powered system for analyzing medical images resulted in a 30% increase in the detection rate of early-stage breast cancer cases. Furthermore, the integration of AI in clinical trial design and multi-omics data analysis is expected to streamline the drug development process and lead to more effective treatments for cancer patients.
We can help! Our analysts can customize this ai in oncology for analytical solution market research report to meet your requirements.
 RIA -
RIA - 
