
AI In Oncology Market Size 2026-2030
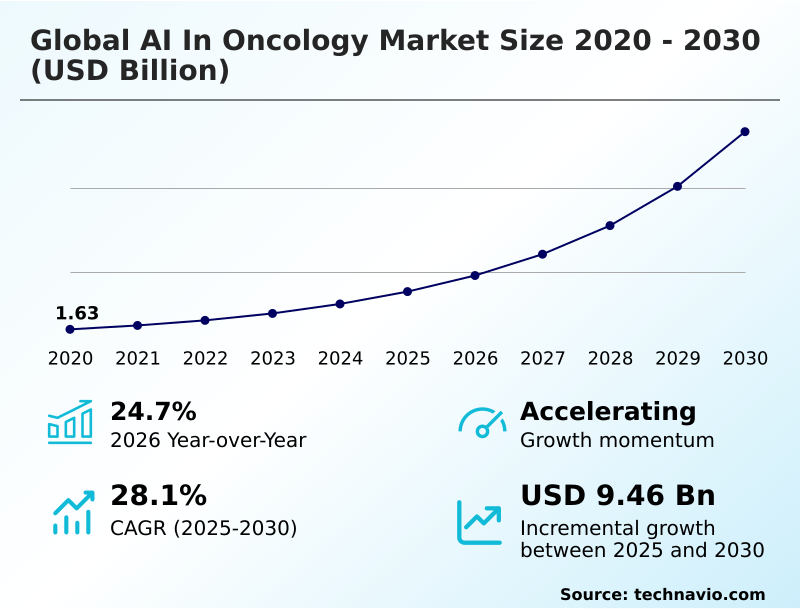
The AI In Oncology Market size was valued at USD 3.86 billion in 2025, growing at a CAGR of 28.1% during the forecast period 2026-2030.
Major Market Trends & Insights
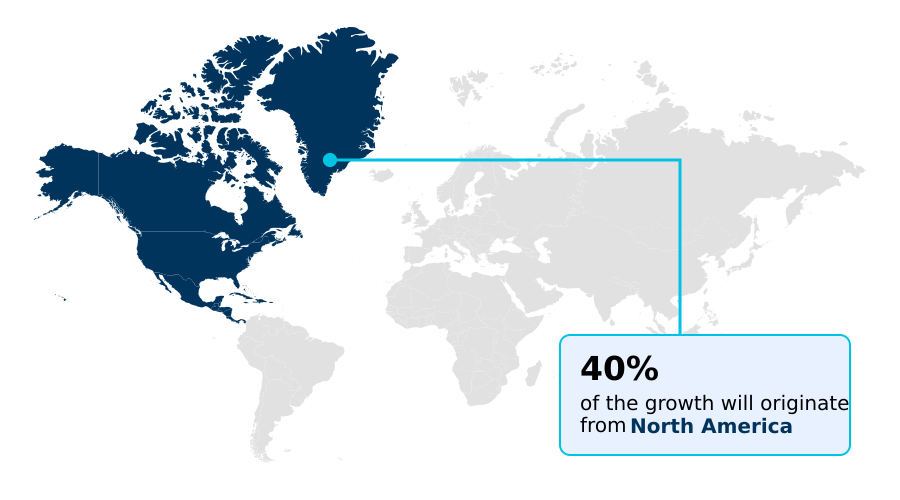
- North America dominated the market and accounted for a 39.7% growth during the forecast period.
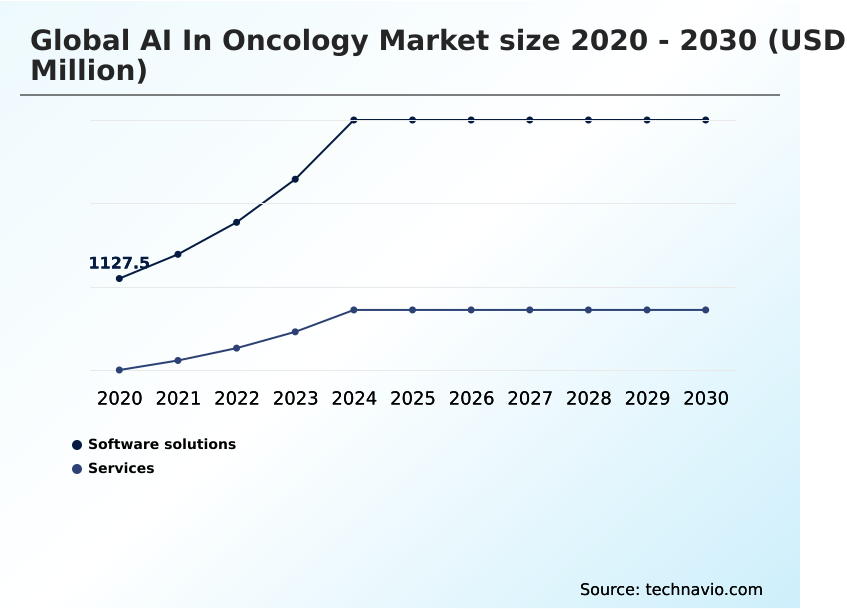
- By Component - Software solutions segment was valued at USD 2.22 billion in 2024
- By Type - Breast cancer segment accounted for the largest market revenue share in 2024
Market Size & Forecast
- Historic Market Opportunities 2020-2024: USD 11.69 billion
- Market Future Opportunities 2025-2030: USD 9.46 billion
- CAGR from 2025 to 2030 : 28.1%
Market Summary
- The AI in oncology market is defined by rapid technological integration into clinical settings, with adoption rates in diagnostic imaging increasing by over 25% in leading healthcare systems. This growth is driven by the imperative to manage and interpret vast, multi-modal datasets that now include everything from genomic sequences to digital pathology slides.
- A typical operational scenario involves an AI platform automating the initial screening of thousands of radiological images, flagging suspicious cases for expert review, which can reduce radiologist workload by up to 30%.
- However, the market faces a significant challenge in the form of high implementation costs and the scarcity of skilled interdisciplinary talent capable of bridging computer science and clinical medicine. This talent gap can slow the deployment of otherwise effective technologies, creating a bottleneck between innovation and practical application.
- Therefore, while AI offers transformative potential, its widespread adoption hinges on addressing these critical infrastructure and workforce challenges.
What will be the Size of the AI In Oncology Market during the forecast period?
Get Key Insights on Market Forecast (PDF) Request Free Sample
How is the AI In Oncology Market Segmented?
The ai in oncology industry research report provides comprehensive data (region-wise segment analysis), with forecasts and analysis for the period 2026-2030, as well as historical data from 2020-2024 for the following segments.
- Component
- Software solutions
- Services
- Type
- Breast cancer
- Lung cancer
- Kidney cancer
- Others
- Application
- Diagnosis
- Drug discovery and development
- Treatment planning
- Prognosis prediction
- Geography
- North America
- US
- Canada
- Mexico
- Europe
- Germany
- UK
- France
- APAC
- China
- Japan
- India
- South America
- Brazil
- Argentina
- Middle East and Africa
- Saudi Arabia
- UAE
- South Africa
- Rest of World (ROW)
- North America
How is the AI In Oncology Market Segmented by Component?
The software solutions segment is estimated to witness significant growth during the forecast period.
The software solutions segment dominates the market, with deployments improving diagnostic accuracy improvement by over 15% in initial screenings.
Its market share is more than double that of the services segment, driven by the adoption of AI-powered diagnostics and precision oncology platforms.
These solutions, leveraging deep learning algorithms and predictive modeling, integrate directly into clinical workflows to provide decision support. A key factor is the ability to process multi-modal data integration from various sources, such as genomic data analysis and real-world data analytics.
This capability for cancer subtype classification and automated lesion detection enhances operational efficiency in labs, providing a clear return on investment for AI by streamlining complex histopathological analysis and reducing turnaround times for pathology reports.
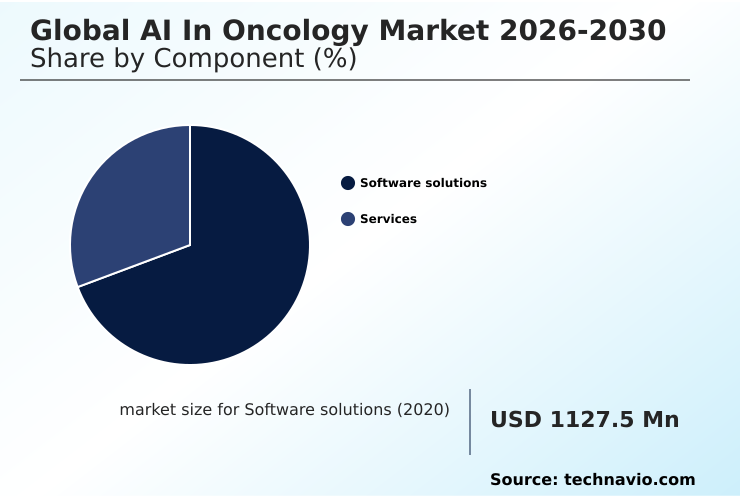
The Software solutions segment was valued at USD 2.22 billion in 2024 and showed a gradual increase during the forecast period.
How demand for the AI In Oncology market is rising in the leading region?
North America is estimated to contribute 39.7% to the growth of the global market during the forecast period.Technavio’s analysts have elaborately explained the regional trends and drivers that shape the market during the forecast period.
See How AI In Oncology Market demand is rising in North America Request Free Sample
The geographic landscape of the global AI in oncology market 2026-2030 is led by North America, which accounts for approximately 39.7% of the incremental growth, a figure nearly 17% higher than that of the APAC region.
This dominance is driven by the United States, where substantial private investment and advanced healthcare infrastructure foster rapid adoption of AI-powered diagnostics.
In contrast, APAC, while smaller in current market share, is the fastest-growing region, with a projected growth rate that is 2% higher than North America's.
This is fueled by government initiatives in countries like China and South Korea focused on digital health and biomarker discovery.
The primary difference in regional dynamics lies in adoption drivers; North America focuses on optimizing existing, highly digitized workflows, whereas APAC leverages AI to bridge gaps in healthcare access and infrastructure, showcasing different strategies for clinical trial optimization.
What are the key Drivers, Trends, and Challenges in the AI In Oncology Market?
Our researchers analyzed the data with 2025 as the base year, along with the key drivers, trends, and challenges. A holistic analysis of drivers will help companies refine their marketing strategies to gain a competitive advantage.
- Strategic decision-making in the global AI in oncology market 2026-2030 requires a nuanced understanding of application-specific dynamics, particularly concerning the cost of AI implementation in oncology clinics and the methodologies for comparing AI pathology platforms.
- While AI for lung cancer detection on CT scans has demonstrated a capacity to improve detection rates by over 20%, its adoption is often gated by the high initial investment in compatible imaging hardware and software integration.
- This contrasts with the use of machine learning in oncology drug discovery, where the return on investment is calculated over longer time horizons but can potentially reduce preclinical development timelines by up to 30%. The AI in oncology market for breast cancer remains a major segment, driven by the vast availability of mammography data for training robust algorithms.
- Understanding how to approach AI in oncology for prognosis prediction is another critical area. Here, the value is not in direct cost savings but in enabling personalized treatment pathways, which can improve therapeutic outcomes and reduce expenditures on ineffective therapies.
- The capital required for an AI system focused on prognostic modeling may be 25% lower than for a real-time diagnostic tool, but it demands more complex validation against long-term patient data. This highlights the varied financial and operational considerations across different use cases.
What are the key market drivers leading to the rise in the adoption of AI In Oncology Industry?
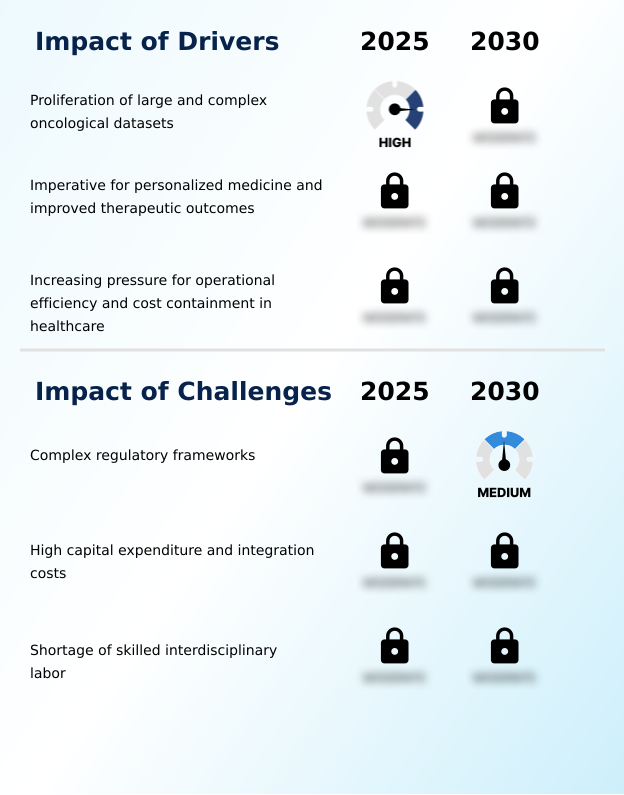
- A key driver for the market is the proliferation of large and complex oncological datasets, which necessitates advanced computational tools for meaningful analysis and interpretation.
- The imperative for personalized medicine is a powerful driver for the global AI in oncology market 2026-2030, with tailored therapies improving patient outcomes by up to 30% in certain cancers compared to standard protocols.
- Artificial intelligence is essential for delivering on this promise, as it can analyze a patient's unique molecular profiling and treatment history to forecast therapeutic response with high accuracy.
- AI platforms accelerate drug discovery acceleration by identifying novel targets from vast biological datasets.
- In clinical operations, the use of AI for patient stratification for trials can reduce study timelines by more than 40% by precisely matching participants with the most relevant interventions.
- This capability for treatment response prediction not only enhances the efficacy of care but also provides significant cost containment in healthcare by avoiding ineffective treatments.
What are the market trends shaping the AI In Oncology Industry?
- The convergence of artificial intelligence and multi-omics data integration is a definitive trend, establishing a holistic, systems-biology approach to understanding cancer's molecular complexity.
- A primary trend in the global AI in oncology market 2026-2030 is the convergence of AI with multi-omics data integration, which enhances prognostic accuracy by over 20% compared to single-data-source analysis.
- This systems biology approach enables the creation of highly detailed molecular profiling for each patient, using deep learning algorithms to identify non-invasive biomarkers from combined genomic, proteomic, and imaging data. For example, AI-driven radiomic features can extract over 1,000 quantitative data points from a single CT scan, providing insights into tumor heterogeneity that are impossible to discern manually.
- This shift toward multi-modal data integration is driving demand for sophisticated computational pathology platforms that can support complex predictive modeling, enabling more precise patient stratification for trials and personalized treatment regimens.
What challenges does the AI In Oncology Industry face during its growth?
- A primary challenge affecting industry growth is the complex and fragmented nature of regulatory frameworks governing artificial intelligence as a medical device.
- A significant challenge constraining the global AI in oncology market 2026-2030 is the substantial capital expenditure required for deployment, where high-performance computing infrastructure can account for over 35% of the total initial project cost.
- Furthermore, the process of data curation and annotation is a major operational hurdle; preparing a single, high-quality dataset for training a deep learning model can consume thousands of expert clinician hours, representing a cost up to three times that of the software engineering itself.
- This financial barrier, coupled with the AI model bias mitigation complexities and need for model interpretability, limits adoption, particularly for smaller healthcare institutions. These high upfront costs and the complex regulatory approval pathways create a significant barrier to achieving a positive return on investment for AI projects in the short term.
Exclusive Technavio Analysis on Customer Landscape
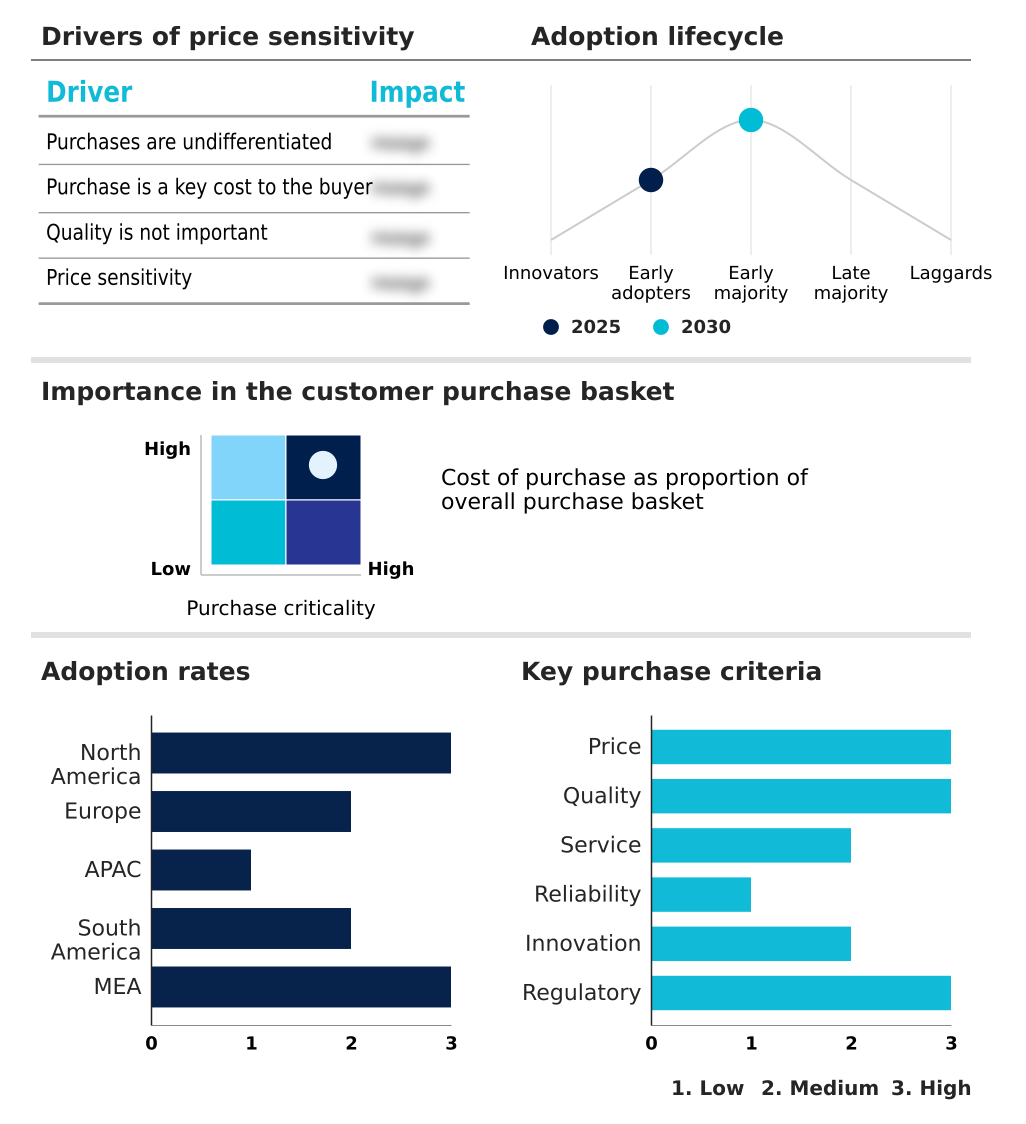
The ai in oncology market forecasting report includes the adoption lifecycle of the market, covering from the innovator’s stage to the laggard’s stage. It focuses on adoption rates in different regions based on penetration. Furthermore, the ai in oncology market report also includes key purchase criteria and drivers of price sensitivity to help companies evaluate and develop their market growth analysis strategies.
Customer Landscape of AI In Oncology Industry
Competitive Landscape
Companies are implementing various strategies, such as strategic alliances, ai in oncology market forecast, partnerships, mergers and acquisitions, geographical expansion, and product/service launches, to enhance their presence in the industry.
Amazon Web Services Inc. - The company provides scalable cloud infrastructure, enabling secure and efficient AI in oncology through large-scale data integration, storage, and analysis for genomics and medical imaging.
The industry research and growth report includes detailed analyses of the competitive landscape of the market and information about key companies, including:
- Amazon Web Services Inc.
- Caris Life Sciences
- ConcertAI Inc.
- F. Hoffmann La Roche Ltd.
- Flatiron Health
- GE HealthCare Technologies
- Google LLC
- Guardant Health Inc.
- Illumina Inc.
- Insilico Medicine
- Koninklijke Philips NV
- Merative L.P.
- Microsoft Corp.
- NVIDIA Corp.
- Owkin Inc.
- Paige AI Inc.
- PathAI Inc.
- Qure.ai Technologies Pvt. Ltd.
- Siemens Healthineers AG
- Tempus AI Inc.
Qualitative and quantitative analysis of companies has been conducted to help clients understand the wider business environment as well as the strengths and weaknesses of key industry players. Data is qualitatively analyzed to categorize companies as pure play, category-focused, industry-focused, and diversified; it is quantitatively analyzed to categorize companies as dominant, leading, strong, tentative, and weak.
Market Intelligence Radar: High-Impact Developments & Growth Signals
- In the Application Software industry, the accelerating adoption of cloud-native, subscription-based software-as-a-service (SaaS) models is lowering the barrier to entry for healthcare providers in the AI in oncology market. This shift reduces the need for large upfront capital expenditures on high-performance computing infrastructure, allowing smaller clinics and hospitals to access advanced predictive modeling and digital pathology workflows, thereby expanding the addressable market for vendors.
- The increasing emphasis on data security and privacy, formalized through regulations like GDPR, is compelling developers to prioritize robust AI governance and data privacy compliance. This directly impacts the design of AI in oncology platforms, promoting the use of techniques like federated learning in healthcare to train models without centralizing sensitive patient data, a critical factor for gaining trust and ensuring EHR interoperability.
- A significant push toward enterprise-wide automation using robotic process automation (RPA) and business process management (BPM) tools is creating demand for better clinical workflow integration within the AI in oncology market. Healthcare organizations now require AI solutions that not only provide insights but also seamlessly integrate with and automate existing diagnostic and treatment planning processes, driving a need for improved API-based connectivity.
- Persistent challenges with data integration across disparate enterprise systems are fueling innovation in solutions that support multi-omics data fusion. This trend addresses a core need in the AI in oncology market, where combining genomic, proteomic, and imaging data is essential for a systems biology approach, pushing vendors to develop more sophisticated platforms for handling heterogeneous data formats and ensuring data annotation quality.
Dive into Technavio’s robust research methodology, blending expert interviews, extensive data synthesis, and validated models for unparalleled AI In Oncology Market insights. See full methodology.
| Market Scope | |
|---|---|
| Page number | 305 |
| Base year | 2025 |
| Historic period | 2020-2024 |
| Forecast period | 2026-2030 |
| Growth momentum & CAGR | Accelerate at a CAGR of 28.1% |
| Market growth 2026-2030 | USD 9455.4 million |
| Market structure | Fragmented |
| YoY growth 2025-2026(%) | 24.7% |
| Key countries | US, Canada, Mexico, Germany, UK, France, Italy, Spain, The Netherlands, China, Japan, India, South Korea, Australia, Indonesia, Brazil, Argentina, Chile, Saudi Arabia, UAE, South Africa, Israel and Turkey |
| Competitive landscape | Leading Companies, Market Positioning of Companies, Competitive Strategies, and Industry Risks |
Research Analyst Overview
- The market ecosystem for AI in oncology is a complex network where technology suppliers, such as cloud providers and GPU manufacturers, form the foundational layer. Software solutions, a segment accounting for over 70% of the market, are developed by specialized firms and large corporations that utilize this infrastructure.
- These AI models undergo rigorous algorithm validation before seeking regulatory approval from bodies like the FDA, a critical step for commercialization. End-users, primarily hospitals and diagnostic labs, adopt these technologies to improve therapeutic outcome optimization and gain operational efficiencies. Their purchasing decisions are heavily influenced by the ability of a solution to demonstrate seamless clinical workflow integration with existing EHRs.
- Supporting this chain are research institutions that provide crucial data and clinical expertise, forming a feedback loop that drives continuous innovation and refinement of predictive oncology tools, ultimately supporting personalized treatment regimens across the healthcare landscape.
What are the Key Data Covered in this AI In Oncology Market Research and Growth Report?
-
What is the expected growth of the AI In Oncology Market between 2026 and 2030?
-
The AI In Oncology Market is expected to grow by USD 9.46 billion during 2026-2030, registering a CAGR of 28.1%. Year-over-year growth in 2026 is estimated at 24.7%%. This acceleration is shaped by proliferation of large and complex oncological datasets, which is intensifying demand across multiple end-use verticals covered in the report.
-
-
What segmentation does the market report cover?
-
The report is segmented by Component (Software solutions, and Services), Type (Breast cancer, Lung cancer, Kidney cancer, and Others), Application (Diagnosis, Drug discovery and development, Treatment planning, and Prognosis prediction) and Geography (North America, Europe, APAC, South America, Middle East and Africa). Among these, the Software solutions segment is estimated to witness significant growth during the forecast period, driven by rising adoption across key application areas. Each segment includes detailed qualitative and quantitative analysis, along with historical data from 2020-2024 and forecasts through 2030 with year-over-year growth rates.
-
-
Which regions are analyzed in the report?
-
The report covers North America, Europe, APAC, South America and Middle East and Africa. North America is estimated to contribute 39.7% to market growth during the forecast period. Country-level analysis includes US, Canada, Mexico, Germany, UK, France, Italy, Spain, The Netherlands, China, Japan, India, South Korea, Australia, Indonesia, Brazil, Argentina, Chile, Saudi Arabia, UAE, South Africa, Israel and Turkey, with dedicated market size tables and year-over-year growth for each.
-
-
What are the key growth drivers and market challenges?
-
The primary driver is proliferation of large and complex oncological datasets, which is accelerating investment and industry demand. The main challenge is complex regulatory frameworks, creating operational barriers for key market participants. The report quantifies the impact of each driver and challenge across 2026 and 2030 with comparative analysis.
-
-
Who are the major players in the AI In Oncology Market?
-
Key vendors include Amazon Web Services Inc., Caris Life Sciences, ConcertAI Inc., F. Hoffmann La Roche Ltd., Flatiron Health, GE HealthCare Technologies, Google LLC, Guardant Health Inc., Illumina Inc., Insilico Medicine, Koninklijke Philips NV, Merative L.P., Microsoft Corp., NVIDIA Corp., Owkin Inc., Paige AI Inc., PathAI Inc., Qure.ai Technologies Pvt. Ltd., Siemens Healthineers AG and Tempus AI Inc.. The report provides qualitative and quantitative analysis categorizing companies as dominant, leading, strong, tentative, and weak based on their market positioning. Company profiles include business segment analysis, SWOT assessment, key offerings, and recent strategic developments.
-
Market Research Insights
- The competitive landscape for AI in oncology is highly fragmented, with North America accounting for nearly 40% of all new technology deployments. Key vendors like F. Hoffmann La Roche Ltd. and GE HealthCare Technologies are solidifying their positions through strategic innovation and regulatory milestones.
- For instance, Roche secured an FDA Breakthrough Device Designation for an AI-powered companion diagnostic, showcasing progress in personalized medicine. Similarly, GE HealthCare launched its Genesis cloud-native imaging portfolio to enhance enterprise-wide AI accessibility.
- These developments are a direct response to the industry's demand for integrated solutions that can improve diagnostic accuracy, which some studies show can be enhanced by up to 15% with AI assistance. However, companies face the persistent challenge of navigating complex and varied global regulatory approval pathways, which can delay market entry.
We can help! Our analysts can customize this ai in oncology market research report to meet your requirements.
 RIA -
RIA - 
