AI In Patient Engagement Solutions Market Analysis, Size, and Forecast 2025-2029: North America (US, Canada, and Mexico), Europe (Germany, UK, and France), APAC (China, India, and Japan), South America (Brazil, Argentina, and Colombia), Middle East and Africa (UAE, Saudi Arabia, and South Africa), and Rest of World (ROW)

AI In Patient Engagement Solutions Market Analysis, Size, and Forecast 2025-2029:
North America (US, Canada, and Mexico), Europe (Germany, UK, and France), APAC (China, India, and Japan), South America (Brazil, Argentina, and Colombia), Middle East and Africa (UAE, Saudi Arabia, and South Africa), and Rest of World (ROW)

Published: Dec 2025 299 Pages SKU: IRTNTR81061

Market Overview at a Glance

$8.62 B
Market Opportunity
17.9%
CAGR 2024 - 2029
39.2%
North America Growth
$3.21 B
Software segment 2023

AI In Patient Engagement Solutions Market Size 2025-2029

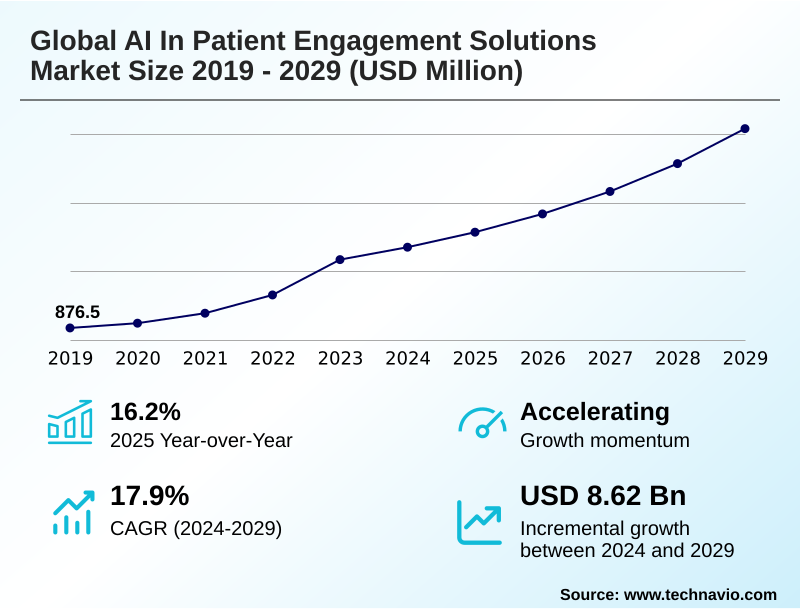
The ai in patient engagement solutions market size is valued to increase by USD 8.62 billion, at a CAGR of 17.9% from 2024 to 2029. Proliferation of generative AI and advanced natural language processing will drive the ai in patient engagement solutions market.

Major Market Trends & Insights

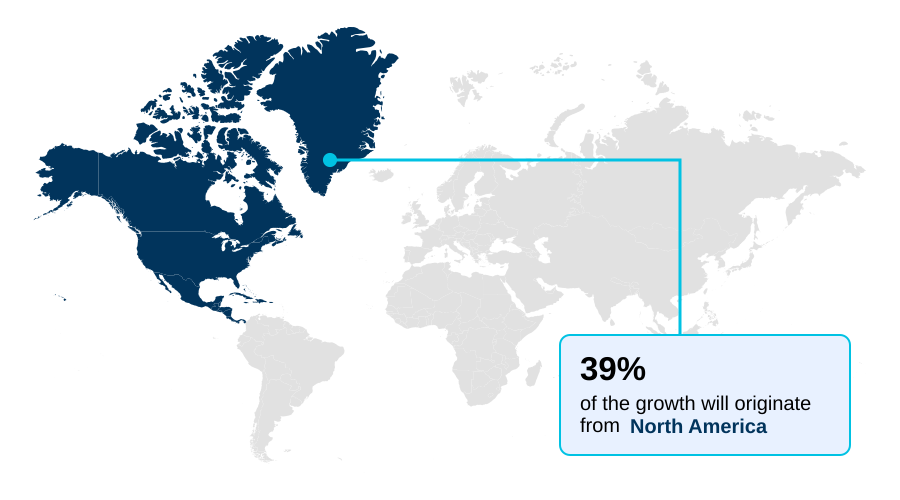
  • North America dominated the market and accounted for a 39.2% growth during the forecast period.
  • By Component - Software segment was valued at USD 3.21 billion in 2023
  • By Technology - NLP segment accounted for the largest market revenue share in 2023

Market Size & Forecast

  • Market Opportunities: USD 14.50 billion
  • Market Future Opportunities: USD 8.62 billion
  • CAGR from 2024 to 2029 : 17.9%

Market Summary

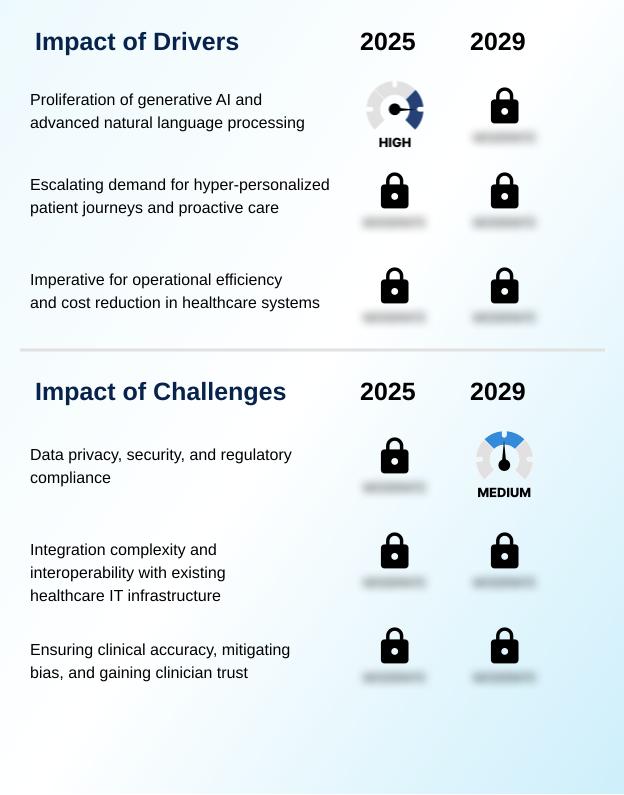
  • The AI in patient engagement solutions market centers on software and services using machine learning and natural language processing to optimize the relationship between patients and providers. A primary driver is the demand for operational efficiency, pushing healthcare organizations to adopt tools that automate administrative workflows and reduce costs.
  • The push for hyper-personalized patient journeys is another key factor, with AI algorithms analyzing data from EHRs and wearables to enable proactive care. Market trends include the shift toward affective AI for more empathetic interactions and the convergence of AI with remote patient monitoring and digital therapeutics.
  • However, significant challenges persist around data privacy, EHR integration, and the need to mitigate algorithmic bias. For instance, a health system can deploy AI-driven triage to manage patient intake, using conversational AI to understand symptoms and guide individuals to the appropriate care setting.
  • This not only improves the patient experience but also optimizes clinical resource allocation, directly addressing staff shortages and reducing clinician burnout. This strategic application underscores the market's role in creating a more efficient and patient-centric healthcare ecosystem.

What will be the Size of the AI In Patient Engagement Solutions Market during the forecast period?

Get Key Insights on Market Forecast (PDF) Request Free Sample

How is the AI In Patient Engagement Solutions Market Segmented?

The ai in patient engagement solutions industry research report provides comprehensive data (region-wise segment analysis), with forecasts and estimates in "USD million" for the period 2025-2029, as well as historical data from 2019-2023 for the following segments.

  • Component
    • Software
    • Services
    • Hardware
  • Technology
    • NLP
    • Chatbots
    • Predictive analytics
    • Others
  • Type
    • Communication and reminders
    • Appointment scheduling and access
    • Health tracking and remote monitoring
    • Others
  • Geography
    • North America
      • US
      • Canada
      • Mexico
    • Europe
      • Germany
      • UK
      • France
    • APAC
      • China
      • India
      • Japan
    • South America
      • Brazil
      • Argentina
      • Colombia
    • Middle East and Africa
      • UAE
      • Saudi Arabia
      • South Africa
    • Rest of World (ROW)

By Component Insights

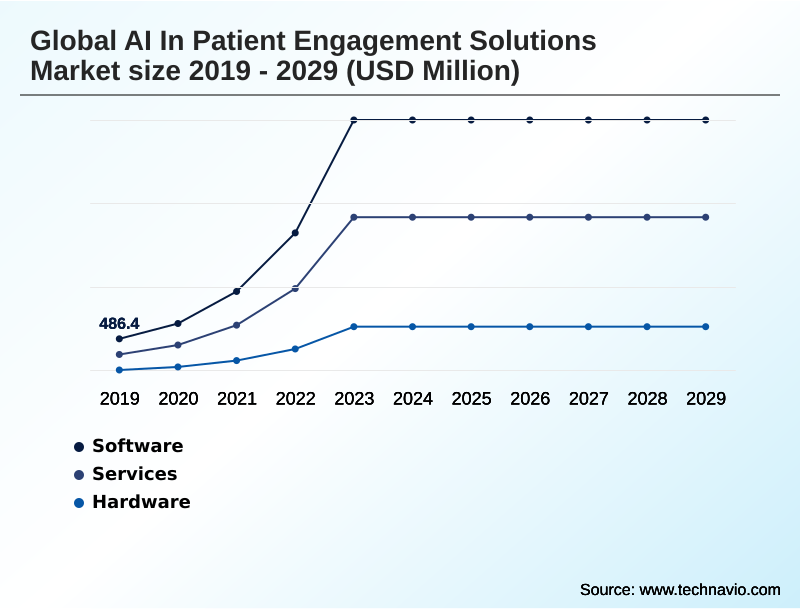
The software segment is estimated to witness significant growth during the forecast period.

The software component is the engine of the market, featuring platforms and algorithms that enable intelligent interactions.

Core software solutions include conversational AI and virtual health assistants, which handle tasks from automated appointment scheduling to AI-driven triage through intelligent patient triage systems.

The evolution toward generative AI is enhancing these capabilities, with generative AI in clinical workflows automating the creation of personalized patient content. Predictive analytics platforms leverage patient data analytics to power AI-driven population health management and identify at-risk individuals.

These systems, often deployed via SaaS models, require deep EHR integration. Successful implementation of digital patient intake solutions has been shown to reduce administrative data entry errors by over 40%, improving data quality for downstream analytics.

Request Free Sample

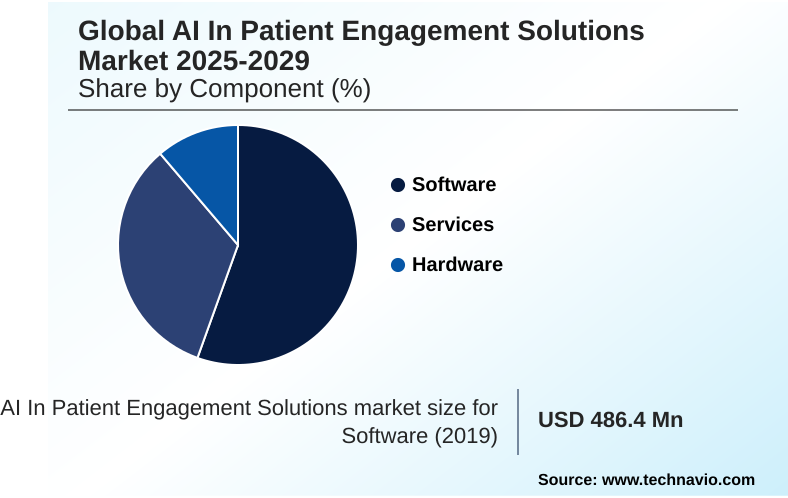
The Software segment was valued at USD 3.21 billion in 2023 and showed a gradual increase during the forecast period.

Request Free Sample

Regional Analysis

North America is estimated to contribute 39.2% to the growth of the global market during the forecast period.Technavio’s analysts have elaborately explained the regional trends and drivers that shape the market during the forecast period.

See How AI In Patient Engagement Solutions Market Demand is Rising in North America Request Free Sample

The market's geographic landscape is led by North America, which is poised to contribute 39.2% of incremental growth, driven by its focus on AI for value-based care and clinician burnout reduction.

Providers in this region extensively use AI-powered care coordination and patient risk stratification to enable proactive care delivery. In contrast, APAC is the fastest-growing region, leveraging AI-enabled remote care models to bridge urban-rural care gaps and scale patient support.

AI platforms are instrumental in patient journey orchestration, with deployments of ambient clinical intelligence showing a reduction in documentation time by over 30%.

These tools provide personalized health guidance and clinical decision support, helping to reduce hospital readmissions with AI-powered follow-ups, a critical metric for providers globally.

Market Dynamics

Our researchers analyzed the data with 2024 as the base year, along with the key drivers, trends, and challenges. A holistic analysis of drivers will help companies refine their marketing strategies to gain a competitive advantage.

  • Assessing the ROI of AI in patient engagement reveals a clear path to value, primarily through reducing clinician burnout with AI tools and improving patient adherence using AI. The strategic implementation of AI for hyper-personalized care delivery is central, supported by the development of AI for personalized care plans that address individual patient needs.
  • A key application is the use of AI for proactive patient outreach, which is crucial for managing population health and fulfilling the objectives of AI solutions for value-based care. The benefits of conversational AI in healthcare are most evident in tools like AI chatbots for patient symptom checking and platforms that AI to automate patient scheduling.
  • Furthermore, the role of AI in chronic disease management is expanding, with AI analytics for patient risk stratification enabling early interventions. This is particularly effective when using AI for post-discharge follow-up, as predictive analytics to prevent readmissions has a direct financial impact. Generative AI for patient education materials and AI-driven mental health support platforms are creating more holistic support systems.
  • However, success hinges on securing PHI in AI-powered applications and solving AI and EHR interoperability challenges. Measuring success of AI patient engagement requires tracking metrics across these diverse workflows, where systems that have fully embraced implementing AI in patient journey workflows report patient satisfaction scores increasing at twice the rate of those using manual processes.

What are the key market drivers leading to the rise in the adoption of AI In Patient Engagement Solutions Industry?

  • The proliferation of generative AI and advanced natural language processing is a key driver fueling growth and innovation within the market.

  • The market is driven by the rapid proliferation of generative AI and natural language processing, which enables hyper-personalized healthcare experiences.
  • The use of generative AI in clinical workflows for automating administrative healthcare tasks is a key factor in clinician burnout reduction, with some systems cutting documentation time by up to 50%.
  • This technology facilitates the delivery of proactive care delivery and personalized health guidance. The increasing patient demand for consumer-grade healthcare experiences is another strong driver, pushing providers to adopt conversational AI for on-demand support.
  • Moreover, the transition to value-based care models incentivizes investment in AI for value-based care, as AI-driven patient education platforms for health literacy enhancement have been linked to a 10% improvement in medication adherence.

What are the market trends shaping the AI In Patient Engagement Solutions Industry?

  • The market is witnessing a notable trend with the emergence of empathetic and affective AI. These advancements are designed to provide holistic patient support beyond purely functional interactions.

  • A primary market trend is the shift toward empathetic AI communication, where affective computing and emotion AI are integrated into digital health companions. This evolution creates a more supportive patient experience. Another significant trend is hyper-automation, using robotic process automation for end-to-end patient journey orchestration. This patient journey automation streamlines administrative and logistical workflows, improving efficiency.
  • For example, AI-powered health coaching platforms have demonstrated a 15% increase in user engagement compared to static apps. Furthermore, the convergence of AI with digital therapeutics and AI-enabled remote care models is creating new paradigms for chronic disease management. These systems use predictive intervention models to trigger proactive outreach, improving outcomes and reducing the need for acute care.

What challenges does the AI In Patient Engagement Solutions Industry face during its growth?

  • Navigating complex data privacy regulations, ensuring robust security, and maintaining regulatory compliance represent a key challenge affecting industry growth.

  • A major market challenge is the complexity of EHR integration with AI, which often consumes over 40% of an implementation budget due to a lack of universal interoperability standards. While FHIR resources are emerging, achieving seamless data flow for AI-powered care coordination remains difficult.
  • Securing patient data in AI systems is another critical hurdle, requiring constant investment to protect against breaches and maintain patient trust. Furthermore, ensuring AI model transparency in healthcare and executing effective algorithmic bias mitigation are essential for gaining clinician and patient confidence.
  • The operational difficulty of scaling patient support with AI is also significant, as optimizing patient flow with AI requires sophisticated smart routing algorithms and a robust care coordination platform that can handle diverse and unpredictable patient inquiries effectively.

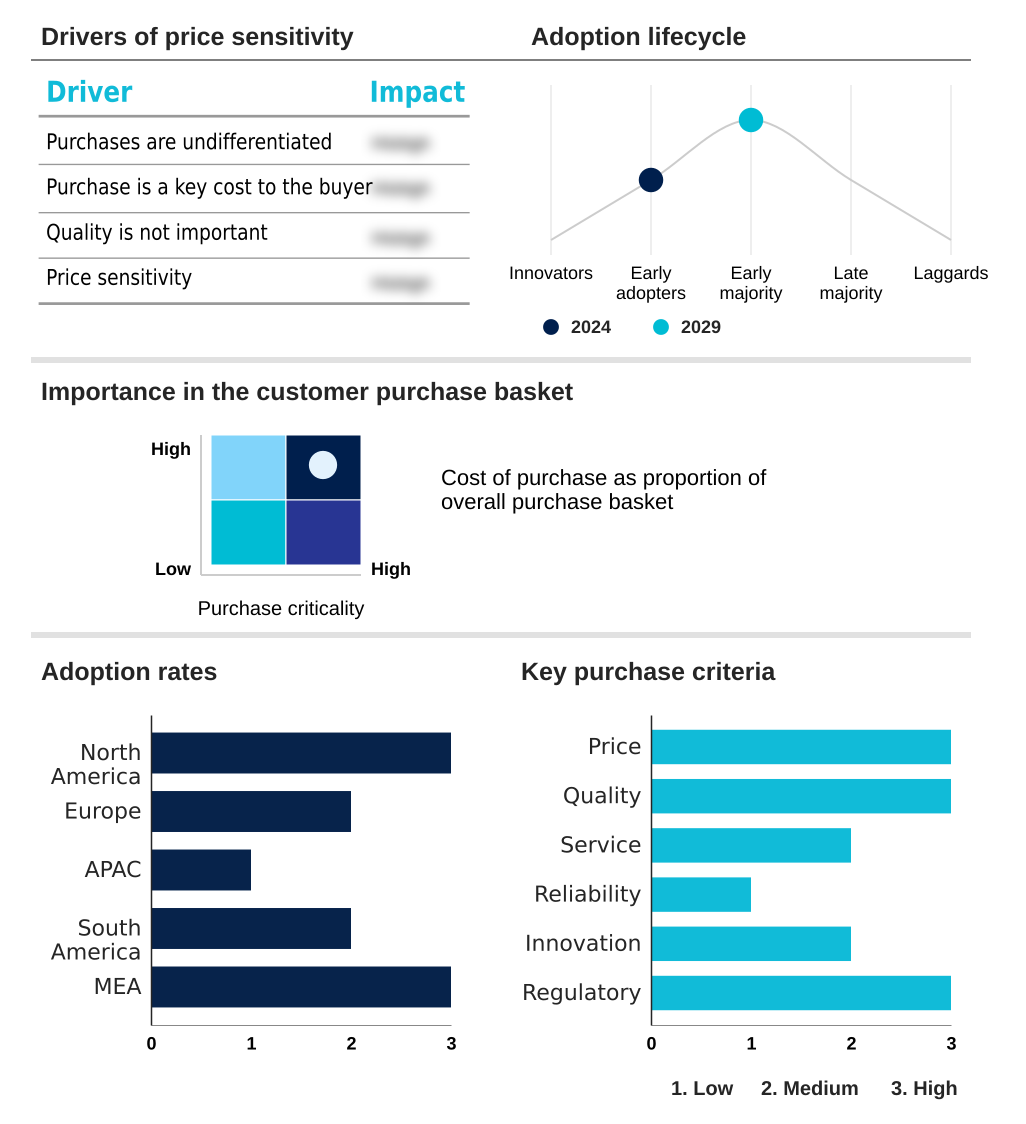
Exclusive Technavio Analysis on Customer Landscape

The ai in patient engagement solutions market forecasting report includes the adoption lifecycle of the market, covering from the innovator’s stage to the laggard’s stage. It focuses on adoption rates in different regions based on penetration. Furthermore, the ai in patient engagement solutions market report also includes key purchase criteria and drivers of price sensitivity to help companies evaluate and develop their market growth analysis strategies.

Customer Landscape of AI In Patient Engagement Solutions Industry

Competitive Landscape

Companies are implementing various strategies, such as strategic alliances, ai in patient engagement solutions market forecast, partnerships, mergers and acquisitions, geographical expansion, and product/service launches, to enhance their presence in the industry.

Ada Health GmbH - Delivering AI-powered symptom assessment and personalized health guidance through a multilingual conversational platform, enhancing the digital front door for healthcare systems.

The industry research and growth report includes detailed analyses of the competitive landscape of the market and information about key companies, including:

  • Ada Health GmbH
  • American Well Corp.
  • Buoy Health Inc.
  • Clarify Health Solutions Inc.
  • Clinithink Ltd.
  • COMMURE Inc.
  • Health Catalyst Inc.
  • K Health
  • Kyruus Inc.
  • Lark Technologies Inc.
  • Orbita Inc.
  • PathAI Inc.
  • Prevencio
  • Qventus Inc.
  • Sense.ly Corp.
  • Viz.ai Inc.
  • Welltok Inc.
  • WiserCare
  • ZocDoc Inc.
  • ZS Associates Inc.

Qualitative and quantitative analysis of companies has been conducted to help clients understand the wider business environment as well as the strengths and weaknesses of key industry players. Data is qualitatively analyzed to categorize companies as pure play, category-focused, industry-focused, and diversified; it is quantitatively analyzed to categorize companies as dominant, leading, strong, tentative, and weak.

Recent Development and News in Ai in patient engagement solutions market

  • In October, 2024, Viz.ai Inc. announced a strategic partnership with a leading cardiovascular device manufacturer to integrate its AI-powered care coordination platform, aiming to improve post-procedural patient engagement and remote patient monitoring.
  • In January, 2025, Orbita Inc. launched its next-generation conversational AI platform, featuring advanced empathetic AI and affective computing capabilities designed to provide holistic support for patients with chronic mental health conditions.
  • In March, 2025, American Well Corp. completed its acquisition of a specialized digital therapeutics startup, a move intended to bolster its Converge platform with AI-driven personalized treatment programs for managing chronic diseases.
  • In May, 2025, Health Catalyst Inc. announced it received a major federal grant to develop a new predictive analytics model focused on reducing health disparities by identifying at-risk populations for proactive engagement and care management.

Dive into Technavio’s robust research methodology, blending expert interviews, extensive data synthesis, and validated models for unparalleled AI In Patient Engagement Solutions Market insights. See full methodology.

Market Scope
Page number 299
Base year 2024
Historic period 2019-2023
Forecast period 2025-2029
Growth momentum & CAGR Accelerate at a CAGR of 17.9%
Market growth 2025-2029 USD 8622.8 million
Market structure Fragmented
YoY growth 2024-2025(%) 16.2%
Key countries US, Canada, Mexico, Germany, UK, France, Italy, Spain, The Netherlands, China, India, Japan, South Korea, Australia, Indonesia, Brazil, Argentina, Colombia, UAE, Saudi Arabia, South Africa, Israel and Turkey
Competitive landscape Leading Companies, Market Positioning of Companies, Competitive Strategies, and Industry Risks

Request Free Sample

Research Analyst Overview

  • The market is evolving from basic software solutions toward sophisticated platforms utilizing generative AI and natural language processing. The focus is on creating empathetic AI through affective computing and sentiment analysis algorithms to enhance the patient experience. Core applications include conversational AI and virtual health assistants for AI-driven triage and automated appointment scheduling.
  • This digital front door is part of a broader patient journey orchestration strategy. In clinical settings, predictive analytics and patient data analytics are used for patient risk stratification and proactive care delivery, supported by clinical decision support and care coordination platforms. AI-powered symptom assessment and personalized health guidance are becoming standard.
  • Key technologies like remote patient monitoring and digital therapeutics are integrated for chronic disease management, where patient adherence improvement is a key goal. The push for hyper-automation and robotic process automation is also driving the adoption of ambient clinical intelligence and clinical documentation automation to achieve clinician burnout reduction.
  • However, achieving this requires overcoming challenges in EHR integration and ensuring interoperability standards like FHIR resources are adopted. Success also depends on algorithmic bias mitigation. Deployments that effectively use smart routing algorithms and computer vision in healthcare have shown a reduction in administrative response times by over 40%, demonstrating clear value in a landscape driven by value-based care models.

What are the Key Data Covered in this AI In Patient Engagement Solutions Market Research and Growth Report?

  • What is the expected growth of the AI In Patient Engagement Solutions Market between 2025 and 2029?

    • USD 8.62 billion, at a CAGR of 17.9%

  • What segmentation does the market report cover?

    • The report is segmented by Component (Software, Services, Hardware), Technology (NLP, Chatbots, Predictive analytics, Others), Type (Communication and reminders, Appointment scheduling and access, Health tracking and remote monitoring, Others) and Geography (North America, Europe, APAC, South America, Middle East and Africa)

  • Which regions are analyzed in the report?

    • North America, Europe, APAC, South America and Middle East and Africa

  • What are the key growth drivers and market challenges?

    • Proliferation of generative AI and advanced natural language processing, Data privacy, security, and regulatory compliance

  • Who are the major players in the AI In Patient Engagement Solutions Market?

    • Ada Health GmbH, American Well Corp., Buoy Health Inc., Clarify Health Solutions Inc., Clinithink Ltd., COMMURE Inc., Health Catalyst Inc., K Health, Kyruus Inc., Lark Technologies Inc., Orbita Inc., PathAI Inc., Prevencio, Qventus Inc., Sense.ly Corp., Viz.ai Inc., Welltok Inc., WiserCare, ZocDoc Inc. and ZS Associates Inc.

Market Research Insights

  • Market dynamics are shaped by the dual pressures of enhancing patient experience and achieving operational efficiency. The adoption of AI for chronic disease management has been shown to improve patient adherence by over 20% compared to traditional outreach. Meanwhile, implementing patient journey automation through advanced digital front door solutions reduces appointment no-show rates, in some cases by up to 15%.
  • As healthcare providers pursue value-based care, the ROI of patient engagement platforms becomes a critical metric. This is driving demand for AI-powered health coaching and proactive patient outreach strategies that deliver consumer-grade healthcare experiences. The ability to offer hyper-personalized healthcare experiences is no longer a differentiator but a core expectation, fueling investment in platforms that support these sophisticated, data-driven models.

We can help! Our analysts can customize this ai in patient engagement solutions market research report to meet your requirements.

Get in touch

1. Executive Summary

1.1 Market overview

Executive Summary - Chart on Market Overview
Executive Summary - Data Table on Market Overview
Executive Summary - Chart on Global Market Characteristics
Executive Summary - Chart on Market by Geography
Executive Summary - Chart on Market Segmentation by Component
Executive Summary - Chart on Market Segmentation by Technology
Executive Summary - Chart on Market Segmentation by Type
Executive Summary - Chart on Incremental Growth
Executive Summary - Data Table on Incremental Growth
Executive Summary - Chart on Company Market Positioning

2. Technavio Analysis

2.1 Analysis of price sensitivity, lifecycle, customer purchase basket, adoption rates, and purchase criteria

2.2 Criticality of inputs and Factors of differentiation

Chart on Overview on criticality of inputs and factors of differentiation

2.3 Factors of disruption

Chart on Overview on factors of disruption

2.4 Impact of drivers and challenges

Chart on Impact of drivers and challenges in 2024 and 2029

3. Market Landscape

3.1 Market ecosystem

Chart on Parent Market
Data Table on - Parent Market

3.2 Market characteristics

Chart on Market characteristics analysis

3.3 Value chain analysis

Chart on Value chain analysis

4. Market Sizing

4.1 Market definition

Data Table on Offerings of companies included in the market definition

4.2 Market segment analysis

Market segments

4.3 Market size 2024

4.4 Market outlook: Forecast for 2024-2029

Chart on Global - Market size and forecast 2024-2029 ($ million)
Data Table on Global - Market size and forecast 2024-2029 ($ million)
Chart on Global Market: Year-over-year growth 2024-2029 (%)
Data Table on Global Market: Year-over-year growth 2024-2029 (%)

5. Historic Market Size

5.1 Global AI In Patient Engagement Solutions Market 2019 - 2023

Historic Market Size - Data Table on Global AI In Patient Engagement Solutions Market 2019 - 2023 ($ million)

5.2 Component segment analysis 2019 - 2023

Historic Market Size - Component Segment 2019 - 2023 ($ million)

5.3 Technology segment analysis 2019 - 2023

Historic Market Size - Technology Segment 2019 - 2023 ($ million)

5.4 Type segment analysis 2019 - 2023

Historic Market Size - Type Segment 2019 - 2023 ($ million)

5.5 Geography segment analysis 2019 - 2023

Historic Market Size - Geography Segment 2019 - 2023 ($ million)

5.6 Country segment analysis 2019 - 2023

Historic Market Size - Country Segment 2019 - 2023 ($ million)

6. Five Forces Analysis

6.1 Five forces summary

Five forces analysis - Comparison between 2024 and 2029

6.2 Bargaining power of buyers

Bargaining power of buyers - Impact of key factors 2024 and 2029

6.3 Bargaining power of suppliers

Bargaining power of suppliers - Impact of key factors in 2024 and 2029

6.4 Threat of new entrants

Threat of new entrants - Impact of key factors in 2024 and 2029

6.5 Threat of substitutes

Threat of substitutes - Impact of key factors in 2024 and 2029

6.6 Threat of rivalry

Threat of rivalry - Impact of key factors in 2024 and 2029

6.7 Market condition

Chart on Market condition - Five forces 2024 and 2029

7. Market Segmentation by Component

7.1 Market segments

Chart on Component - Market share 2024-2029 (%)
Data Table on Component - Market share 2024-2029 (%)

7.2 Comparison by Component

Chart on Comparison by Component
Data Table on Comparison by Component

7.3 Software - Market size and forecast 2024-2029

Chart on Software - Market size and forecast 2024-2029 ($ million)
Data Table on Software - Market size and forecast 2024-2029 ($ million)
Chart on Software - Year-over-year growth 2024-2029 (%)
Data Table on Software - Year-over-year growth 2024-2029 (%)

7.4 Services - Market size and forecast 2024-2029

Chart on Services - Market size and forecast 2024-2029 ($ million)
Data Table on Services - Market size and forecast 2024-2029 ($ million)
Chart on Services - Year-over-year growth 2024-2029 (%)
Data Table on Services - Year-over-year growth 2024-2029 (%)

7.5 Hardware - Market size and forecast 2024-2029

Chart on Hardware - Market size and forecast 2024-2029 ($ million)
Data Table on Hardware - Market size and forecast 2024-2029 ($ million)
Chart on Hardware - Year-over-year growth 2024-2029 (%)
Data Table on Hardware - Year-over-year growth 2024-2029 (%)

7.6 Market opportunity by Component

Market opportunity by Component ($ million)
Data Table on Market opportunity by Component ($ million)

8. Market Segmentation by Technology

8.1 Market segments

Chart on Technology - Market share 2024-2029 (%)
Data Table on Technology - Market share 2024-2029 (%)

8.2 Comparison by Technology

Chart on Comparison by Technology
Data Table on Comparison by Technology

8.3 NLP - Market size and forecast 2024-2029

Chart on NLP - Market size and forecast 2024-2029 ($ million)
Data Table on NLP - Market size and forecast 2024-2029 ($ million)
Chart on NLP - Year-over-year growth 2024-2029 (%)
Data Table on NLP - Year-over-year growth 2024-2029 (%)

8.4 Chatbots - Market size and forecast 2024-2029

Chart on Chatbots - Market size and forecast 2024-2029 ($ million)
Data Table on Chatbots - Market size and forecast 2024-2029 ($ million)
Chart on Chatbots - Year-over-year growth 2024-2029 (%)
Data Table on Chatbots - Year-over-year growth 2024-2029 (%)

8.5 Predictive analytics - Market size and forecast 2024-2029

Chart on Predictive analytics - Market size and forecast 2024-2029 ($ million)
Data Table on Predictive analytics - Market size and forecast 2024-2029 ($ million)
Chart on Predictive analytics - Year-over-year growth 2024-2029 (%)
Data Table on Predictive analytics - Year-over-year growth 2024-2029 (%)

8.6 Others - Market size and forecast 2024-2029

Chart on Others - Market size and forecast 2024-2029 ($ million)
Data Table on Others - Market size and forecast 2024-2029 ($ million)
Chart on Others - Year-over-year growth 2024-2029 (%)
Data Table on Others - Year-over-year growth 2024-2029 (%)

8.7 Market opportunity by Technology

Market opportunity by Technology ($ million)
Data Table on Market opportunity by Technology ($ million)

9. Market Segmentation by Type

9.1 Market segments

Chart on Type - Market share 2024-2029 (%)
Data Table on Type - Market share 2024-2029 (%)

9.2 Comparison by Type

Chart on Comparison by Type
Data Table on Comparison by Type

9.3 Communication and reminders - Market size and forecast 2024-2029

Chart on Communication and reminders - Market size and forecast 2024-2029 ($ million)
Data Table on Communication and reminders - Market size and forecast 2024-2029 ($ million)
Chart on Communication and reminders - Year-over-year growth 2024-2029 (%)
Data Table on Communication and reminders - Year-over-year growth 2024-2029 (%)

9.4 Appointment scheduling and access - Market size and forecast 2024-2029

Chart on Appointment scheduling and access - Market size and forecast 2024-2029 ($ million)
Data Table on Appointment scheduling and access - Market size and forecast 2024-2029 ($ million)
Chart on Appointment scheduling and access - Year-over-year growth 2024-2029 (%)
Data Table on Appointment scheduling and access - Year-over-year growth 2024-2029 (%)

9.5 Health tracking and remote monitoring - Market size and forecast 2024-2029

Chart on Health tracking and remote monitoring - Market size and forecast 2024-2029 ($ million)
Data Table on Health tracking and remote monitoring - Market size and forecast 2024-2029 ($ million)
Chart on Health tracking and remote monitoring - Year-over-year growth 2024-2029 (%)
Data Table on Health tracking and remote monitoring - Year-over-year growth 2024-2029 (%)

9.6 Others - Market size and forecast 2024-2029

Chart on Others - Market size and forecast 2024-2029 ($ million)
Data Table on Others - Market size and forecast 2024-2029 ($ million)
Chart on Others - Year-over-year growth 2024-2029 (%)
Data Table on Others - Year-over-year growth 2024-2029 (%)

9.7 Market opportunity by Type

Market opportunity by Type ($ million)
Data Table on Market opportunity by Type ($ million)

10. Customer Landscape

10.1 Customer landscape overview

Analysis of price sensitivity, lifecycle, customer purchase basket, adoption rates, and purchase criteria

11. Geographic Landscape

11.1 Geographic segmentation

Chart on Market share by geography 2024-2029 (%)
Data Table on Market share by geography 2024-2029 (%)

11.2 Geographic comparison

Chart on Geographic comparison
Data Table on Geographic comparison

11.3 North America - Market size and forecast 2024-2029

Chart on North America - Market size and forecast 2024-2029 ($ million)
Data Table on North America - Market size and forecast 2024-2029 ($ million)
Chart on North America - Year-over-year growth 2024-2029 (%)
Data Table on North America - Year-over-year growth 2024-2029 (%)
Chart on Regional Comparison - North America
Data Table on Regional Comparison - North America

11.3.1 US - Market size and forecast 2024-2029

Chart on US - Market size and forecast 2024-2029 ($ million)
Data Table on US - Market size and forecast 2024-2029 ($ million)
Chart on US - Year-over-year growth 2024-2029 (%)
Data Table on US - Year-over-year growth 2024-2029 (%)

11.3.2 Canada - Market size and forecast 2024-2029

Chart on Canada - Market size and forecast 2024-2029 ($ million)
Data Table on Canada - Market size and forecast 2024-2029 ($ million)
Chart on Canada - Year-over-year growth 2024-2029 (%)
Data Table on Canada - Year-over-year growth 2024-2029 (%)

11.3.3 Mexico - Market size and forecast 2024-2029

Chart on Mexico - Market size and forecast 2024-2029 ($ million)
Data Table on Mexico - Market size and forecast 2024-2029 ($ million)
Chart on Mexico - Year-over-year growth 2024-2029 (%)
Data Table on Mexico - Year-over-year growth 2024-2029 (%)

11.4 Europe - Market size and forecast 2024-2029

Chart on Europe - Market size and forecast 2024-2029 ($ million)
Data Table on Europe - Market size and forecast 2024-2029 ($ million)
Chart on Europe - Year-over-year growth 2024-2029 (%)
Data Table on Europe - Year-over-year growth 2024-2029 (%)
Chart on Regional Comparison - Europe
Data Table on Regional Comparison - Europe

11.4.1 Germany - Market size and forecast 2024-2029

Chart on Germany - Market size and forecast 2024-2029 ($ million)
Data Table on Germany - Market size and forecast 2024-2029 ($ million)
Chart on Germany - Year-over-year growth 2024-2029 (%)
Data Table on Germany - Year-over-year growth 2024-2029 (%)

11.4.2 UK - Market size and forecast 2024-2029

Chart on UK - Market size and forecast 2024-2029 ($ million)
Data Table on UK - Market size and forecast 2024-2029 ($ million)
Chart on UK - Year-over-year growth 2024-2029 (%)
Data Table on UK - Year-over-year growth 2024-2029 (%)

11.4.3 France - Market size and forecast 2024-2029

Chart on France - Market size and forecast 2024-2029 ($ million)
Data Table on France - Market size and forecast 2024-2029 ($ million)
Chart on France - Year-over-year growth 2024-2029 (%)
Data Table on France - Year-over-year growth 2024-2029 (%)

11.4.4 Italy - Market size and forecast 2024-2029

Chart on Italy - Market size and forecast 2024-2029 ($ million)
Data Table on Italy - Market size and forecast 2024-2029 ($ million)
Chart on Italy - Year-over-year growth 2024-2029 (%)
Data Table on Italy - Year-over-year growth 2024-2029 (%)

11.4.5 Spain - Market size and forecast 2024-2029

Chart on Spain - Market size and forecast 2024-2029 ($ million)
Data Table on Spain - Market size and forecast 2024-2029 ($ million)
Chart on Spain - Year-over-year growth 2024-2029 (%)
Data Table on Spain - Year-over-year growth 2024-2029 (%)

11.4.6 The Netherlands - Market size and forecast 2024-2029

Chart on The Netherlands - Market size and forecast 2024-2029 ($ million)
Data Table on The Netherlands - Market size and forecast 2024-2029 ($ million)
Chart on The Netherlands - Year-over-year growth 2024-2029 (%)
Data Table on The Netherlands - Year-over-year growth 2024-2029 (%)

11.5 APAC - Market size and forecast 2024-2029

Chart on APAC - Market size and forecast 2024-2029 ($ million)
Data Table on APAC - Market size and forecast 2024-2029 ($ million)
Chart on APAC - Year-over-year growth 2024-2029 (%)
Data Table on APAC - Year-over-year growth 2024-2029 (%)
Chart on Regional Comparison - APAC
Data Table on Regional Comparison - APAC

11.5.1 China - Market size and forecast 2024-2029

Chart on China - Market size and forecast 2024-2029 ($ million)
Data Table on China - Market size and forecast 2024-2029 ($ million)
Chart on China - Year-over-year growth 2024-2029 (%)
Data Table on China - Year-over-year growth 2024-2029 (%)

11.5.2 India - Market size and forecast 2024-2029

Chart on India - Market size and forecast 2024-2029 ($ million)
Data Table on India - Market size and forecast 2024-2029 ($ million)
Chart on India - Year-over-year growth 2024-2029 (%)
Data Table on India - Year-over-year growth 2024-2029 (%)

11.5.3 Japan - Market size and forecast 2024-2029

Chart on Japan - Market size and forecast 2024-2029 ($ million)
Data Table on Japan - Market size and forecast 2024-2029 ($ million)
Chart on Japan - Year-over-year growth 2024-2029 (%)
Data Table on Japan - Year-over-year growth 2024-2029 (%)

11.5.4 South Korea - Market size and forecast 2024-2029

Chart on South Korea - Market size and forecast 2024-2029 ($ million)
Data Table on South Korea - Market size and forecast 2024-2029 ($ million)
Chart on South Korea - Year-over-year growth 2024-2029 (%)
Data Table on South Korea - Year-over-year growth 2024-2029 (%)

11.5.5 Australia - Market size and forecast 2024-2029

Chart on Australia - Market size and forecast 2024-2029 ($ million)
Data Table on Australia - Market size and forecast 2024-2029 ($ million)
Chart on Australia - Year-over-year growth 2024-2029 (%)
Data Table on Australia - Year-over-year growth 2024-2029 (%)

11.5.6 Indonesia - Market size and forecast 2024-2029

Chart on Indonesia - Market size and forecast 2024-2029 ($ million)
Data Table on Indonesia - Market size and forecast 2024-2029 ($ million)
Chart on Indonesia - Year-over-year growth 2024-2029 (%)
Data Table on Indonesia - Year-over-year growth 2024-2029 (%)

11.6 South America - Market size and forecast 2024-2029

Chart on South America - Market size and forecast 2024-2029 ($ million)
Data Table on South America - Market size and forecast 2024-2029 ($ million)
Chart on South America - Year-over-year growth 2024-2029 (%)
Data Table on South America - Year-over-year growth 2024-2029 (%)
Chart on Regional Comparison - South America
Data Table on Regional Comparison - South America

11.6.1 Brazil - Market size and forecast 2024-2029

Chart on Brazil - Market size and forecast 2024-2029 ($ million)
Data Table on Brazil - Market size and forecast 2024-2029 ($ million)
Chart on Brazil - Year-over-year growth 2024-2029 (%)
Data Table on Brazil - Year-over-year growth 2024-2029 (%)

11.6.2 Argentina - Market size and forecast 2024-2029

Chart on Argentina - Market size and forecast 2024-2029 ($ million)
Data Table on Argentina - Market size and forecast 2024-2029 ($ million)
Chart on Argentina - Year-over-year growth 2024-2029 (%)
Data Table on Argentina - Year-over-year growth 2024-2029 (%)

11.6.3 Colombia - Market size and forecast 2024-2029

Chart on Colombia - Market size and forecast 2024-2029 ($ million)
Data Table on Colombia - Market size and forecast 2024-2029 ($ million)
Chart on Colombia - Year-over-year growth 2024-2029 (%)
Data Table on Colombia - Year-over-year growth 2024-2029 (%)

11.7 Middle East and Africa - Market size and forecast 2024-2029

Chart on Middle East and Africa - Market size and forecast 2024-2029 ($ million)
Data Table on Middle East and Africa - Market size and forecast 2024-2029 ($ million)
Chart on Middle East and Africa - Year-over-year growth 2024-2029 (%)
Data Table on Middle East and Africa - Year-over-year growth 2024-2029 (%)
Chart on Regional Comparison - Middle East and Africa
Data Table on Regional Comparison - Middle East and Africa

11.7.1 UAE - Market size and forecast 2024-2029

Chart on UAE - Market size and forecast 2024-2029 ($ million)
Data Table on UAE - Market size and forecast 2024-2029 ($ million)
Chart on UAE - Year-over-year growth 2024-2029 (%)
Data Table on UAE - Year-over-year growth 2024-2029 (%)

11.7.2 Saudi Arabia - Market size and forecast 2024-2029

Chart on Saudi Arabia - Market size and forecast 2024-2029 ($ million)
Data Table on Saudi Arabia - Market size and forecast 2024-2029 ($ million)
Chart on Saudi Arabia - Year-over-year growth 2024-2029 (%)
Data Table on Saudi Arabia - Year-over-year growth 2024-2029 (%)

11.7.3 South Africa - Market size and forecast 2024-2029

Chart on South Africa - Market size and forecast 2024-2029 ($ million)
Data Table on South Africa - Market size and forecast 2024-2029 ($ million)
Chart on South Africa - Year-over-year growth 2024-2029 (%)
Data Table on South Africa - Year-over-year growth 2024-2029 (%)

11.7.4 Israel - Market size and forecast 2024-2029

Chart on Israel - Market size and forecast 2024-2029 ($ million)
Data Table on Israel - Market size and forecast 2024-2029 ($ million)
Chart on Israel - Year-over-year growth 2024-2029 (%)
Data Table on Israel - Year-over-year growth 2024-2029 (%)

11.7.5 Turkey - Market size and forecast 2024-2029

Chart on Turkey - Market size and forecast 2024-2029 ($ million)
Data Table on Turkey - Market size and forecast 2024-2029 ($ million)
Chart on Turkey - Year-over-year growth 2024-2029 (%)
Data Table on Turkey - Year-over-year growth 2024-2029 (%)

11.8 Market opportunity by geography

Market opportunity by geography ($ million)
Data Tables on Market opportunity by geography ($ million)

12. Drivers, Challenges, and Opportunity

12.1 Market drivers

Proliferation of generative AI and advanced natural language processing
Escalating demand for hyper-personalized patient journeys and proactive care
Imperative for operational efficiency and cost reduction in healthcare systems

12.2 Market challenges

Data privacy, security, and regulatory compliance
Integration complexity and interoperability with existing healthcare IT infrastructure
Ensuring clinical accuracy, mitigating bias, and gaining clinician trust

12.3 Impact of drivers and challenges

Impact of drivers and challenges in 2024 and 2029

12.4 Market opportunities

Emergence of empathetic and affective AI for holistic patient support
Hyper-automation across end-to-end patient journey
Convergence of AI with remote patient monitoring and digital therapeutics

13. Competitive Landscape

13.1 Overview

13.2

Overview on criticality of inputs and factors of differentiation

13.3 Landscape disruption

Overview on factors of disruption

13.4 Industry risks

Impact of key risks on business

14. Competitive Analysis

14.1 Companies profiled

Companies covered

14.2 Company ranking index

14.3 Market positioning of companies

Matrix on companies position and classification

14.4 Ada Health GmbH

Ada Health GmbH - Overview
Ada Health GmbH - Product / Service
Ada Health GmbH - Key offerings
SWOT

14.5 American Well Corp.

American Well Corp. - Overview
American Well Corp. - Product / Service
American Well Corp. - Key offerings
SWOT

14.6 Buoy Health Inc.

Buoy Health Inc. - Overview
Buoy Health Inc. - Product / Service
Buoy Health Inc. - Key offerings
SWOT

14.7 Clarify Health Solutions Inc.

Clarify Health Solutions Inc. - Overview
Clarify Health Solutions Inc. - Product / Service
Clarify Health Solutions Inc. - Key offerings
SWOT

14.8 COMMURE Inc.

COMMURE Inc. - Overview
COMMURE Inc. - Product / Service
COMMURE Inc. - Key offerings
SWOT

14.9 Health Catalyst Inc.

Health Catalyst Inc. - Overview
Health Catalyst Inc. - Business segments
Health Catalyst Inc. - Key offerings
Health Catalyst Inc. - Segment focus
SWOT

14.10 K Health

K Health - Overview
K Health - Product / Service
K Health - Key offerings
SWOT

14.11 Kyruus Inc.

Kyruus Inc. - Overview
Kyruus Inc. - Product / Service
Kyruus Inc. - Key offerings
SWOT

14.12 Orbita Inc.

Orbita Inc. - Overview
Orbita Inc. - Product / Service
Orbita Inc. - Key offerings
SWOT

14.13 PathAI Inc.

PathAI Inc. - Overview
PathAI Inc. - Product / Service
PathAI Inc. - Key offerings
SWOT

14.14 Qventus Inc.

Qventus Inc. - Overview
Qventus Inc. - Product / Service
Qventus Inc. - Key offerings
SWOT

14.15 Viz.ai Inc.

Viz.ai Inc. - Overview
Viz.ai Inc. - Product / Service
Viz.ai Inc. - Key offerings
SWOT

14.16 Welltok Inc.

Welltok Inc. - Overview
Welltok Inc. - Product / Service
Welltok Inc. - Key offerings
SWOT

14.17 ZocDoc Inc.

ZocDoc Inc. - Overview
ZocDoc Inc. - Product / Service
ZocDoc Inc. - Key offerings
SWOT

14.18 ZS Associates Inc.

ZS Associates Inc. - Overview
ZS Associates Inc. - Product / Service
ZS Associates Inc. - Key offerings
SWOT

15. Appendix

15.1 Scope of the report

Market definition
Objectives
Notes and caveats

15.2 Inclusions and exclusions checklist

Inclusions checklist
Exclusions checklist

15.3 Currency conversion rates for US$

15.4 Research methodology

15.5 Data procurement

Information sources

15.6 Data validation

15.7 Validation techniques employed for market sizing

15.8 Data synthesis

15.9 360 degree market analysis

15.10 List of abbreviations

Research Methodology

Technavio presents a detailed picture of the market by way of study, synthesis, and summation of data from multiple sources. The analysts have presented the various facets of the market with a particular focus on identifying the key industry influencers. The data thus presented is comprehensive, reliable, and the result of extensive research, both primary and secondary.

INFORMATION SOURCES

Primary sources

  • Manufacturers and suppliers
  • Channel partners
  • Industry experts
  • Strategic decision makers

Secondary sources

  • Industry journals and periodicals
  • Government data
  • Financial reports of key industry players
  • Historical data
  • Press releases

DATA ANALYSIS

Data Synthesis

  • Collation of data
  • Estimation of key figures
  • Analysis of derived insights

Data Validation

  • Triangulation with data models
  • Reference against proprietary databases
  • Corroboration with industry experts

REPORT WRITING

Qualitative

  • Market drivers
  • Market challenges
  • Market trends
  • Five forces analysis

Quantitative

  • Market size and forecast
  • Market segmentation
  • Geographical insights
  • Competitive landscape

Interested in this report?

Get your sample now to see our research methodology and insights!

Download Now

Frequently Asked Questions

AI In Patient Engagement Solutions market growth will increase by USD 8622.8 million during 2025-2029 .

The AI In Patient Engagement Solutions market is expected to grow at a CAGR of 17.9% during 2025-2029 .

AI In Patient Engagement Solutions market is segmented by Component (Software, Services, Hardware) Technology (NLP, Chatbots, Predictive analytics, Others) Type (Communication and reminders, Appointment scheduling and access, Health tracking and remote monitoring, Others)

Ada Health GmbH, American Well Corp., Buoy Health Inc., Clarify Health Solutions Inc., Clinithink Ltd., COMMURE Inc., Health Catalyst Inc., K Health, Kyruus Inc., Lark Technologies Inc., Orbita Inc., PathAI Inc., Prevencio, Qventus Inc., Sense.ly Corp., Viz.ai Inc., Welltok Inc., WiserCare, ZocDoc Inc., ZS Associates Inc. are a few of the key vendors in the AI In Patient Engagement Solutions market.

North America will register the highest growth rate of 39.2% among the other regions. Therefore, the AI In Patient Engagement Solutions market in North America is expected to garner significant business opportunities for the vendors during the forecast period.

US, Canada, Mexico, Germany, UK, France, Italy, Spain, The Netherlands, China, India, Japan, South Korea, Australia, Indonesia, Brazil, Argentina, Colombia, UAE, Saudi Arabia, South Africa, Israel, Turkey

  • Proliferation of generative AI and advanced natural language processing is the driving factor this market.

The AI In Patient Engagement Solutions market vendors should focus on grabbing business opportunities from the Component segment as it accounted for the largest market share in the base year.