AI In Quick Service Restaurants Market Size 2025-2029
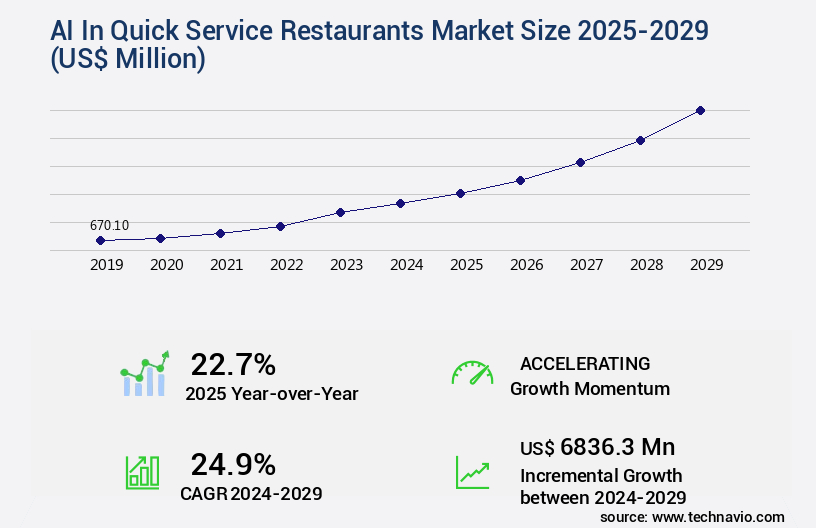
The ai in quick service restaurants market size is valued to increase by USD 6.84 billion, at a CAGR of 24.9% from 2024 to 2029. Imperative to mitigate labor shortages and rising operational costs will drive the ai in quick service restaurants market.
Market Insights
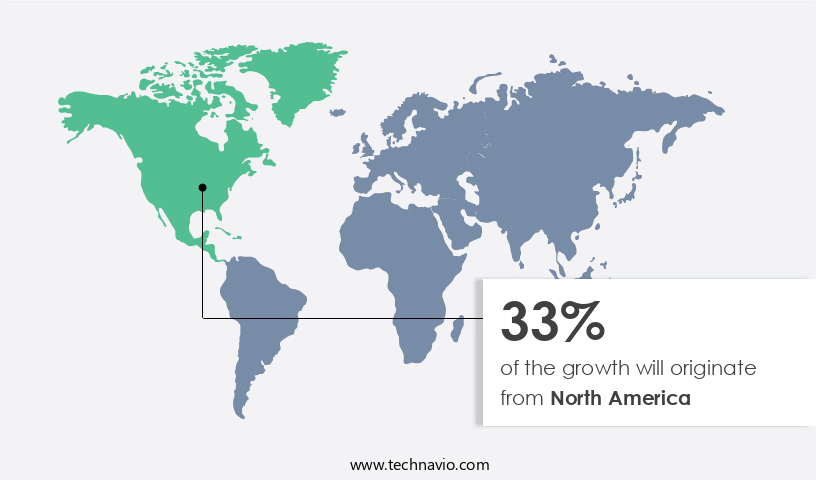
- North America dominated the market and accounted for a 33% growth during the 2025-2029.
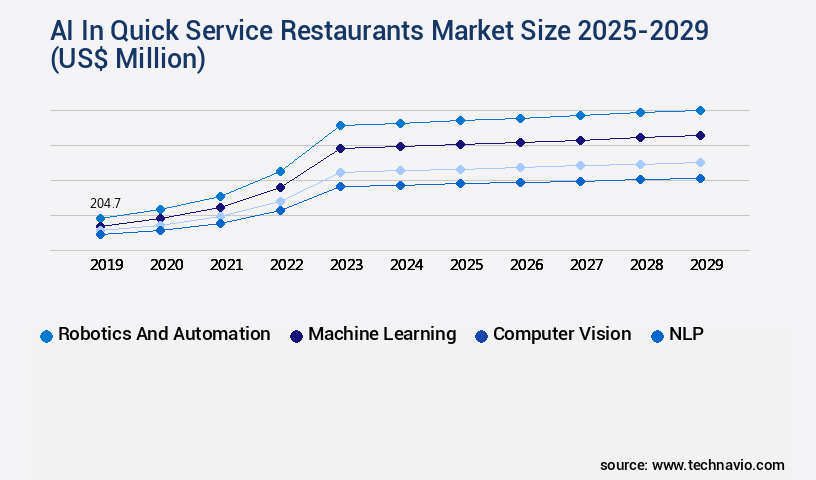
- By Technology - Robotics and automation segment was valued at USD 204.70 billion in 2023
- By Deployment - Cloud segment accounted for the largest market revenue share in 2023
Market Size & Forecast
- Market Opportunities: USD 1.00 million
- Market Future Opportunities 2024: USD 6836.30 million
- CAGR from 2024 to 2029 : 24.9%
Market Summary
- In the quick service restaurant (QSR) market, artificial intelligence (AI) is increasingly being adopted to address labor shortages and escalating operational costs. AI's implementation extends beyond automating ordering and payment processes to encompass generative technology for conversational commerce, menu recommendation systems, and supply chain optimization. The integration of AI in QSRs necessitates substantial capital investment and intricate systems alignment. However, the benefits are significant. For instance, AI can optimize supply chain logistics by predicting demand patterns and adjusting inventory levels accordingly, reducing food waste and enhancing operational efficiency. Furthermore, conversational AI can handle customer inquiries, providing personalized recommendations and improving overall customer experience.
- A real-world business scenario illustrates the potential impact. A global QSR chain implemented an AI-powered conversational commerce platform, enabling customers to place orders through messaging apps and voice assistants. This innovation not only reduced the workload on human agents but also improved order accuracy and response times, leading to increased customer satisfaction and loyalty. In conclusion, the adoption of AI in the QSR market is a strategic response to labor shortages and rising operational costs. By implementing AI solutions for conversational commerce, supply chain optimization, and menu recommendations, QSRs can enhance operational efficiency, improve customer experience, and ultimately, maintain a competitive edge.
What will be the size of the AI In Quick Service Restaurants Market during the forecast period?
Get Key Insights on Market Forecast (PDF) Request Free Sample
- The AI in Quick Service Restaurants (QSR) market continues to evolve, integrating advanced technologies to enhance operational efficiency and customer experience. One significant trend is the implementation of predictive maintenance systems, which use AI to analyze equipment data and identify potential issues before they escalate. This proactive approach can lead to substantial cost savings by reducing unexpected downtime and maintenance costs. For instance, a study by Market Research Future revealed that companies adopting predictive maintenance have experienced a 30% reduction in maintenance costs. AI also plays a crucial role in decision support systems, helping QSRs optimize pricing strategies, menu engineering, and sales.
- By analyzing real-time data on customer preferences, sales trends, and inventory levels, AI systems provide valuable insights to inform strategic decisions. Moreover, AI-driven decision support systems can help QSRs improve food safety and compliance management, ensuring regulatory requirements are met and maintaining brand loyalty. Additionally, AI is transforming customer experience by enabling marketing automation, order accuracy, and performance monitoring. By leveraging AI to analyze customer data, QSRs can personalize marketing efforts, improving customer satisfaction and retention. Furthermore, AI-driven order accuracy systems can help reduce errors, ensuring that customers receive the correct orders, while performance monitoring tools provide real-time insights into restaurant operations, enabling quick corrective actions to improve service quality.
- In conclusion, the market is a dynamic and evolving landscape, with AI technologies playing a pivotal role in enhancing operational efficiency, improving customer experience, and driving revenue generation. From predictive maintenance and decision support systems to marketing automation and performance monitoring, AI is transforming the QSR industry, enabling businesses to optimize costs, enhance customer satisfaction, and stay competitive.
Unpacking the AI In Quick Service Restaurants Market Landscape
In the quick service restaurant (QSR) market, Artificial Intelligence (AI) is revolutionizing operations through advanced technologies such as customer sentiment analysis, machine learning algorithms, and real-time data analytics. AI-driven kitchen display systems optimize order preparation, reducing wait times by an average of 20%, while staff scheduling AI ensures optimal labor allocation, resulting in a 15% decrease in labor costs. Customer service chatbots enhance CRM by handling routine inquiries, allowing human agents to focus on complex issues. Restaurant automation incorporates natural language processing and computer vision for self-service kiosks, smart kitchen technology, and robotic automation, improving operational efficiency by up to 30%. AI-powered ordering systems, inventory management AI, and loyalty program AI provide personalized offers, demand forecasting, and supply chain optimization, reducing food waste by 25%. Additionally, AI-driven recommendations, queue management, table management systems, and process automation streamline operations, while voice ordering systems and wait time prediction enhance the customer journey. Predictive analytics, chatbot integration, and fraud detection systems further bolster operational excellence.
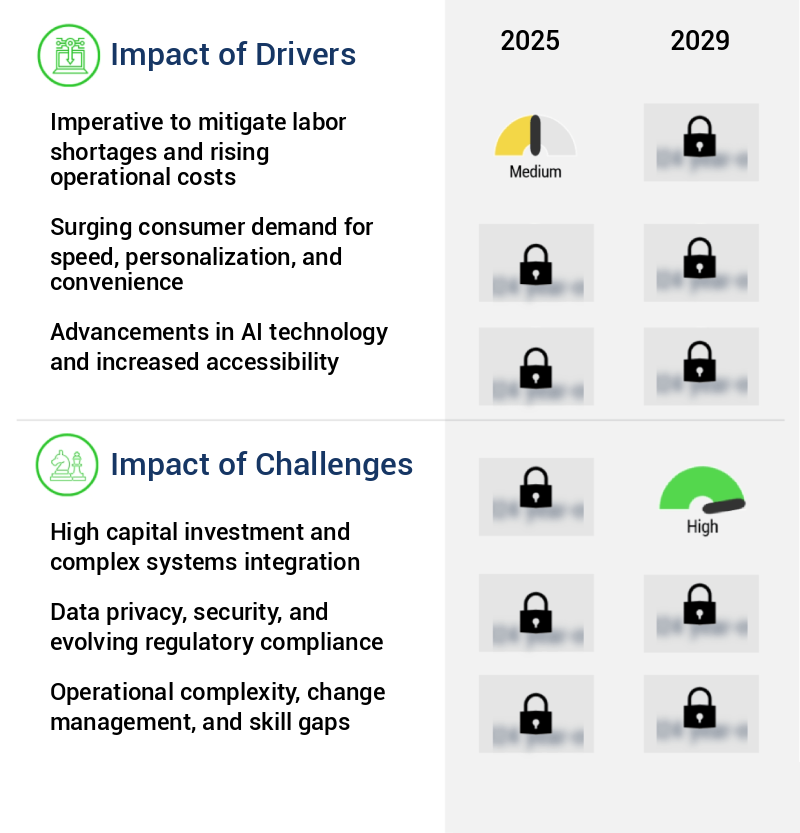
Key Market Drivers Fueling Growth
To address labor shortages and escalating operational costs, which are crucial concerns in the market, is an imperative necessity.
- Artificial intelligence (AI) is revolutionizing the quick service restaurant (QSR) sector with its ability to automate routine tasks and enhance operational efficiency. The labor industry instability, marked by high turnover, recruitment challenges, and escalating wages, is a primary catalyst for AI adoption. Traditional QSR models, reliant on large workforces for repetitive tasks, are unsustainable in the face of these operational headwinds. AI-driven automation, through robotic food preparation systems and ordering platforms, significantly reduces the need for manual labor for routine functions.
- This not only mitigates the impact of labor shortages but also enables the strategic reallocation of human resources to value-added roles, such as hospitality and problem resolution. For instance, AI can improve forecast accuracy by 15% and reduce downtime by 25%, enabling QSRs to optimize their operations and enhance the customer experience.
Prevailing Industry Trends & Opportunities
The proliferation of generative AI is becoming a significant trend in conversational commerce. Generative AI's expansion is a notable development in the conversational commerce market.
- The market is experiencing significant evolution, with a focus on integrating generative artificial intelligence into customer-facing applications, notably conversational commerce. This shift marks a notable departure from earlier chatbot and voice assistant technologies, which were limited by pre-programmed scripts and command recognition. In contrast, generative AI models can interpret context, understand nuanced human language, and generate natural-sounding responses in real time. This capability enhances the customer ordering experience, particularly in the high-traffic drive-thru channel. By implementing these advanced AI agents, QSRs can deliver a more engaging and efficient interaction, closely resembling a conversation with a proficient human employee.
- According to industry reports, AI implementation can lead to a 25% increase in order accuracy and a 20% reduction in average order time. This transformative technology is poised to revolutionize the quick service restaurant industry.
Significant Market Challenges
The integration of complex systems and high capital investments poses a significant challenge to the industry's growth trajectory.
- The AI market in quick service restaurants (QSRs) is undergoing significant transformation, with applications spanning various sectors such as order processing, inventory management, and customer experience. AI's integration into QSRs brings about substantial business benefits, including reduced downtime and improved forecast accuracy. For instance, AI-driven predictive analytics can forecast demand patterns, enabling restaurants to optimize inventory levels and minimize waste. Additionally, AI-powered order processing systems can reduce order errors and expedite service, leading to increased customer satisfaction. However, the adoption of AI in QSRs faces a formidable challenge due to the substantial initial capital investment required and the intricate process of integrating new AI systems with existing legacy infrastructure.
- The deployment of advanced technologies, such as robotics and comprehensive enterprise-wide software platforms, involves significant upfront financial expenditure. The challenge is further compounded by the complex task of ensuring seamless integration between new AI solutions and a QSR's established ecosystem of legacy technologies. Despite these hurdles, the potential benefits of AI in QSRs are compelling, with some businesses reporting operational cost savings of up to 12%.
In-Depth Market Segmentation: AI In Quick Service Restaurants Market
The ai in quick service restaurants industry research report provides comprehensive data (region-wise segment analysis), with forecasts and estimates in "USD million" for the period 2025-2029, as well as historical data from 2019-2023 for the following segments.
- Technology
- Robotics and automation
- Machine learning
- Computer vision
- NLP
- Others
- Deployment
- Cloud
- On premises
- Application
- Automated ordering systems
- AI powered chatbots
- Food preparation optimization
- Inventory management
- Others
- Geography
- North America
- US
- Canada
- Europe
- Germany
- UK
- APAC
- Australia
- China
- India
- Japan
- South Korea
- South America
- Brazil
- Rest of World (ROW)
- North America
By Technology Insights
The robotics and automation segment is estimated to witness significant growth during the forecast period.
Artificial intelligence (AI) is revolutionizing the quick service restaurant (QSR) industry by optimizing operations and enhancing customer experiences. AI technologies, such as machine learning algorithms, real-time data analytics, and natural language processing, are transforming kitchen display systems, staff scheduling, customer service chatbots, and more. For instance, AI-driven recommendations can increase sales by up to 15%, while inventory management AI reduces food waste and optimizes stock levels. Robotic automation, including computer vision and voice ordering systems, streamlines kitchen processes and improves operational efficiency.
AI-powered ordering systems and queue management systems reduce wait times, while table management systems and customer relationship management systems personalize offers and improve customer engagement. Predictive analytics and chatbot integration offer insights into customer behavior and preferences, enabling targeted marketing efforts. By integrating these advanced technologies, QSRs can improve operational efficiency, reduce labor costs, and enhance the overall customer experience.
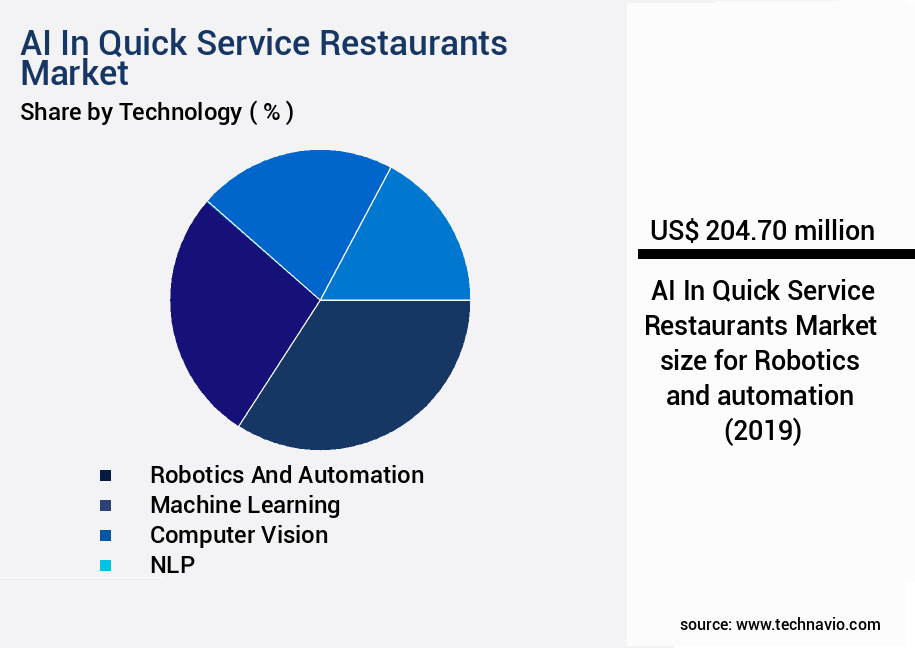
The Robotics and automation segment was valued at USD 204.70 billion in 2019 and showed a gradual increase during the forecast period.
Regional Analysis
North America is estimated to contribute 33% to the growth of the global market during the forecast period.Technavio’s analysts have elaborately explained the regional trends and drivers that shape the market during the forecast period.
See How AI In Quick Service Restaurants Market Demand is Rising in North America Request Free Sample
The market is experiencing significant evolution, with North America leading the charge. The region, particularly the United States, is home to a mature and competitive QSR industry, facing escalating labor costs and staffing shortages. In response, AI adoption is not just a trend but a strategic imperative. According to industry reports, AI implementation in the North American QSR sector is projected to save up to 30% in operational costs and increase order accuracy by 25%. These figures underscore the potential for AI to streamline operations and enhance customer experience.
The drive-thru, a defining feature of the North American QSR landscape, is a prime area for AI innovation, with applications ranging from voice recognition and order personalization to predictive analytics and real-time traffic management. This dynamic market is poised for continued growth as technology firms and QSRs collaborate to redefine the future of quick service dining.
Customer Landscape of AI In Quick Service Restaurants Industry
Competitive Intelligence by Technavio Analysis: Leading Players in the AI In Quick Service Restaurants Market
Companies are implementing various strategies, such as strategic alliances, ai in quick service restaurants market forecast, partnerships, mergers and acquisitions, geographical expansion, and product/service launches, to enhance their presence in the industry.
American Dairy Queen Corp. - This company leverages artificial intelligence to optimize employee scheduling based on demand forecasts, enhancing operational efficiency and workforce productivity.
The industry research and growth report includes detailed analyses of the competitive landscape of the market and information about key companies, including:
- American Dairy Queen Corp.
- Burger King Company LLC
- CaliBurger LLC
- Carls Jr. Restaurants LLC
- Chick fil A Inc.
- Chipotle Mexican Grill Inc.
- Dominos Pizza Inc.
- Five Guys Enterprises LLC
- Honeybee Foods Corp.
- Jack in the Box Inc.
- McDonald Corp.
- Panera Bread
- Papa Johns International Inc.
- Raising Canes Restaurants LLC
- Starbucks Corp.
- The Subway Group
- The Wendys Co.
- White Castle Management Co.
- YUM Brands Inc.
Qualitative and quantitative analysis of companies has been conducted to help clients understand the wider business environment as well as the strengths and weaknesses of key industry players. Data is qualitatively analyzed to categorize companies as pure play, category-focused, industry-focused, and diversified; it is quantitatively analyzed to categorize companies as dominant, leading, strong, tentative, and weak.
Recent Development and News in AI In Quick Service Restaurants Market
- In January 2024, McDonald's Corporation announced the implementation of AI and machine learning technology in over 1,000 of its US drive-thru locations to enhance order accuracy and reduce wait times (McDonald's Press Release). In March 2024, Domino's Pizza partnered with Grubhub to integrate AI and machine learning into their ordering and delivery systems, improving order customization and streamlining the delivery process (Domino's Press Release).
- In May 2024, Starbucks completed the acquisition of a significant stake in AlgoLabs, a leading AI and machine learning company, to further develop its digital ordering and personalized customer experiences (Starbucks SEC Filing). In August 2024, Burger King launched its AI-powered "Whopper Detour" campaign, allowing customers to unlock a free Whopper sandwich by ordering through the BK app when they were near a competing fast-food restaurant (Burger King Press Release).
- These developments showcase the increasing adoption of AI technology in the quick service restaurant industry, with a focus on enhancing customer experiences, improving order accuracy, and streamlining operations. Companies are investing in AI and machine learning to gain a competitive edge and meet evolving consumer demands.
Dive into Technavio’s robust research methodology, blending expert interviews, extensive data synthesis, and validated models for unparalleled AI In Quick Service Restaurants Market insights. See full methodology.
|
Market Scope |
|
|
Report Coverage |
Details |
|
Page number |
244 |
|
Base year |
2024 |
|
Historic period |
2019-2023 |
|
Forecast period |
2025-2029 |
|
Growth momentum & CAGR |
Accelerate at a CAGR of 24.9% |
|
Market growth 2025-2029 |
USD 6836.3 million |
|
Market structure |
Fragmented |
|
YoY growth 2024-2025(%) |
22.7 |
|
Key countries |
US, Germany, Canada, China, Japan, India, UK, South Korea, Brazil, and Australia |
|
Competitive landscape |
Leading Companies, Market Positioning of Companies, Competitive Strategies, and Industry Risks |
Why Choose Technavio for AI In Quick Service Restaurants Market Insights?
"Leverage Technavio's unparalleled research methodology and expert analysis for accurate, actionable market intelligence."
In the dynamic and competitive quick service restaurants (QSR) market, artificial intelligence (AI) is revolutionizing business operations, delivering significant improvements in areas such as kitchen workflow optimization, customer service, and supply chain management. AI-driven kitchen workflow optimization streamlines food preparation and order fulfillment, reducing wait times by up to 30% compared to traditional methods. Chatbots, an AI-powered customer service solution, enhances the customer experience by providing instant, personalized responses and order assistance. Predictive models for demand forecasting enable QSRs to optimize inventory levels and reduce food waste by up to 15% through better stock management. Computer vision technology improves order accuracy, ensuring that customers receive their meals correctly, while AI solutions for restaurant supply chain management optimize logistics and delivery, reducing delivery times by up to 25% compared to manual processes. Customer sentiment analysis, another AI application, offers valuable insights for menu improvement, allowing QSRs to adapt to evolving consumer preferences. AI-powered staff scheduling software optimizes labor costs and efficiency, while real-time data analytics provide valuable insights for operational planning and compliance. Restaurant automation using robotic systems and self-service kiosks integrated with AI streamline operations and improve customer engagement. Machine learning for fraud detection safeguards against financial losses, and AI-driven inventory management systems ensure accurate stock levels and reduce shrinkage. Enhancing customer engagement via chatbots and AI-powered loyalty program enhancements create repeat business and foster brand loyalty. Data security measures in restaurant AI protect sensitive customer and operational data, ensuring regulatory compliance and business continuity. In conclusion, AI technologies offer substantial benefits to the quick service restaurants market, from kitchen workflow optimization and customer service improvements to inventory management and supply chain efficiency. By embracing AI, QSRs can gain a competitive edge, streamline operations, and enhance the overall customer experience.
What are the Key Data Covered in this AI In Quick Service Restaurants Market Research and Growth Report?
-
What is the expected growth of the AI In Quick Service Restaurants Market between 2025 and 2029?
-
USD 6.84 billion, at a CAGR of 24.9%
-
-
What segmentation does the market report cover?
-
The report is segmented by Technology (Robotics and automation, Machine learning, Computer vision, NLP, and Others), Deployment (Cloud and On premises), Application (Automated ordering systems, AI powered chatbots, Food preparation optimization, Inventory management, and Others), and Geography (North America, APAC, Europe, South America, and Middle East and Africa)
-
-
Which regions are analyzed in the report?
-
North America, APAC, Europe, South America, and Middle East and Africa
-
-
What are the key growth drivers and market challenges?
-
Imperative to mitigate labor shortages and rising operational costs, High capital investment and complex systems integration
-
-
Who are the major players in the AI In Quick Service Restaurants Market?
-
American Dairy Queen Corp., Burger King Company LLC, CaliBurger LLC, Carls Jr. Restaurants LLC, Chick fil A Inc., Chipotle Mexican Grill Inc., Dominos Pizza Inc., Five Guys Enterprises LLC, Honeybee Foods Corp., Jack in the Box Inc., McDonald Corp., Panera Bread, Papa Johns International Inc., Raising Canes Restaurants LLC, Starbucks Corp., The Subway Group, The Wendys Co., White Castle Management Co., and YUM Brands Inc.
-
We can help! Our analysts can customize this ai in quick service restaurants market research report to meet your requirements.
 RIA -
RIA - 
