AI In Tax And Legal Advisory Market Analysis, Size, and Forecast 2025-2029: North America (US, Canada, and Mexico), Europe (Germany, UK, and France), APAC (China, Japan, and India), Middle East and Africa (UAE, Saudi Arabia, and South Africa), South America (Brazil, Argentina, and Colombia), and Rest of World (ROW)

AI In Tax And Legal Advisory Market Analysis, Size, and Forecast 2025-2029:
North America (US, Canada, and Mexico), Europe (Germany, UK, and France), APAC (China, Japan, and India), Middle East and Africa (UAE, Saudi Arabia, and South Africa), South America (Brazil, Argentina, and Colombia), and Rest of World (ROW)

Published: Dec 2025 308 Pages SKU: IRTNTR81104

Market Overview at a Glance

$4.44 B
Market Opportunity
14.7%
CAGR 2024 - 2029
40.4%
North America Growth
$2.92 B
Solutions segment 2023

AI In Tax And Legal Advisory Market Size 2025-2029

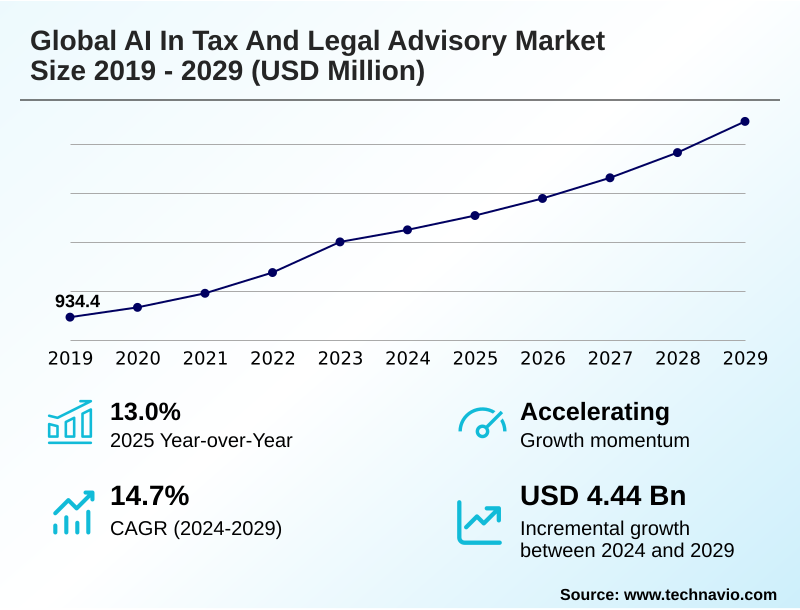
The ai in tax and legal advisory market size is valued to increase by USD 4.44 billion, at a CAGR of 14.7% from 2024 to 2029. Increasing complexity of legal and tax regulations will drive the ai in tax and legal advisory market.

Major Market Trends & Insights

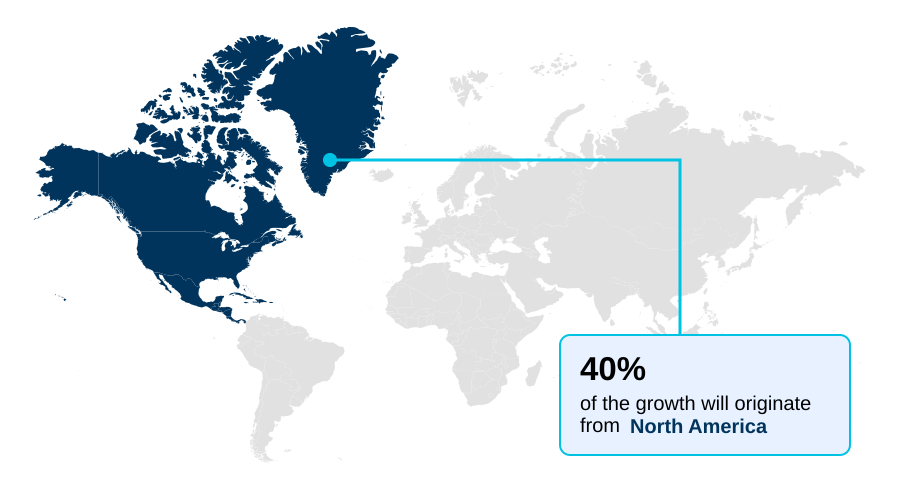
  • North America dominated the market and accounted for a 40.4% growth during the forecast period.
  • By Component - Solutions segment was valued at USD 2.92 billion in 2023
  • By Application - Legal research and analytics segment accounted for the largest market revenue share in 2023

Market Size & Forecast

  • Market Opportunities: USD 8.01 billion
  • Market Future Opportunities: USD 4.44 billion
  • CAGR from 2024 to 2029 : 14.7%

Market Summary

  • The AI in tax and legal advisory market is rapidly evolving, driven by the dual pressures of increasing regulatory complexity and the demand for greater operational efficiency. The exponential growth of digital data has rendered manual processes for tasks like e-discovery and document review insufficient.
  • This has paved the way for advanced solutions leveraging natural language processing and machine learning algorithms. Key trends, such as the rise of generative AI legal drafting and the hyper-personalization of services, are reshaping professional workflows.
  • For instance, a corporate legal department can deploy an AI platform for contract lifecycle management that not only automates drafting but also performs continuous regulatory compliance monitoring, flagging non-compliant clauses in real-time. This proactive risk mitigation, which was previously unfeasible, demonstrates the technology's transformative potential.
  • However, adoption is tempered by significant challenges, including data privacy in AI and the difficulty of AI integration with legacy systems. Addressing the AI talent gap in legal is also critical for firms to fully harness the strategic benefits of these technologies and move beyond simple automation to intelligent, data-driven advisory.

What will be the Size of the AI In Tax And Legal Advisory Market during the forecast period?

Get Key Insights on Market Forecast (PDF) Request Free Sample

How is the AI In Tax And Legal Advisory Market Segmented?

The ai in tax and legal advisory industry research report provides comprehensive data (region-wise segment analysis), with forecasts and estimates in "USD million" for the period 2025-2029, as well as historical data from 2019-2023 for the following segments.

  • Component
    • Solutions
    • Services
  • Application
    • Legal research and analytics
    • E-discovery and document review
    • Tax compliance and reporting
    • Contract management and drafting
    • Others
  • End-user
    • Law firms
    • Corporate legal/tax departments
    • Alternative service providers
    • Public sector/judiciary
  • Geography
    • North America
      • US
      • Canada
      • Mexico
    • Europe
      • Germany
      • UK
      • France
    • APAC
      • China
      • Japan
      • India
    • Middle East and Africa
      • UAE
      • Saudi Arabia
      • South Africa
    • South America
      • Brazil
      • Argentina
      • Colombia
    • Rest of World (ROW)

By Component Insights

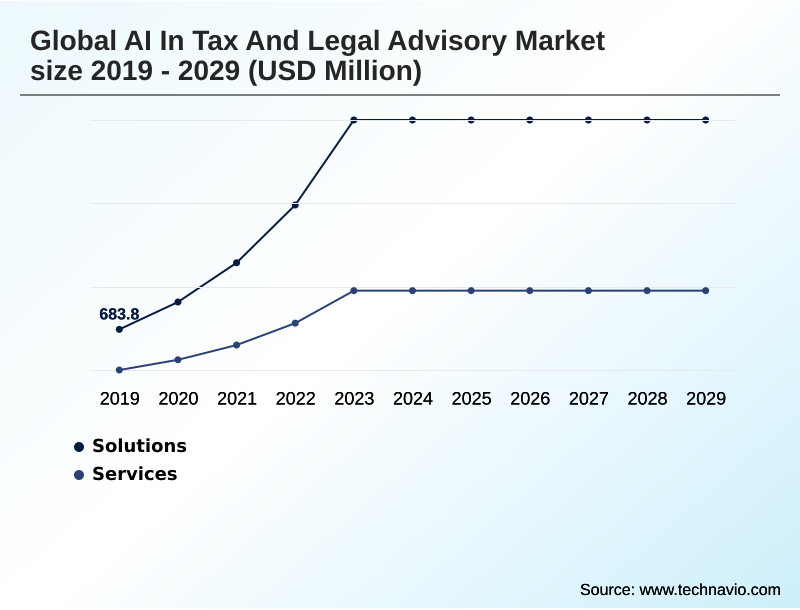
The solutions segment is estimated to witness significant growth during the forecast period.

The solutions segment encompasses software platforms utilizing natural language processing and machine learning algorithms to transform legal and tax operations.

These tools facilitate intelligent document analysis for tasks like e-discovery and document review and AI for due diligence, significantly reducing manual effort. Through robotic process automation, routine workflows such as data entry for tax provision automation are streamlined, enhancing accuracy.

Key applications include contract lifecycle management from creation to expiration and AI-assisted legal research platforms that provide deep analytical insights. These solutions are designed for seamless integration, enabling professionals to leverage sophisticated analytics without extensive technical expertise.

For example, AI-powered analysis platforms have demonstrated the ability to reduce document review times by up to 50%.

Request Free Sample

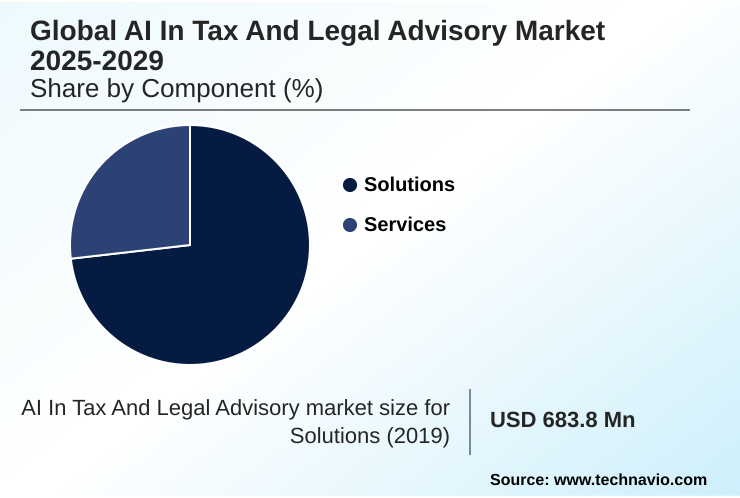
The Solutions segment was valued at USD 2.92 billion in 2023 and showed a gradual increase during the forecast period.

Request Free Sample

Regional Analysis

North America is estimated to contribute 40.4% to the growth of the global market during the forecast period.Technavio’s analysts have elaborately explained the regional trends and drivers that shape the market during the forecast period.

See How AI In Tax And Legal Advisory Market Demand is Rising in North America Request Free Sample

The geographic landscape of the AI in tax and legal advisory market is led by North America, which accounts for over 40% of the incremental growth, driven by early adoption and a mature professional services sector.

Europe follows, with a strong focus on data privacy influencing solution design. Meanwhile, the APAC region is projected to be the fastest-growing, with a regional CAGR of 15.3%, fueled by rapid digitalization and the need for AI for multi-jurisdictional compliance.

Applications such as AI-powered e-discovery are gaining global traction, with firms reporting up to a 60% reduction in document review times.

This demonstrates a clear business case for deploying tools for predictive litigation analytics and tax audit prediction models to manage risk and improve outcomes across diverse legal and regulatory environments.

Market Dynamics

Our researchers analyzed the data with 2024 as the base year, along with the key drivers, trends, and challenges. A holistic analysis of drivers will help companies refine their marketing strategies to gain a competitive advantage.

  • The strategic adoption of AI for tax and legal advisory is reshaping professional services by delivering tangible efficiency gains and deeper analytical capabilities. How AI improves tax compliance is evident through solutions that automate complex filings and cross-reference regulations, drastically reducing error rates.
  • For legal professionals, AI in legal research tools and AI-powered platforms for legal research provide access to insights that were previously unattainable, synthesizing vast amounts of case law in minutes. The benefits of AI in e-discovery are particularly pronounced, with platforms using natural language processing for e-discovery reducing review timelines by more than half compared to manual methods.
  • Generative AI for drafting legal contracts and AI for contract drafting automation are moving beyond templates to create bespoke, compliant agreements. Firms are leveraging AI for automating corporate tax provisions and using machine learning in contract risk analysis to proactively manage financial and legal exposure.
  • AI solutions for legal research efficiency are becoming a competitive necessity, while AI-driven tax compliance for multinationals helps navigate complex cross-border regulations. As the industry evolves, the focus is shifting toward predictive analytics for litigation outcomes, ethical AI deployment in legal services, and hyper-personalized tax planning using AI to deliver unprecedented value.
  • Even challenges like integrating AI with legacy legal software are being addressed with more flexible, cloud-native platforms.

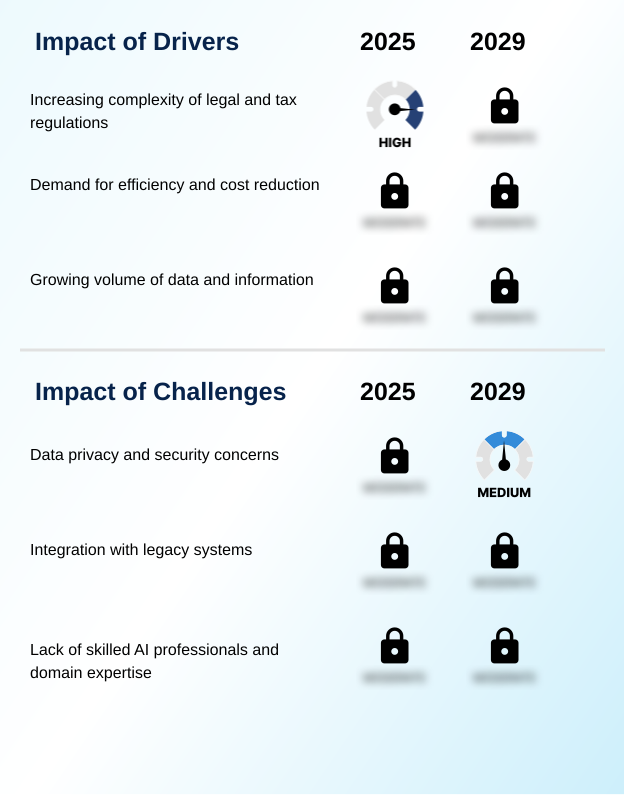
What are the key market drivers leading to the rise in the adoption of AI In Tax And Legal Advisory Industry?

  • The increasing complexity of global legal and tax regulations serves as a key driver for the adoption of AI solutions in the advisory market.

  • Market growth is primarily driven by the increasing complexity of regulations, making regulatory compliance monitoring a critical function. AI solutions that provide continuous AI for legislative tracking can reduce non-compliance risk by over 70%.
  • The relentless demand for efficiency also fuels adoption, with tax compliance automation and AI-powered e-discovery platforms reducing manual labor costs by more than 50% in some use cases.
  • Furthermore, the exponential growth in data volume necessitates AI for case law analysis and automated data processing, as these systems can handle data sets 100 times larger than manual methods.
  • This enables more effective AI-driven tax planning and allows for precise automated clause extraction from thousands of documents simultaneously, turning vast information streams into actionable intelligence.

What are the market trends shaping the AI In Tax And Legal Advisory Industry?

  • The rise of generative AI and large language models (LLMs) represents a transformative market trend. These advanced systems are fundamentally reshaping document creation, research, and analysis for legal and tax professionals.

  • Key market trends are reshaping advisory services, led by the rise of generative AI legal drafting and natural language generation. These technologies automate up to 40% of routine document creation, allowing professionals to focus on strategic AI-powered negotiation tools.
  • Another significant trend is hyper-personalization in legal services, where AI for risk assessment models analyze client-specific data to provide tailored advice, which has been shown to improve client satisfaction scores by 20%. This is driving demand for sophisticated legal chatbot development.
  • Concurrently, there is a growing emphasis on ethical AI frameworks, ensuring that the deployment of these powerful systems is transparent, fair, and accountable, a crucial consideration for maintaining client trust and regulatory compliance in sensitive legal and tax matters.

What challenges does the AI In Tax And Legal Advisory Industry face during its growth?

  • Data privacy and security concerns represent a key challenge affecting the growth and adoption of AI within the tax and legal advisory industry.

  • Significant challenges temper market growth, foremost being data privacy and security. Implementing robust data anonymization techniques and ensuring compliance with regulations can comprise up to 25% of a project's budget. Another hurdle is AI integration with legacy systems, a complex process that over 60% of firms identify as their primary technical barrier, requiring highly interoperable AI solutions.
  • Furthermore, a persistent AI talent gap in legal and tax fields makes it difficult to deploy and manage these systems effectively.
  • This shortage of professionals with expertise in both AI and domain-specific AI models slows adoption and hampers the ability to ensure proper governance, including algorithmic bias detection and AI explainability in law, which are critical for building trust and ensuring reliable outcomes.

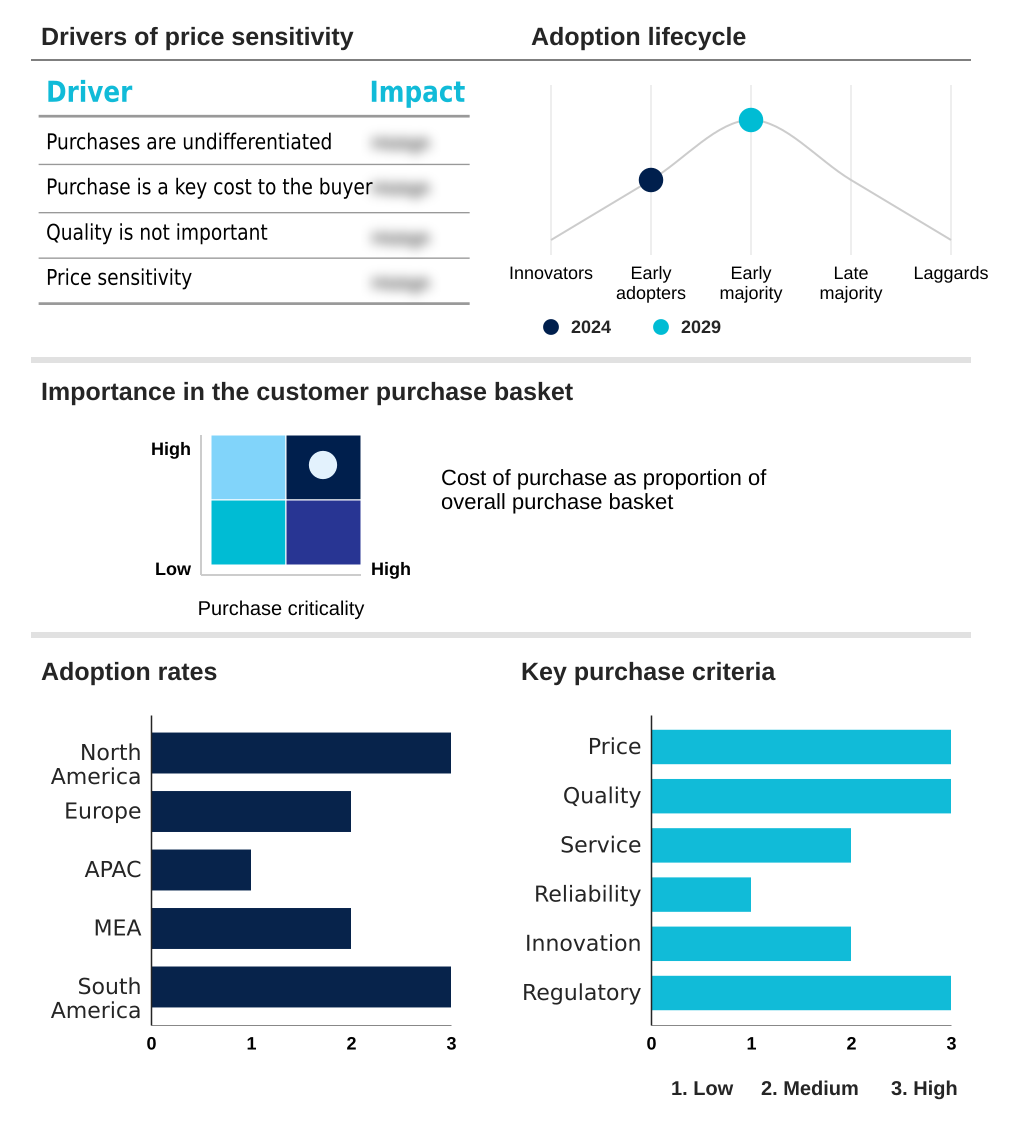
Exclusive Technavio Analysis on Customer Landscape

The ai in tax and legal advisory market forecasting report includes the adoption lifecycle of the market, covering from the innovator’s stage to the laggard’s stage. It focuses on adoption rates in different regions based on penetration. Furthermore, the ai in tax and legal advisory market report also includes key purchase criteria and drivers of price sensitivity to help companies evaluate and develop their market growth analysis strategies.

Customer Landscape of AI In Tax And Legal Advisory Industry

Competitive Landscape

Companies are implementing various strategies, such as strategic alliances, ai in tax and legal advisory market forecast, partnerships, mergers and acquisitions, geographical expansion, and product/service launches, to enhance their presence in the industry.

Avalara Inc. - AI-driven tax compliance automation and intelligent research platforms provide data-infused insights, enhancing advisory services by streamlining complex tax and legal workflows for professionals.

The industry research and growth report includes detailed analyses of the competitive landscape of the market and information about key companies, including:

  • Avalara Inc.
  • Bloomberg Tax
  • Blue J Legal
  • Counsel AI Corp.
  • Deloitte Touche Tohmatsu Ltd.
  • Ernst and Young Global Ltd.
  • Intuit Inc.
  • Ironclad Inc.
  • Kintsugi
  • KPMG International Ltd.
  • Legora
  • LexisNexis Legal and Professional
  • Luminance Technologies Ltd.
  • PricewaterhouseCoopers LLP
  • Robin AI Ltd.
  • Spellbook
  • Sphere
  • TaxGPT
  • Thomson Reuters Corp.
  • Wolters Kluwer NV

Qualitative and quantitative analysis of companies has been conducted to help clients understand the wider business environment as well as the strengths and weaknesses of key industry players. Data is qualitatively analyzed to categorize companies as pure play, category-focused, industry-focused, and diversified; it is quantitatively analyzed to categorize companies as dominant, leading, strong, tentative, and weak.

Recent Development and News in Ai in tax and legal advisory market

  • In September 2024, Thomson Reuters Corp. announced a partnership with a leading cloud provider to integrate advanced generative AI into its CoCounsel platform, enhancing its AI-native agentic applications for tax and legal professionals.
  • In November 2024, Wolters Kluwer NV launched VitalLaw AI, a new generative AI-powered tool within its legal research platform designed to provide conversational search and drafting assistance for legal practitioners.
  • In January 2025, LexisNexis Legal & Professional acquired a legal tech startup specializing in predictive analytics, aiming to bolster its Lexis+ AI suite with enhanced litigation outcome forecasting capabilities.
  • In March 2025, Deloitte Touche Tohmatsu Ltd. and PricewaterhouseCoopers LLP announced a joint initiative to establish an ethical framework for generative AI use in tax advisory, responding to growing regulatory scrutiny.

Dive into Technavio’s robust research methodology, blending expert interviews, extensive data synthesis, and validated models for unparalleled AI In Tax And Legal Advisory Market insights. See full methodology.

Market Scope
Page number 308
Base year 2024
Historic period 2019-2023
Forecast period 2025-2029
Growth momentum & CAGR Accelerate at a CAGR of 14.7%
Market growth 2025-2029 USD 4436.2 million
Market structure Fragmented
YoY growth 2024-2025(%) 13.0%
Key countries US, Canada, Mexico, Germany, UK, France, Italy, Spain, The Netherlands, China, Japan, India, Australia, South Korea, Indonesia, UAE, Saudi Arabia, South Africa, Israel, Turkey, Brazil, Argentina and Colombia
Competitive landscape Leading Companies, Market Positioning of Companies, Competitive Strategies, and Industry Risks

Request Free Sample

Research Analyst Overview

  • The market is defined by the integration of core technologies like natural language processing and machine learning algorithms into professional workflows. Robotic process automation handles routine tasks in tax provision automation, while natural language generation powers generative AI legal drafting.
  • This trend presents a boardroom dilemma: balancing the adoption of innovative tools for AI-powered negotiation tools and legal chatbot development with the need for robust ethical AI frameworks and algorithmic bias detection. Firms are implementing AI-enhanced advisory services for contract lifecycle management and intelligent document analysis, with some achieving over a 60% reduction in e-discovery and document review time.
  • Key applications include tax compliance automation, predictive litigation analytics, and legal research automation. Solutions now offer AI-powered e-discovery, AI-assisted legal research, and AI-driven tax planning. The focus extends to specialized areas like AI for ip management, AI in dispute resolution, and AI for case law analysis.
  • Advanced features such as automated clause extraction, automated redaction tools, and AI for legislative tracking are becoming standard. This evolution is supported by data anonymization techniques and effective AI-based compliance checks for regulatory compliance monitoring, enabling sophisticated AI for risk assessment and AI for due diligence.

What are the Key Data Covered in this AI In Tax And Legal Advisory Market Research and Growth Report?

  • What is the expected growth of the AI In Tax And Legal Advisory Market between 2025 and 2029?

    • USD 4.44 billion, at a CAGR of 14.7%

  • What segmentation does the market report cover?

    • The report is segmented by Component (Solutions, and Services), Application (Legal research and analytics, E-discovery and document review, Tax compliance and reporting, Contract management and drafting, and Others), End-user (Law firms, Corporate legal/tax departments, Alternative service providers, and Public sector/judiciary) and Geography (North America, Europe, APAC, Middle East and Africa, South America)

  • Which regions are analyzed in the report?

    • North America, Europe, APAC, Middle East and Africa and South America

  • What are the key growth drivers and market challenges?

    • Increasing complexity of legal and tax regulations, Data privacy and security concerns

  • Who are the major players in the AI In Tax And Legal Advisory Market?

    • Avalara Inc., Bloomberg Tax, Blue J Legal, Counsel AI Corp., Deloitte Touche Tohmatsu Ltd., Ernst and Young Global Ltd., Intuit Inc., Ironclad Inc., Kintsugi, KPMG International Ltd., Legora, LexisNexis Legal and Professional, Luminance Technologies Ltd., PricewaterhouseCoopers LLP, Robin AI Ltd., Spellbook, Sphere, TaxGPT, Thomson Reuters Corp. and Wolters Kluwer NV

Market Research Insights

  • The market is shaped by a push for digital transformation in law, with tax technology solutions becoming standard. AI in legal operations is no longer a niche, as firms leveraging AI-driven workflow automation report efficiency gains of over 30%.
  • The focus of legal tech innovation is on practical applications, from AI-powered contract intelligence platforms to AI-based contract drafting tools that reduce drafting time by half. AI for corporate legal departments and alternative service providers is crucial, especially with the rise of managed legal services AI.
  • AI for regulatory technology and tax fraud detection are critical for compliance, while AI-driven financial advisory and AI for wealth management offer hyper-personalized client services, improving client retention by up to 15%. Even public sector judiciary bodies are exploring AI-powered legal assistants to clear backlogs, while interoperable AI solutions address integration challenges.

We can help! Our analysts can customize this ai in tax and legal advisory market research report to meet your requirements.

Get in touch

1. Executive Summary

1.1 Market overview

Executive Summary - Chart on Market Overview
Executive Summary - Data Table on Market Overview
Executive Summary - Chart on Global Market Characteristics
Executive Summary - Chart on Market by Geography
Executive Summary - Chart on Market Segmentation by Component
Executive Summary - Chart on Market Segmentation by Application
Executive Summary - Chart on Market Segmentation by End-user
Executive Summary - Chart on Incremental Growth
Executive Summary - Data Table on Incremental Growth
Executive Summary - Chart on Company Market Positioning

2. Technavio Analysis

2.1 Analysis of price sensitivity, lifecycle, customer purchase basket, adoption rates, and purchase criteria

2.2 Criticality of inputs and Factors of differentiation

Chart on Overview on criticality of inputs and factors of differentiation

2.3 Factors of disruption

Chart on Overview on factors of disruption

2.4 Impact of drivers and challenges

Chart on Impact of drivers and challenges in 2024 and 2029

3. Market Landscape

3.1 Market ecosystem

Chart on Parent Market
Data Table on - Parent Market

3.2 Market characteristics

Chart on Market characteristics analysis

3.3 Value chain analysis

Chart on Value chain analysis

4. Market Sizing

4.1 Market definition

Data Table on Offerings of companies included in the market definition

4.2 Market segment analysis

Market segments

4.3 Market size 2024

4.4 Market outlook: Forecast for 2024-2029

Chart on Global - Market size and forecast 2024-2029 ($ million)
Data Table on Global - Market size and forecast 2024-2029 ($ million)
Chart on Global Market: Year-over-year growth 2024-2029 (%)
Data Table on Global Market: Year-over-year growth 2024-2029 (%)

5. Historic Market Size

5.1 Global AI In Tax And Legal Advisory Market 2019 - 2023

Historic Market Size - Data Table on Global AI In Tax And Legal Advisory Market 2019 - 2023 ($ million)

5.2 Component segment analysis 2019 - 2023

Historic Market Size - Component Segment 2019 - 2023 ($ million)

5.3 Application segment analysis 2019 - 2023

Historic Market Size - Application Segment 2019 - 2023 ($ million)

5.4 End-user segment analysis 2019 - 2023

Historic Market Size - End-user Segment 2019 - 2023 ($ million)

5.5 Geography segment analysis 2019 - 2023

Historic Market Size - Geography Segment 2019 - 2023 ($ million)

5.6 Country segment analysis 2019 - 2023

Historic Market Size - Country Segment 2019 - 2023 ($ million)

6. Five Forces Analysis

6.1 Five forces summary

Five forces analysis - Comparison between 2024 and 2029

6.2 Bargaining power of buyers

Bargaining power of buyers - Impact of key factors 2024 and 2029

6.3 Bargaining power of suppliers

Bargaining power of suppliers - Impact of key factors in 2024 and 2029

6.4 Threat of new entrants

Threat of new entrants - Impact of key factors in 2024 and 2029

6.5 Threat of substitutes

Threat of substitutes - Impact of key factors in 2024 and 2029

6.6 Threat of rivalry

Threat of rivalry - Impact of key factors in 2024 and 2029

6.7 Market condition

Chart on Market condition - Five forces 2024 and 2029

7. Market Segmentation by Component

7.1 Market segments

Chart on Component - Market share 2024-2029 (%)
Data Table on Component - Market share 2024-2029 (%)

7.2 Comparison by Component

Chart on Comparison by Component
Data Table on Comparison by Component

7.3 Solutions - Market size and forecast 2024-2029

Chart on Solutions - Market size and forecast 2024-2029 ($ million)
Data Table on Solutions - Market size and forecast 2024-2029 ($ million)
Chart on Solutions - Year-over-year growth 2024-2029 (%)
Data Table on Solutions - Year-over-year growth 2024-2029 (%)

7.4 Services - Market size and forecast 2024-2029

Chart on Services - Market size and forecast 2024-2029 ($ million)
Data Table on Services - Market size and forecast 2024-2029 ($ million)
Chart on Services - Year-over-year growth 2024-2029 (%)
Data Table on Services - Year-over-year growth 2024-2029 (%)

7.5 Market opportunity by Component

Market opportunity by Component ($ million)
Data Table on Market opportunity by Component ($ million)

8. Market Segmentation by Application

8.1 Market segments

Chart on Application - Market share 2024-2029 (%)
Data Table on Application - Market share 2024-2029 (%)

8.2 Comparison by Application

Chart on Comparison by Application
Data Table on Comparison by Application

8.3 Legal research and analytics - Market size and forecast 2024-2029

Chart on Legal research and analytics - Market size and forecast 2024-2029 ($ million)
Data Table on Legal research and analytics - Market size and forecast 2024-2029 ($ million)
Chart on Legal research and analytics - Year-over-year growth 2024-2029 (%)
Data Table on Legal research and analytics - Year-over-year growth 2024-2029 (%)

8.4 E-discovery and document review - Market size and forecast 2024-2029

Chart on E-discovery and document review - Market size and forecast 2024-2029 ($ million)
Data Table on E-discovery and document review - Market size and forecast 2024-2029 ($ million)
Chart on E-discovery and document review - Year-over-year growth 2024-2029 (%)
Data Table on E-discovery and document review - Year-over-year growth 2024-2029 (%)

8.5 Tax compliance and reporting - Market size and forecast 2024-2029

Chart on Tax compliance and reporting - Market size and forecast 2024-2029 ($ million)
Data Table on Tax compliance and reporting - Market size and forecast 2024-2029 ($ million)
Chart on Tax compliance and reporting - Year-over-year growth 2024-2029 (%)
Data Table on Tax compliance and reporting - Year-over-year growth 2024-2029 (%)

8.6 Contract management and drafting - Market size and forecast 2024-2029

Chart on Contract management and drafting - Market size and forecast 2024-2029 ($ million)
Data Table on Contract management and drafting - Market size and forecast 2024-2029 ($ million)
Chart on Contract management and drafting - Year-over-year growth 2024-2029 (%)
Data Table on Contract management and drafting - Year-over-year growth 2024-2029 (%)

8.7 Others - Market size and forecast 2024-2029

Chart on Others - Market size and forecast 2024-2029 ($ million)
Data Table on Others - Market size and forecast 2024-2029 ($ million)
Chart on Others - Year-over-year growth 2024-2029 (%)
Data Table on Others - Year-over-year growth 2024-2029 (%)

8.8 Market opportunity by Application

Market opportunity by Application ($ million)
Data Table on Market opportunity by Application ($ million)

9. Market Segmentation by End-user

9.1 Market segments

Chart on End-user - Market share 2024-2029 (%)
Data Table on End-user - Market share 2024-2029 (%)

9.2 Comparison by End-user

Chart on Comparison by End-user
Data Table on Comparison by End-user

9.3 Law firms - Market size and forecast 2024-2029

Chart on Law firms - Market size and forecast 2024-2029 ($ million)
Data Table on Law firms - Market size and forecast 2024-2029 ($ million)
Chart on Law firms - Year-over-year growth 2024-2029 (%)
Data Table on Law firms - Year-over-year growth 2024-2029 (%)

9.4 Corporate legal/tax departments - Market size and forecast 2024-2029

Chart on Corporate legal/tax departments - Market size and forecast 2024-2029 ($ million)
Data Table on Corporate legal/tax departments - Market size and forecast 2024-2029 ($ million)
Chart on Corporate legal/tax departments - Year-over-year growth 2024-2029 (%)
Data Table on Corporate legal/tax departments - Year-over-year growth 2024-2029 (%)

9.5 Alternative service providers - Market size and forecast 2024-2029

Chart on Alternative service providers - Market size and forecast 2024-2029 ($ million)
Data Table on Alternative service providers - Market size and forecast 2024-2029 ($ million)
Chart on Alternative service providers - Year-over-year growth 2024-2029 (%)
Data Table on Alternative service providers - Year-over-year growth 2024-2029 (%)

9.6 Public sector/judiciary - Market size and forecast 2024-2029

Chart on Public sector/judiciary - Market size and forecast 2024-2029 ($ million)
Data Table on Public sector/judiciary - Market size and forecast 2024-2029 ($ million)
Chart on Public sector/judiciary - Year-over-year growth 2024-2029 (%)
Data Table on Public sector/judiciary - Year-over-year growth 2024-2029 (%)

9.7 Market opportunity by End-user

Market opportunity by End-user ($ million)
Data Table on Market opportunity by End-user ($ million)

10. Customer Landscape

10.1 Customer landscape overview

Analysis of price sensitivity, lifecycle, customer purchase basket, adoption rates, and purchase criteria

11. Geographic Landscape

11.1 Geographic segmentation

Chart on Market share by geography 2024-2029 (%)
Data Table on Market share by geography 2024-2029 (%)

11.2 Geographic comparison

Chart on Geographic comparison
Data Table on Geographic comparison

11.3 North America - Market size and forecast 2024-2029

Chart on North America - Market size and forecast 2024-2029 ($ million)
Data Table on North America - Market size and forecast 2024-2029 ($ million)
Chart on North America - Year-over-year growth 2024-2029 (%)
Data Table on North America - Year-over-year growth 2024-2029 (%)
Chart on Regional Comparison - North America
Data Table on Regional Comparison - North America

11.3.1 US - Market size and forecast 2024-2029

Chart on US - Market size and forecast 2024-2029 ($ million)
Data Table on US - Market size and forecast 2024-2029 ($ million)
Chart on US - Year-over-year growth 2024-2029 (%)
Data Table on US - Year-over-year growth 2024-2029 (%)

11.3.2 Canada - Market size and forecast 2024-2029

Chart on Canada - Market size and forecast 2024-2029 ($ million)
Data Table on Canada - Market size and forecast 2024-2029 ($ million)
Chart on Canada - Year-over-year growth 2024-2029 (%)
Data Table on Canada - Year-over-year growth 2024-2029 (%)

11.3.3 Mexico - Market size and forecast 2024-2029

Chart on Mexico - Market size and forecast 2024-2029 ($ million)
Data Table on Mexico - Market size and forecast 2024-2029 ($ million)
Chart on Mexico - Year-over-year growth 2024-2029 (%)
Data Table on Mexico - Year-over-year growth 2024-2029 (%)

11.4 Europe - Market size and forecast 2024-2029

Chart on Europe - Market size and forecast 2024-2029 ($ million)
Data Table on Europe - Market size and forecast 2024-2029 ($ million)
Chart on Europe - Year-over-year growth 2024-2029 (%)
Data Table on Europe - Year-over-year growth 2024-2029 (%)
Chart on Regional Comparison - Europe
Data Table on Regional Comparison - Europe

11.4.1 Germany - Market size and forecast 2024-2029

Chart on Germany - Market size and forecast 2024-2029 ($ million)
Data Table on Germany - Market size and forecast 2024-2029 ($ million)
Chart on Germany - Year-over-year growth 2024-2029 (%)
Data Table on Germany - Year-over-year growth 2024-2029 (%)

11.4.2 UK - Market size and forecast 2024-2029

Chart on UK - Market size and forecast 2024-2029 ($ million)
Data Table on UK - Market size and forecast 2024-2029 ($ million)
Chart on UK - Year-over-year growth 2024-2029 (%)
Data Table on UK - Year-over-year growth 2024-2029 (%)

11.4.3 France - Market size and forecast 2024-2029

Chart on France - Market size and forecast 2024-2029 ($ million)
Data Table on France - Market size and forecast 2024-2029 ($ million)
Chart on France - Year-over-year growth 2024-2029 (%)
Data Table on France - Year-over-year growth 2024-2029 (%)

11.4.4 Italy - Market size and forecast 2024-2029

Chart on Italy - Market size and forecast 2024-2029 ($ million)
Data Table on Italy - Market size and forecast 2024-2029 ($ million)
Chart on Italy - Year-over-year growth 2024-2029 (%)
Data Table on Italy - Year-over-year growth 2024-2029 (%)

11.4.5 Spain - Market size and forecast 2024-2029

Chart on Spain - Market size and forecast 2024-2029 ($ million)
Data Table on Spain - Market size and forecast 2024-2029 ($ million)
Chart on Spain - Year-over-year growth 2024-2029 (%)
Data Table on Spain - Year-over-year growth 2024-2029 (%)

11.4.6 The Netherlands - Market size and forecast 2024-2029

Chart on The Netherlands - Market size and forecast 2024-2029 ($ million)
Data Table on The Netherlands - Market size and forecast 2024-2029 ($ million)
Chart on The Netherlands - Year-over-year growth 2024-2029 (%)
Data Table on The Netherlands - Year-over-year growth 2024-2029 (%)

11.5 APAC - Market size and forecast 2024-2029

Chart on APAC - Market size and forecast 2024-2029 ($ million)
Data Table on APAC - Market size and forecast 2024-2029 ($ million)
Chart on APAC - Year-over-year growth 2024-2029 (%)
Data Table on APAC - Year-over-year growth 2024-2029 (%)
Chart on Regional Comparison - APAC
Data Table on Regional Comparison - APAC

11.5.1 China - Market size and forecast 2024-2029

Chart on China - Market size and forecast 2024-2029 ($ million)
Data Table on China - Market size and forecast 2024-2029 ($ million)
Chart on China - Year-over-year growth 2024-2029 (%)
Data Table on China - Year-over-year growth 2024-2029 (%)

11.5.2 Japan - Market size and forecast 2024-2029

Chart on Japan - Market size and forecast 2024-2029 ($ million)
Data Table on Japan - Market size and forecast 2024-2029 ($ million)
Chart on Japan - Year-over-year growth 2024-2029 (%)
Data Table on Japan - Year-over-year growth 2024-2029 (%)

11.5.3 India - Market size and forecast 2024-2029

Chart on India - Market size and forecast 2024-2029 ($ million)
Data Table on India - Market size and forecast 2024-2029 ($ million)
Chart on India - Year-over-year growth 2024-2029 (%)
Data Table on India - Year-over-year growth 2024-2029 (%)

11.5.4 Australia - Market size and forecast 2024-2029

Chart on Australia - Market size and forecast 2024-2029 ($ million)
Data Table on Australia - Market size and forecast 2024-2029 ($ million)
Chart on Australia - Year-over-year growth 2024-2029 (%)
Data Table on Australia - Year-over-year growth 2024-2029 (%)

11.5.5 South Korea - Market size and forecast 2024-2029

Chart on South Korea - Market size and forecast 2024-2029 ($ million)
Data Table on South Korea - Market size and forecast 2024-2029 ($ million)
Chart on South Korea - Year-over-year growth 2024-2029 (%)
Data Table on South Korea - Year-over-year growth 2024-2029 (%)

11.5.6 Indonesia - Market size and forecast 2024-2029

Chart on Indonesia - Market size and forecast 2024-2029 ($ million)
Data Table on Indonesia - Market size and forecast 2024-2029 ($ million)
Chart on Indonesia - Year-over-year growth 2024-2029 (%)
Data Table on Indonesia - Year-over-year growth 2024-2029 (%)

11.6 Middle East and Africa - Market size and forecast 2024-2029

Chart on Middle East and Africa - Market size and forecast 2024-2029 ($ million)
Data Table on Middle East and Africa - Market size and forecast 2024-2029 ($ million)
Chart on Middle East and Africa - Year-over-year growth 2024-2029 (%)
Data Table on Middle East and Africa - Year-over-year growth 2024-2029 (%)
Chart on Regional Comparison - Middle East and Africa
Data Table on Regional Comparison - Middle East and Africa

11.6.1 UAE - Market size and forecast 2024-2029

Chart on UAE - Market size and forecast 2024-2029 ($ million)
Data Table on UAE - Market size and forecast 2024-2029 ($ million)
Chart on UAE - Year-over-year growth 2024-2029 (%)
Data Table on UAE - Year-over-year growth 2024-2029 (%)

11.6.2 Saudi Arabia - Market size and forecast 2024-2029

Chart on Saudi Arabia - Market size and forecast 2024-2029 ($ million)
Data Table on Saudi Arabia - Market size and forecast 2024-2029 ($ million)
Chart on Saudi Arabia - Year-over-year growth 2024-2029 (%)
Data Table on Saudi Arabia - Year-over-year growth 2024-2029 (%)

11.6.3 South Africa - Market size and forecast 2024-2029

Chart on South Africa - Market size and forecast 2024-2029 ($ million)
Data Table on South Africa - Market size and forecast 2024-2029 ($ million)
Chart on South Africa - Year-over-year growth 2024-2029 (%)
Data Table on South Africa - Year-over-year growth 2024-2029 (%)

11.6.4 Israel - Market size and forecast 2024-2029

Chart on Israel - Market size and forecast 2024-2029 ($ million)
Data Table on Israel - Market size and forecast 2024-2029 ($ million)
Chart on Israel - Year-over-year growth 2024-2029 (%)
Data Table on Israel - Year-over-year growth 2024-2029 (%)

11.6.5 Turkey - Market size and forecast 2024-2029

Chart on Turkey - Market size and forecast 2024-2029 ($ million)
Data Table on Turkey - Market size and forecast 2024-2029 ($ million)
Chart on Turkey - Year-over-year growth 2024-2029 (%)
Data Table on Turkey - Year-over-year growth 2024-2029 (%)

11.7 South America - Market size and forecast 2024-2029

Chart on South America - Market size and forecast 2024-2029 ($ million)
Data Table on South America - Market size and forecast 2024-2029 ($ million)
Chart on South America - Year-over-year growth 2024-2029 (%)
Data Table on South America - Year-over-year growth 2024-2029 (%)
Chart on Regional Comparison - South America
Data Table on Regional Comparison - South America

11.7.1 Brazil - Market size and forecast 2024-2029

Chart on Brazil - Market size and forecast 2024-2029 ($ million)
Data Table on Brazil - Market size and forecast 2024-2029 ($ million)
Chart on Brazil - Year-over-year growth 2024-2029 (%)
Data Table on Brazil - Year-over-year growth 2024-2029 (%)

11.7.2 Argentina - Market size and forecast 2024-2029

Chart on Argentina - Market size and forecast 2024-2029 ($ million)
Data Table on Argentina - Market size and forecast 2024-2029 ($ million)
Chart on Argentina - Year-over-year growth 2024-2029 (%)
Data Table on Argentina - Year-over-year growth 2024-2029 (%)

11.7.3 Colombia - Market size and forecast 2024-2029

Chart on Colombia - Market size and forecast 2024-2029 ($ million)
Data Table on Colombia - Market size and forecast 2024-2029 ($ million)
Chart on Colombia - Year-over-year growth 2024-2029 (%)
Data Table on Colombia - Year-over-year growth 2024-2029 (%)

11.8 Market opportunity by geography

Market opportunity by geography ($ million)
Data Tables on Market opportunity by geography ($ million)

12. Drivers, Challenges, and Opportunity

12.1 Market drivers

Increasing complexity of legal and tax regulations
Demand for efficiency and cost reduction
Growing volume of data and information

12.2 Market challenges

Data privacy and security concerns
Integration with legacy systems
Lack of skilled AI professionals and domain expertise

12.3 Impact of drivers and challenges

Impact of drivers and challenges in 2024 and 2029

12.4 Market opportunities

Rise of generative AI and large language models LLMs
Hyper-personalization of legal and tax services
Emphasis on ethical AI and responsible deployment

13. Competitive Landscape

13.1 Overview

13.2

Overview on criticality of inputs and factors of differentiation

13.3 Landscape disruption

Overview on factors of disruption

13.4 Industry risks

Impact of key risks on business

14. Competitive Analysis

14.1 Companies profiled

Companies covered

14.2 Company ranking index

14.3 Market positioning of companies

Matrix on companies position and classification

14.4 Avalara Inc.

Avalara Inc. - Overview
Avalara Inc. - Product / Service
Avalara Inc. - Key offerings
SWOT

14.5 Bloomberg Tax

Bloomberg Tax - Overview
Bloomberg Tax - Product / Service
Bloomberg Tax - Key offerings
SWOT

14.6 Blue J Legal

Blue J Legal - Overview
Blue J Legal - Product / Service
Blue J Legal - Key offerings
SWOT

14.7 Counsel AI Corp.

Counsel AI Corp. - Overview
Counsel AI Corp. - Product / Service
Counsel AI Corp. - Key offerings
SWOT

14.8 Deloitte Touche Tohmatsu Ltd.

Deloitte Touche Tohmatsu Ltd. - Overview
Deloitte Touche Tohmatsu Ltd. - Business segments
Deloitte Touche Tohmatsu Ltd. - Key offerings
Deloitte Touche Tohmatsu Ltd. - Segment focus
SWOT

14.9 Ernst and Young Global Ltd.

Ernst and Young Global Ltd. - Overview
Ernst and Young Global Ltd. - Product / Service
Ernst and Young Global Ltd. - Key offerings
SWOT

14.10 Intuit Inc.

Intuit Inc. - Overview
Intuit Inc. - Business segments
Intuit Inc. - Key offerings
Intuit Inc. - Segment focus
SWOT

14.11 Ironclad Inc.

Ironclad Inc. - Overview
Ironclad Inc. - Product / Service
Ironclad Inc. - Key offerings
SWOT

14.12 KPMG International Ltd.

KPMG International Ltd. - Overview
KPMG International Ltd. - Product / Service
KPMG International Ltd. - Key offerings
SWOT

14.13 LexisNexis Legal and Professional

LexisNexis Legal and Professional - Overview
LexisNexis Legal and Professional - Product / Service
LexisNexis Legal and Professional - Key offerings
SWOT

14.14 Luminance Technologies Ltd.

Luminance Technologies Ltd. - Overview
Luminance Technologies Ltd. - Product / Service
Luminance Technologies Ltd. - Key offerings
SWOT

14.15 PricewaterhouseCoopers LLP

PricewaterhouseCoopers LLP - Overview
PricewaterhouseCoopers LLP - Product / Service
PricewaterhouseCoopers LLP - Key offerings
SWOT

14.16 Robin AI Ltd.

Robin AI Ltd. - Overview
Robin AI Ltd. - Product / Service
Robin AI Ltd. - Key offerings
SWOT

14.17 Thomson Reuters Corp.

Thomson Reuters Corp. - Overview
Thomson Reuters Corp. - Business segments
Thomson Reuters Corp. - Key news
Thomson Reuters Corp. - Key offerings
Thomson Reuters Corp. - Segment focus
SWOT

14.18 Wolters Kluwer NV

Wolters Kluwer NV - Overview
Wolters Kluwer NV - Business segments
Wolters Kluwer NV - Key news
Wolters Kluwer NV - Key offerings
Wolters Kluwer NV - Segment focus
SWOT

15. Appendix

15.1 Scope of the report

Market definition
Objectives
Notes and caveats

15.2 Inclusions and exclusions checklist

Inclusions checklist
Exclusions checklist

15.3 Currency conversion rates for US$

15.4 Research methodology

15.5 Data procurement

Information sources

15.6 Data validation

15.7 Validation techniques employed for market sizing

15.8 Data synthesis

15.9 360 degree market analysis

15.10 List of abbreviations

Research Methodology

Technavio presents a detailed picture of the market by way of study, synthesis, and summation of data from multiple sources. The analysts have presented the various facets of the market with a particular focus on identifying the key industry influencers. The data thus presented is comprehensive, reliable, and the result of extensive research, both primary and secondary.

INFORMATION SOURCES

Primary sources

  • Manufacturers and suppliers
  • Channel partners
  • Industry experts
  • Strategic decision makers

Secondary sources

  • Industry journals and periodicals
  • Government data
  • Financial reports of key industry players
  • Historical data
  • Press releases

DATA ANALYSIS

Data Synthesis

  • Collation of data
  • Estimation of key figures
  • Analysis of derived insights

Data Validation

  • Triangulation with data models
  • Reference against proprietary databases
  • Corroboration with industry experts

REPORT WRITING

Qualitative

  • Market drivers
  • Market challenges
  • Market trends
  • Five forces analysis

Quantitative

  • Market size and forecast
  • Market segmentation
  • Geographical insights
  • Competitive landscape

Interested in this report?

Get your sample now to see our research methodology and insights!

Download Now

Frequently Asked Questions

AI In Tax And Legal Advisory market growth will increase by USD 4436.2 million during 2025-2029 .

The AI In Tax And Legal Advisory market is expected to grow at a CAGR of 14.7% during 2025-2029 .

AI In Tax And Legal Advisory market is segmented by Component (Solutions, Services) Application (Legal research and analytics, E-discovery and document review, Tax compliance and reporting, Contract management and drafting, Others) End-user (Law firms, Corporate legal/tax departments, Alternative service providers, Public sector/judiciary)

Avalara Inc., Bloomberg Tax, Blue J Legal, Counsel AI Corp., Deloitte Touche Tohmatsu Ltd., Ernst and Young Global Ltd., Intuit Inc., Ironclad Inc., Kintsugi, KPMG International Ltd., Legora, LexisNexis Legal and Professional, Luminance Technologies Ltd., PricewaterhouseCoopers LLP, Robin AI Ltd., Spellbook, Sphere, TaxGPT, Thomson Reuters Corp., Wolters Kluwer NV are a few of the key vendors in the AI In Tax And Legal Advisory market.

North America will register the highest growth rate of 40.4% among the other regions. Therefore, the AI In Tax And Legal Advisory market in North America is expected to garner significant business opportunities for the vendors during the forecast period.

US, Canada, Mexico, Germany, UK, France, Italy, Spain, The Netherlands, China, Japan, India, Australia, South Korea, Indonesia, UAE, Saudi Arabia, South Africa, Israel, Turkey, Brazil, Argentina, Colombia

  • Increasing complexity of legal and tax regulations is the driving factor this market.

The AI In Tax And Legal Advisory market vendors should focus on grabbing business opportunities from the Component segment as it accounted for the largest market share in the base year.