AI Governance Tools Market Analysis, Size, and Forecast 2026-2030: North America (US, Canada, and Mexico), Europe (UK, Germany, and France), APAC (China, Japan, and India), South America (Brazil, Argentina, and Colombia), Middle East and Africa (UAE, Israel, and Saudi Arabia), and Rest of World (ROW)

AI Governance Tools Market Analysis, Size, and Forecast 2026-2030:
North America (US, Canada, and Mexico), Europe (UK, Germany, and France), APAC (China, Japan, and India), South America (Brazil, Argentina, and Colombia), Middle East and Africa (UAE, Israel, and Saudi Arabia), and Rest of World (ROW)

Published: May 2026 301 Pages SKU: IRTNTR80660

Market Overview at a Glance

$6.98 B
Market Opportunity
48.7%
CAGR 2025 - 2030
37.4%
North America Growth
$561.65 Mn
Large enterprises segment 2024

Ai Governance Tools Market Size and Growth Forecast 2026-2030

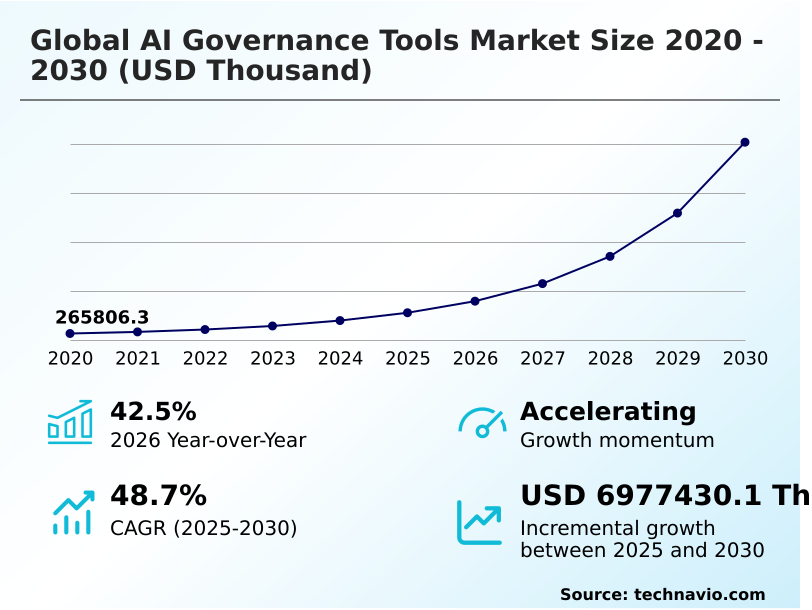
The Ai Governance Tools Market size was valued at USD 1.11 billion in 2025 growing at a CAGR of 48.7% during the forecast period 2026-2030.

North America accounts for 37.4% of incremental growth during the forecast period. The Large enterprises segment by End-user was valued at USD 561.65 million in 2024, while the Risk and compliance monitoring segment holds the largest revenue share by Type.

The market is projected to grow by from 2020 to 2030, with USD 6.98 billion of the growth expected during the forecast period of 2025 to 2030.

Get Key Insights on Market Forecast (PDF) Request Free Sample

Ai Governance Tools Market Overview

The AI governance tools market is defined by a critical shift from experimental AI to its deployment in core business functions, making formal AI governance frameworks essential for operational resilience. This is particularly evident in North America, which is projected to contribute 37.4% of the market's incremental growth, driven by early and widespread adoption. The focus for enterprises is translating abstract responsible AI principles into enforceable controls using specialized AI risk management tools. A typical scenario involves a financial services firm implementing a comprehensive AI model inventory to catalog hundreds of algorithmic trading models. By deploying a centralized AI governance platform with capabilities for continuous performance monitoring and automated model validation, the firm can address model drift detection in real-time. This provides the necessary AI audit trails to comply with SEC mandates and ensures robust model risk management through explainable AI (XAI) and proactive bias detection and fairness auditing, which have become non-negotiable for maintaining regulatory compliance and public trust.

Drivers, Trends, and Challenges in the Ai Governance Tools Market

The practical application of AI governance is highly sector-specific, requiring tailored solutions. For example, AI governance tools for financial services concentrate on bias detection in credit scoring models and managing model risk with AI governance in high-frequency trading. Concurrently, AI governance tools for healthcare are essential for validating diagnostic models and ensuring patient data privacy.

The debate over open source vs commercial AI governance often revolves around the total cost of implementing AI governance tools, as commercial platforms offer robust support for implementing AI governance in MLOps and provide templates for compliance with the EU AI Act.

The rise of generative AI has made generative AI governance and security paramount, focusing on risks such as data poisoning and requiring an extensive AI audit trail for regulatory reporting. In high-stakes fields, such as with AI governance tools for autonomous vehicles, the emphasis is on best practices for AI model validation and securing AI models from adversarial attacks.

Integrating an AI governance platform with GRC systems is now a standard practice for comprehensive risk oversight and is crucial for AI governance tools for regulatory compliance.

Capabilities like automated monitoring for AI model drift and explainability tools for black box models are now standard features, essential for functions ranging from AI governance tools for supply chain to ensuring fairness in AI hiring tools.

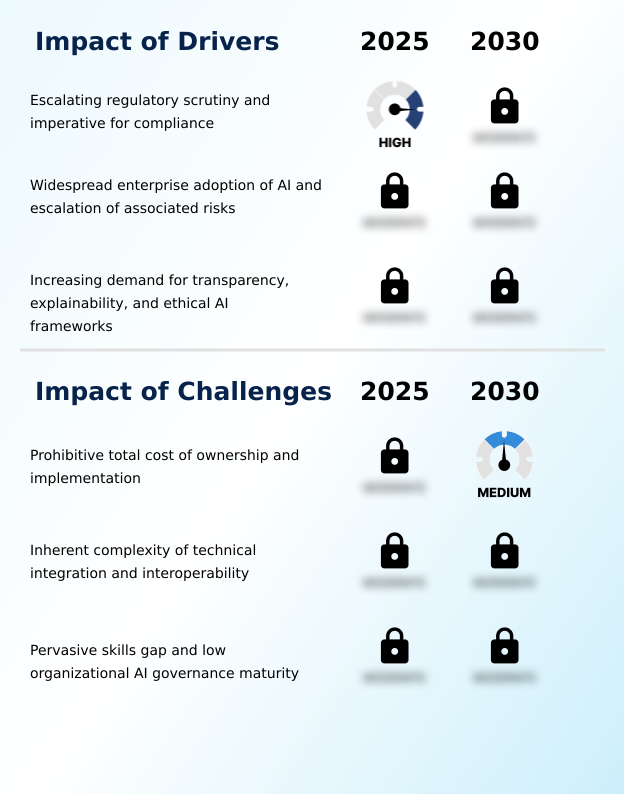
Primary Growth Driver: The primary market driver is the escalating regulatory scrutiny and the corresponding imperative for organizations to achieve and demonstrate compliance with emerging AI-specific legal frameworks.

Escalating regulatory scrutiny, exemplified by frameworks like the EU AI Act and Brazil's LGPD, stands as the foremost market driver, making AI compliance software an operational necessity.

This legal imperative compels organizations to adopt tools capable of automated regulatory reporting and AI impact assessment to mitigate the risk of severe financial penalties.

A second major driver is the widespread enterprise adoption of AI, which introduces a new spectrum of complex operational risks.

As organizations deploy AI at scale, the reliance on AI governance platforms for comprehensive model risk management and data governance for AI becomes essential.

With North America accounting for 37.4% of the market's incremental growth, the demand for sophisticated AI risk management tools to safeguard brand reputation and maintain stakeholder trust is a powerful and enduring catalyst.

Emerging Market Trend: A key market trend is the rise of explainable AI (XAI) and model interpretability as a fundamental governance requirement. This shift reflects growing demands for transparency in automated decision-making from regulators and stakeholders.

A primary market trend is the strategic convergence of AI-specific functions with broader Enterprise Risk Management (ERM) frameworks, signaling a move beyond siloed, standalone tools. The demand for explainable AI (XAI) and robust model interpretability is now a core compliance requirement, driven by regulations such as the EU AI Act that include a right to explanation.

This is compelling investment in advanced explainability and transparency tools. Another key trend is the proliferation of automated solutions for continuous performance monitoring and full model lifecycle management.

With the APAC region projected for a 51.5% CAGR, the need for scalable AI model monitoring tools to govern vast and diverse model ecosystems is becoming a critical operational necessity, reflecting a market-wide pivot to automated, real-time oversight.

Key Industry Challenge: A key market challenge is the prohibitive total cost of ownership, which includes not only high software fees but also the extensive expenses of complex technical integration and implementation.

A significant market restraint is the high total cost of ownership, which includes not only steep licensing fees but also the resource-intensive process of technical integration. The inherent complexity of integrating AI governance tools with heterogeneous IT and MLOps ecosystems often requires specialized engineering expertise, which deters many potential adopters.

Another critical challenge is the pervasive skills gap; a global shortage of professionals with the multidisciplinary expertise required for effective machine learning governance persists. This widespread lack of organizational AI governance maturity, particularly among smaller companies, limits the addressable market largely to well-resourced enterprises.

These factors make it difficult for many organizations to justify the substantial investment in a comprehensive AI governance framework, thereby impeding broader market penetration.

Explore Full Market Dynamics Analysis Request Free Sample

Ai Governance Tools Market Segmentation

The ai governance tools industry research report provides comprehensive data including region-wise segment analysis, with forecasts and analysis for the period 2026-2030, as well as historical data from 2020-2024 for the following segments.

Market Segment by End-user
  • Large enterprises
  • Mid-market companies
  • SMBs and startups
Market Segment by Type
  • Risk and compliance monitoring
  • Model lifecycle management
  • Bias detection and fairness auditing
  • Explainability and transparency tools
Market Segment by Deployment
  • Cloud-native SaaS
  • Hybrid or multi-cloud
  • On-premises integration
Market Segment by Geography
North America
US, Canada, Mexico
Europe
UK, Germany, France, Italy, The Netherlands, Spain
APAC
China, Japan, India, South Korea, Australia, Indonesia
South America
Brazil, Argentina, Colombia
Middle East and Africa
UAE, Israel, Saudi Arabia, South Africa, Turkey

End-user Segment Analysis

The large enterprises segment is estimated to witness significant growth during the forecast period.

Large enterprises represent the most mature and dominant end-user segment, driven by the operational necessity of managing complex, large-scale artificial intelligence deployments across multiple jurisdictions.

For these organizations, adopting robust AI risk management tools is a fundamental component of enterprise risk management, not an optional enhancement.

Their procurement decisions prioritize highly scalable, secure platforms that offer comprehensive model risk management and can generate immutable AI audit trails for regulatory reporting.

Given their global footprint, these firms require enterprise AI governance solutions that seamlessly integrate into existing GRC frameworks to enforce AI policy management consistently.

The significant budgets allocated to technology and risk mitigation enable investment in premium, full-featured AI compliance software suites that provide capabilities like bias detection and fairness auditing, solidifying their position as the primary revenue contributor.

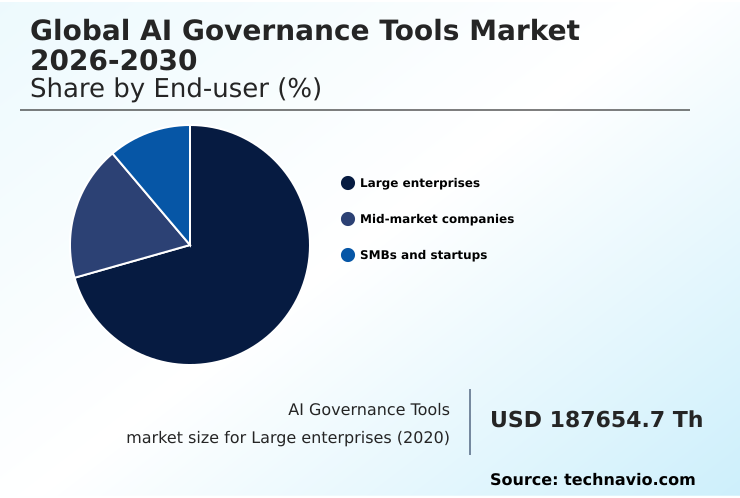
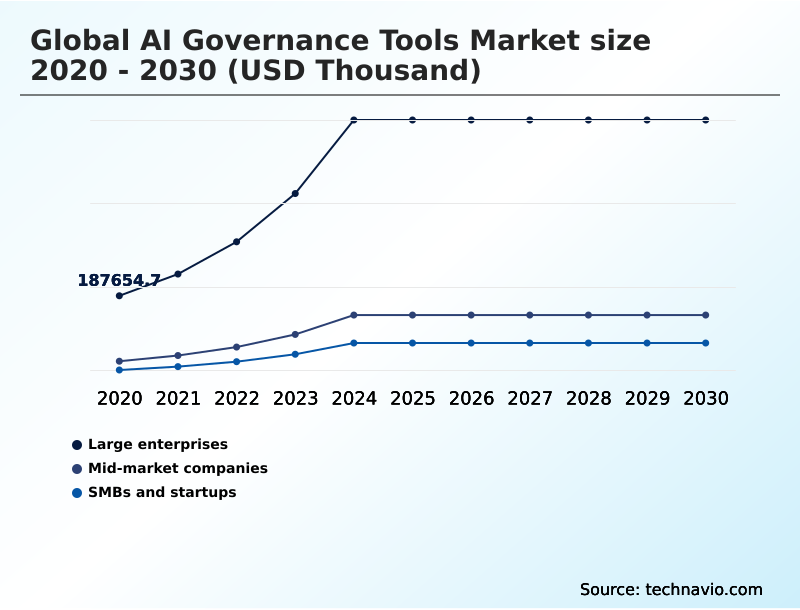
The Large enterprises segment was valued at USD 561.65 million in 2024 and showed a gradual increase during the forecast period.

Ai Governance Tools Market by Region: North America Leads with 37.4% Growth Share

North America is estimated to contribute 37.4% to the growth of the global market during the forecast period.

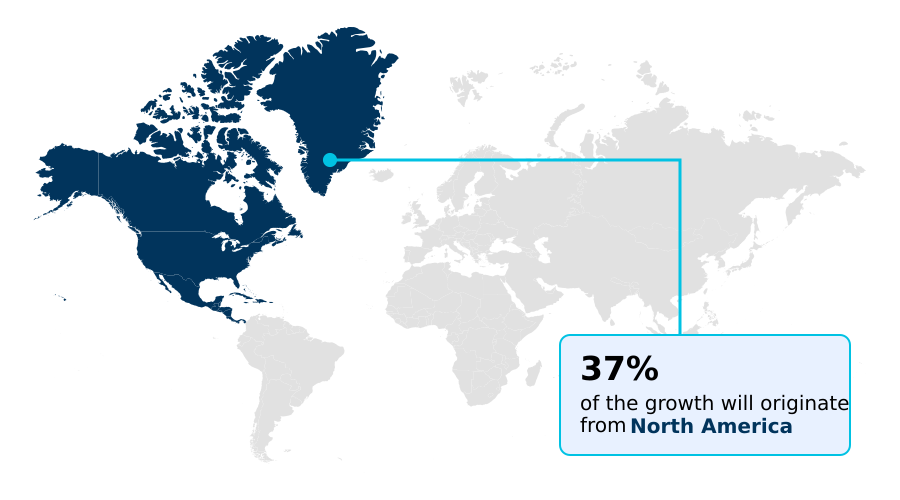
The geographic landscape is led by North America, accounting for 37.4% of incremental growth, where a mature market and a proactive regulatory environment compel the use of advanced AI governance platforms.

Europe, contributing 25.85%, sees its growth catalyzed by the EU AI Act, which mandates stringent regulatory compliance frameworks and detailed AI impact assessments.

In APAC, which accounts for 22.88% of growth, the focus is on enabling cross-border digital trade through harmonized standards that promote tools for federated learning governance and privacy-enhancing technologies (PETs).

While regions like South America and the Middle East and Africa are nascent, their growth is accelerating due to data privacy laws like Brazil's LGPD, which require explainability and transparency tools.

This regional diversity necessitates hybrid cloud AI governance solutions adaptable to varied legal and operational contexts.

Customer Landscape Analysis for the Ai Governance Tools Market

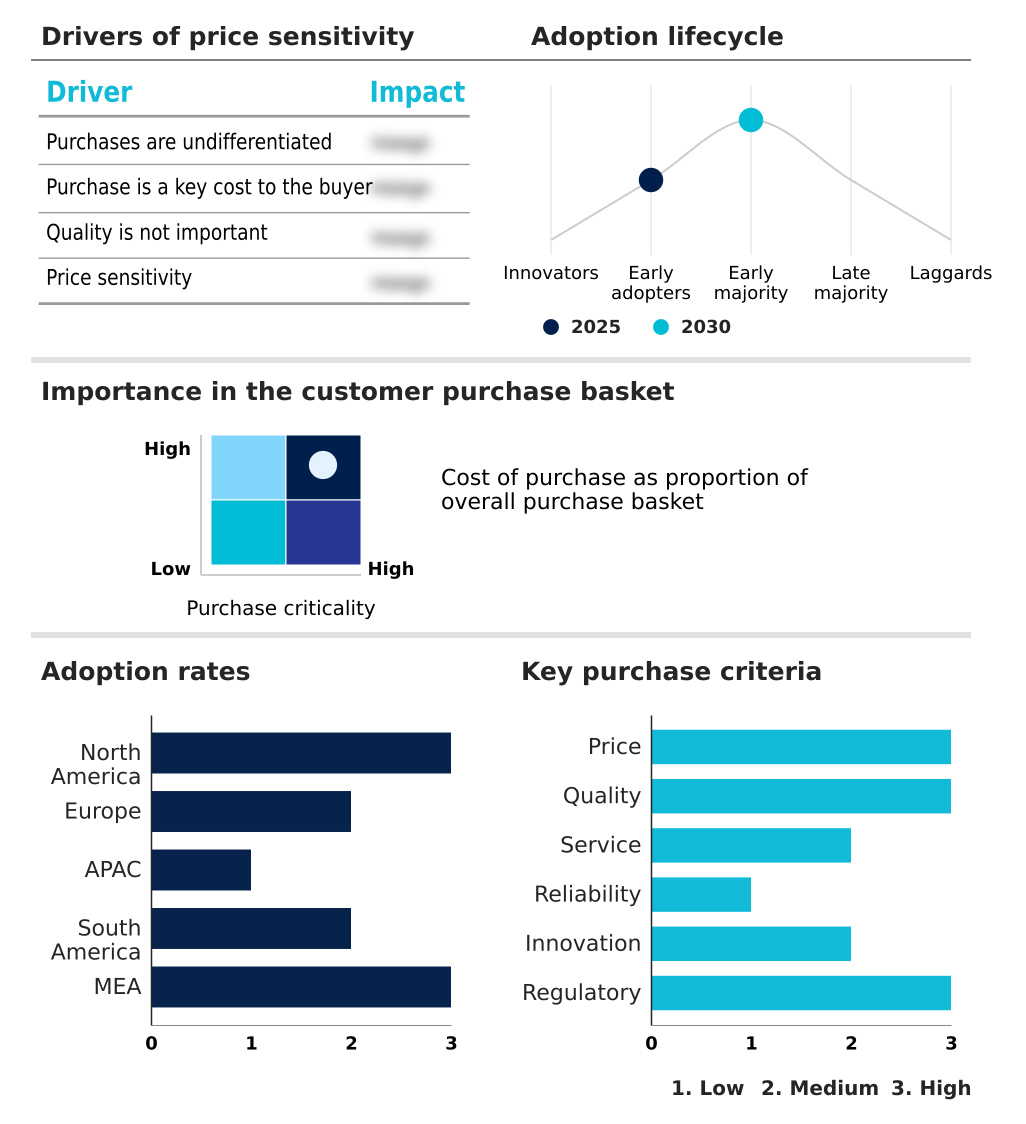
The ai governance tools market forecasting report includes the adoption lifecycle of the market, covering from the innovator’s stage to the laggard’s stage. It focuses on adoption rates in different regions based on penetration. Furthermore, the ai governance tools market report also includes key purchase criteria and drivers of price sensitivity to help companies evaluate and develop their market growth analysis strategies.

Competitive Landscape of the Ai Governance Tools Market

Companies are implementing various strategies, such as strategic alliances, partnerships, mergers and acquisitions, geographical expansion, and product/service launches, to enhance their presence in the ai governance tools market industry.

Alteryx Inc. - The portfolio integrates analytics, process automation, and AI governance, offering a unified platform for end-to-end data intelligence and operational control in enterprise environments.

The industry research and growth report includes detailed analyses of the competitive landscape of the market and information about key companies, including:

  • Alteryx Inc.
  • Amazon Web Services Inc.
  • ARTHUR
  • BigID Inc.
  • Collibra
  • Credo AI
  • Dataiku Inc.
  • DataRobot Inc.
  • Fair Isaac Corp.
  • Fiddler AI
  • Google LLC
  • H2O.ai Inc.
  • IBM Corp.
  • Informatica Inc.
  • Microsoft Corp.
  • Monitaur Inc.
  • OneTrust LLC
  • SAS Institute Inc.
  • Seldon Technologies
  • Trust Arc Inc.

Qualitative and quantitative analysis of companies has been conducted to help clients understand the wider business environment as well as the strengths and weaknesses of key industry players. Data is qualitatively analyzed to categorize companies as pure play, category-focused, industry-focused, and diversified; it is quantitatively analyzed to categorize companies as dominant, leading, strong, tentative, and weak.

Recent Developments in the Ai Governance Tools Market

  • In January 2025, Microsoft Corp. announced significant innovations for its Purview platform, enhancing data security and governance with features like Data Loss Prevention policies to safely accelerate AI transformation.
  • In February 2025, IBM Corp. formed a strategic partnership with telecommunications group Etisalat to deploy enterprise-grade agentic AI solutions tailored for governance and regulatory compliance within the telecom sector.
  • In March 2025, Microsoft Corp. launched its new AI Governance Toolkit for Azure OpenAI service users, providing a comprehensive suite of tools for responsible AI deployment, including integrated audit trails and risk management frameworks.
  • In April 2025, Brazil's National Data Protection Authority (ANPD) published binding technical regulations under the LGPD, mandating the use of AI governance tools for algorithmic impact assessments and model explainability.

Research Analyst Overview: Ai Governance Tools Market

The market is fundamentally transitioning from reactive, post-deployment auditing to proactive, lifecycle-embedded control systems. The introduction of regulations such as the EU AI Act has elevated AI policy management to a boardroom-level concern, directly influencing product strategy and market access decisions. Organizations are now mandated to demonstrate compliance through detailed AI audit trails and automated regulatory reporting.

The significant share of the risk and compliance monitoring segment, which accounts for a substantial portion of the market, underscores this compliance-driven reality. At the operational level, this mandates the integration of bias detection and fairness auditing and explainability and transparency tools directly into MLOps pipelines.

A key technical focus is on model drift detection, where continuous performance monitoring is essential. Consequently, boardroom budget allocations increasingly weigh the upfront cost of deploying comprehensive AI governance platforms against the severe financial and reputational risks of non-compliance, making robust model risk management a cornerstone of modern corporate strategy.

Dive into Technavio’s robust research methodology, blending expert interviews, extensive data synthesis, and validated models for unparalleled Ai Governance Tools Market insights. See full methodology.

Request Free Sample

Market Scope
Page number 301
Base year 2025
Historic period 2020-2024
Forecast period 2026-2030
Growth momentum & CAGR Accelerate at a CAGR of 48.7%
Market growth 2026-2030 USD 6977430.1 thousand
Market structure Fragmented
YoY growth 2025-2026(%) 42.5%
Key countries US, Canada, Mexico, UK, Germany, France, Italy, The Netherlands, Spain, China, Japan, India, South Korea, Australia, Indonesia, Brazil, Argentina, Colombia, UAE, Israel, Saudi Arabia, South Africa and Turkey
Competitive landscape Leading Companies, Market Positioning of Companies, Competitive Strategies, and Industry Risks

Ai Governance Tools Market: Key Questions Answered in This Report

  • What is the expected growth of the Ai Governance Tools Market between 2026 and 2030?

    • The Ai Governance Tools Market is expected to grow by USD 6.98 billion during 2026-2030, registering a CAGR of 48.7%. Year-over-year growth in 2026 is estimated at 42.5%%. This acceleration is shaped by escalating regulatory scrutiny and imperative for compliance, which is intensifying demand across multiple end-use verticals covered in the report.

  • What segmentation does the market report cover?

    • The report is segmented by End-user (Large enterprises, Mid-market companies, and SMBs and startups), Type (Risk and compliance monitoring, Model lifecycle management, Bias detection and fairness auditing, and Explainability and transparency tools), Deployment (Cloud-native SaaS, Hybrid or multi-cloud, and On-premises integration) and Geography (North America, Europe, APAC, South America, Middle East and Africa). Among these, the Large enterprises segment is estimated to witness significant growth during the forecast period, driven by rising adoption across key application areas. Each segment includes detailed qualitative and quantitative analysis, along with historical data from 2020-2024 and forecasts through 2030 with year-over-year growth rates.

  • Which regions are analyzed in the report?

    • The report covers North America, Europe, APAC, South America and Middle East and Africa. North America is estimated to contribute 37.4% to market growth during the forecast period. Country-level analysis includes US, Canada, Mexico, UK, Germany, France, Italy, The Netherlands, Spain, China, Japan, India, South Korea, Australia, Indonesia, Brazil, Argentina, Colombia, UAE, Israel, Saudi Arabia, South Africa and Turkey, with dedicated market size tables and year-over-year growth for each.

  • What are the key growth drivers and market challenges?

    • The primary driver is escalating regulatory scrutiny and imperative for compliance, which is accelerating investment and industry demand. The main challenge is prohibitive total cost of ownership and implementation, creating operational barriers for key market participants. The report quantifies the impact of each driver and challenge across 2026 and 2030 with comparative analysis.

  • Who are the major players in the Ai Governance Tools Market?

    • Key vendors include Alteryx Inc., Amazon Web Services Inc., ARTHUR, BigID Inc., Collibra, Credo AI, Dataiku Inc., DataRobot Inc., Fair Isaac Corp., Fiddler AI, Google LLC, H2O.ai Inc., IBM Corp., Informatica Inc., Microsoft Corp., Monitaur Inc., OneTrust LLC, SAS Institute Inc., Seldon Technologies and Trust Arc Inc.. The report provides qualitative and quantitative analysis categorizing companies as dominant, leading, strong, tentative, and weak based on their market positioning. Company profiles include business segment analysis, SWOT assessment, key offerings, and recent strategic developments.

Ai Governance Tools Market Research Insights

Market dynamics are shaped by the critical need for machine learning governance as organizations scale AI from isolated projects to enterprise-wide systems. The growing adoption of generative AI governance for large language models amplifies this demand. A significant portion of this is driven by compliance with frameworks like the EU AI Act, which mandates stringent AI risk and compliance oversight.

For instance, a healthcare provider using a diagnostic algorithm must deploy AI fairness metrics and AI transparency solutions to prove non-discriminatory outcomes, a process managed through a comprehensive enterprise AI governance platform. This contrasts with the large enterprise segment, which leads adoption, and the SMB segment, where the focus is on more accessible cloud AI governance tools.

The market is evolving beyond simple monitoring to holistic AI value alignment, ensuring that automated systems operate safely and ethically.

We can help! Our analysts can customize this ai governance tools market research report to meet your requirements.

Get in touch

1. Executive Summary

1.1 Market overview

Executive Summary - Chart on Market Overview
Executive Summary - Data Table on Market Overview
Executive Summary - Chart on Global Market Characteristics
Executive Summary - Chart on Market by Geography
Executive Summary - Chart on Market Segmentation by End-user
Executive Summary - Chart on Market Segmentation by Type
Executive Summary - Chart on Market Segmentation by Deployment
Executive Summary - Chart on Incremental Growth
Executive Summary - Data Table on Incremental Growth
Executive Summary - Chart on Company Market Positioning

2. Technavio Analysis

2.1 Analysis of price sensitivity, lifecycle, customer purchase basket, adoption rates, and purchase criteria

2.2 Criticality of inputs and Factors of differentiation

Chart on Overview on criticality of inputs and factors of differentiation

2.3 Factors of disruption

Chart on Overview on factors of disruption

2.4 Impact of drivers and challenges

Chart on Impact of drivers and challenges in 2025 and 2030

3. Market Landscape

3.1 Market ecosystem

Chart on Parent Market
Data Table on - Parent Market

3.2 Market characteristics

Chart on Market characteristics analysis

3.3 Value chain analysis

Chart on Value chain analysis

4. Market Sizing

4.1 Market definition

Data Table on Offerings of companies included in the market definition

4.2 Market segment analysis

Market segments

4.3 Market size 2025

4.4 Market outlook: Forecast for 2025-2030

Chart on Global - Market size and forecast 2025-2030 ($ thousand)
Data Table on Global - Market size and forecast 2025-2030 ($ thousand)
Chart on Global Market: Year-over-year growth 2025-2030 (%)
Data Table on Global Market: Year-over-year growth 2025-2030 (%)

5. Historic Market Size

5.1 Global AI Governance Tools Market 2020 - 2024

Historic Market Size - Data Table on Global AI Governance Tools Market 2020 - 2024 ($ thousand)

5.2 End-user segment analysis 2020 - 2024

Historic Market Size - End-user Segment 2020 - 2024 ($ thousand)

5.3 Type segment analysis 2020 - 2024

Historic Market Size - Type Segment 2020 - 2024 ($ thousand)

5.4 Deployment segment analysis 2020 - 2024

Historic Market Size - Deployment Segment 2020 - 2024 ($ thousand)

5.5 Geography segment analysis 2020 - 2024

Historic Market Size - Geography Segment 2020 - 2024 ($ thousand)

5.6 Country segment analysis 2020 - 2024

Historic Market Size - Country Segment 2020 - 2024 ($ thousand)

6. Qualitative Analysis

6.1 Impact of geopolitical conflicts on global AI governance tools market

7. Five Forces Analysis

7.1 Five forces summary

Five forces analysis - Comparison between 2025 and 2030

7.2 Bargaining power of buyers

Bargaining power of buyers - Impact of key factors 2025 and 2030

7.3 Bargaining power of suppliers

Bargaining power of suppliers - Impact of key factors in 2025 and 2030

7.4 Threat of new entrants

Threat of new entrants - Impact of key factors in 2025 and 2030

7.5 Threat of substitutes

Threat of substitutes - Impact of key factors in 2025 and 2030

7.6 Threat of rivalry

Threat of rivalry - Impact of key factors in 2025 and 2030

7.7 Market condition

Chart on Market condition - Five forces 2025 and 2030

8. Market Segmentation by End-user

8.1 Market segments

Chart on End-user - Market share 2025-2030 (%)
Data Table on End-user - Market share 2025-2030 (%)

8.2 Comparison by End-user

Chart on Comparison by End-user
Data Table on Comparison by End-user

8.3 Large enterprises - Market size and forecast 2025-2030

Chart on Large enterprises - Market size and forecast 2025-2030 ($ thousand)
Data Table on Large enterprises - Market size and forecast 2025-2030 ($ thousand)
Chart on Large enterprises - Year-over-year growth 2025-2030 (%)
Data Table on Large enterprises - Year-over-year growth 2025-2030 (%)

8.4 Mid-market companies - Market size and forecast 2025-2030

Chart on Mid-market companies - Market size and forecast 2025-2030 ($ thousand)
Data Table on Mid-market companies - Market size and forecast 2025-2030 ($ thousand)
Chart on Mid-market companies - Year-over-year growth 2025-2030 (%)
Data Table on Mid-market companies - Year-over-year growth 2025-2030 (%)

8.5 SMBs and startups - Market size and forecast 2025-2030

Chart on SMBs and startups - Market size and forecast 2025-2030 ($ thousand)
Data Table on SMBs and startups - Market size and forecast 2025-2030 ($ thousand)
Chart on SMBs and startups - Year-over-year growth 2025-2030 (%)
Data Table on SMBs and startups - Year-over-year growth 2025-2030 (%)

8.6 Market opportunity by End-user

Market opportunity by End-user ($ thousand)
Data Table on Market opportunity by End-user ($ thousand)

9. Market Segmentation by Type

9.1 Market segments

Chart on Type - Market share 2025-2030 (%)
Data Table on Type - Market share 2025-2030 (%)

9.2 Comparison by Type

Chart on Comparison by Type
Data Table on Comparison by Type

9.3 Risk and compliance monitoring - Market size and forecast 2025-2030

Chart on Risk and compliance monitoring - Market size and forecast 2025-2030 ($ thousand)
Data Table on Risk and compliance monitoring - Market size and forecast 2025-2030 ($ thousand)
Chart on Risk and compliance monitoring - Year-over-year growth 2025-2030 (%)
Data Table on Risk and compliance monitoring - Year-over-year growth 2025-2030 (%)

9.4 Model lifecycle management - Market size and forecast 2025-2030

Chart on Model lifecycle management - Market size and forecast 2025-2030 ($ thousand)
Data Table on Model lifecycle management - Market size and forecast 2025-2030 ($ thousand)
Chart on Model lifecycle management - Year-over-year growth 2025-2030 (%)
Data Table on Model lifecycle management - Year-over-year growth 2025-2030 (%)

9.5 Bias detection and fairness auditing - Market size and forecast 2025-2030

Chart on Bias detection and fairness auditing - Market size and forecast 2025-2030 ($ thousand)
Data Table on Bias detection and fairness auditing - Market size and forecast 2025-2030 ($ thousand)
Chart on Bias detection and fairness auditing - Year-over-year growth 2025-2030 (%)
Data Table on Bias detection and fairness auditing - Year-over-year growth 2025-2030 (%)

9.6 Explainability and transparency tools - Market size and forecast 2025-2030

Chart on Explainability and transparency tools - Market size and forecast 2025-2030 ($ thousand)
Data Table on Explainability and transparency tools - Market size and forecast 2025-2030 ($ thousand)
Chart on Explainability and transparency tools - Year-over-year growth 2025-2030 (%)
Data Table on Explainability and transparency tools - Year-over-year growth 2025-2030 (%)

9.7 Market opportunity by Type

Market opportunity by Type ($ thousand)
Data Table on Market opportunity by Type ($ thousand)

10. Market Segmentation by Deployment

10.1 Market segments

Chart on Deployment - Market share 2025-2030 (%)
Data Table on Deployment - Market share 2025-2030 (%)

10.2 Comparison by Deployment

Chart on Comparison by Deployment
Data Table on Comparison by Deployment

10.3 Cloud-native SaaS - Market size and forecast 2025-2030

Chart on Cloud-native SaaS - Market size and forecast 2025-2030 ($ thousand)
Data Table on Cloud-native SaaS - Market size and forecast 2025-2030 ($ thousand)
Chart on Cloud-native SaaS - Year-over-year growth 2025-2030 (%)
Data Table on Cloud-native SaaS - Year-over-year growth 2025-2030 (%)

10.4 Hybrid or multi-cloud - Market size and forecast 2025-2030

Chart on Hybrid or multi-cloud - Market size and forecast 2025-2030 ($ thousand)
Data Table on Hybrid or multi-cloud - Market size and forecast 2025-2030 ($ thousand)
Chart on Hybrid or multi-cloud - Year-over-year growth 2025-2030 (%)
Data Table on Hybrid or multi-cloud - Year-over-year growth 2025-2030 (%)

10.5 On-premises integration - Market size and forecast 2025-2030

Chart on On-premises integration - Market size and forecast 2025-2030 ($ thousand)
Data Table on On-premises integration - Market size and forecast 2025-2030 ($ thousand)
Chart on On-premises integration - Year-over-year growth 2025-2030 (%)
Data Table on On-premises integration - Year-over-year growth 2025-2030 (%)

10.6 Market opportunity by Deployment

Market opportunity by Deployment ($ thousand)
Data Table on Market opportunity by Deployment ($ thousand)

11. Customer Landscape

11.1 Customer landscape overview

Analysis of price sensitivity, lifecycle, customer purchase basket, adoption rates, and purchase criteria

12. Geographic Landscape

12.1 Geographic segmentation

Chart on Market share by geography 2025-2030 (%)
Data Table on Market share by geography 2025-2030 (%)

12.2 Geographic comparison

Chart on Geographic comparison
Data Table on Geographic comparison

12.3 North America - Market size and forecast 2025-2030

Chart on North America - Market size and forecast 2025-2030 ($ thousand)
Data Table on North America - Market size and forecast 2025-2030 ($ thousand)
Chart on North America - Year-over-year growth 2025-2030 (%)
Data Table on North America - Year-over-year growth 2025-2030 (%)
Chart on Regional Comparison - North America
Data Table on Regional Comparison - North America

12.3.1 US - Market size and forecast 2025-2030

Chart on US - Market size and forecast 2025-2030 ($ thousand)
Data Table on US - Market size and forecast 2025-2030 ($ thousand)
Chart on US - Year-over-year growth 2025-2030 (%)
Data Table on US - Year-over-year growth 2025-2030 (%)

12.3.2 Canada - Market size and forecast 2025-2030

Chart on Canada - Market size and forecast 2025-2030 ($ thousand)
Data Table on Canada - Market size and forecast 2025-2030 ($ thousand)
Chart on Canada - Year-over-year growth 2025-2030 (%)
Data Table on Canada - Year-over-year growth 2025-2030 (%)

12.3.3 Mexico - Market size and forecast 2025-2030

Chart on Mexico - Market size and forecast 2025-2030 ($ thousand)
Data Table on Mexico - Market size and forecast 2025-2030 ($ thousand)
Chart on Mexico - Year-over-year growth 2025-2030 (%)
Data Table on Mexico - Year-over-year growth 2025-2030 (%)

12.4 Europe - Market size and forecast 2025-2030

Chart on Europe - Market size and forecast 2025-2030 ($ thousand)
Data Table on Europe - Market size and forecast 2025-2030 ($ thousand)
Chart on Europe - Year-over-year growth 2025-2030 (%)
Data Table on Europe - Year-over-year growth 2025-2030 (%)
Chart on Regional Comparison - Europe
Data Table on Regional Comparison - Europe

12.4.1 UK - Market size and forecast 2025-2030

Chart on UK - Market size and forecast 2025-2030 ($ thousand)
Data Table on UK - Market size and forecast 2025-2030 ($ thousand)
Chart on UK - Year-over-year growth 2025-2030 (%)
Data Table on UK - Year-over-year growth 2025-2030 (%)

12.4.2 Germany - Market size and forecast 2025-2030

Chart on Germany - Market size and forecast 2025-2030 ($ thousand)
Data Table on Germany - Market size and forecast 2025-2030 ($ thousand)
Chart on Germany - Year-over-year growth 2025-2030 (%)
Data Table on Germany - Year-over-year growth 2025-2030 (%)

12.4.3 France - Market size and forecast 2025-2030

Chart on France - Market size and forecast 2025-2030 ($ thousand)
Data Table on France - Market size and forecast 2025-2030 ($ thousand)
Chart on France - Year-over-year growth 2025-2030 (%)
Data Table on France - Year-over-year growth 2025-2030 (%)

12.4.4 Italy - Market size and forecast 2025-2030

Chart on Italy - Market size and forecast 2025-2030 ($ thousand)
Data Table on Italy - Market size and forecast 2025-2030 ($ thousand)
Chart on Italy - Year-over-year growth 2025-2030 (%)
Data Table on Italy - Year-over-year growth 2025-2030 (%)

12.4.5 The Netherlands - Market size and forecast 2025-2030

Chart on The Netherlands - Market size and forecast 2025-2030 ($ thousand)
Data Table on The Netherlands - Market size and forecast 2025-2030 ($ thousand)
Chart on The Netherlands - Year-over-year growth 2025-2030 (%)
Data Table on The Netherlands - Year-over-year growth 2025-2030 (%)

12.4.6 Spain - Market size and forecast 2025-2030

Chart on Spain - Market size and forecast 2025-2030 ($ thousand)
Data Table on Spain - Market size and forecast 2025-2030 ($ thousand)
Chart on Spain - Year-over-year growth 2025-2030 (%)
Data Table on Spain - Year-over-year growth 2025-2030 (%)

12.5 APAC - Market size and forecast 2025-2030

Chart on APAC - Market size and forecast 2025-2030 ($ thousand)
Data Table on APAC - Market size and forecast 2025-2030 ($ thousand)
Chart on APAC - Year-over-year growth 2025-2030 (%)
Data Table on APAC - Year-over-year growth 2025-2030 (%)
Chart on Regional Comparison - APAC
Data Table on Regional Comparison - APAC

12.5.1 China - Market size and forecast 2025-2030

Chart on China - Market size and forecast 2025-2030 ($ thousand)
Data Table on China - Market size and forecast 2025-2030 ($ thousand)
Chart on China - Year-over-year growth 2025-2030 (%)
Data Table on China - Year-over-year growth 2025-2030 (%)

12.5.2 Japan - Market size and forecast 2025-2030

Chart on Japan - Market size and forecast 2025-2030 ($ thousand)
Data Table on Japan - Market size and forecast 2025-2030 ($ thousand)
Chart on Japan - Year-over-year growth 2025-2030 (%)
Data Table on Japan - Year-over-year growth 2025-2030 (%)

12.5.3 India - Market size and forecast 2025-2030

Chart on India - Market size and forecast 2025-2030 ($ thousand)
Data Table on India - Market size and forecast 2025-2030 ($ thousand)
Chart on India - Year-over-year growth 2025-2030 (%)
Data Table on India - Year-over-year growth 2025-2030 (%)

12.5.4 South Korea - Market size and forecast 2025-2030

Chart on South Korea - Market size and forecast 2025-2030 ($ thousand)
Data Table on South Korea - Market size and forecast 2025-2030 ($ thousand)
Chart on South Korea - Year-over-year growth 2025-2030 (%)
Data Table on South Korea - Year-over-year growth 2025-2030 (%)

12.5.5 Australia - Market size and forecast 2025-2030

Chart on Australia - Market size and forecast 2025-2030 ($ thousand)
Data Table on Australia - Market size and forecast 2025-2030 ($ thousand)
Chart on Australia - Year-over-year growth 2025-2030 (%)
Data Table on Australia - Year-over-year growth 2025-2030 (%)

12.5.6 Indonesia - Market size and forecast 2025-2030

Chart on Indonesia - Market size and forecast 2025-2030 ($ thousand)
Data Table on Indonesia - Market size and forecast 2025-2030 ($ thousand)
Chart on Indonesia - Year-over-year growth 2025-2030 (%)
Data Table on Indonesia - Year-over-year growth 2025-2030 (%)

12.6 South America - Market size and forecast 2025-2030

Chart on South America - Market size and forecast 2025-2030 ($ thousand)
Data Table on South America - Market size and forecast 2025-2030 ($ thousand)
Chart on South America - Year-over-year growth 2025-2030 (%)
Data Table on South America - Year-over-year growth 2025-2030 (%)
Chart on Regional Comparison - South America
Data Table on Regional Comparison - South America

12.6.1 Brazil - Market size and forecast 2025-2030

Chart on Brazil - Market size and forecast 2025-2030 ($ thousand)
Data Table on Brazil - Market size and forecast 2025-2030 ($ thousand)
Chart on Brazil - Year-over-year growth 2025-2030 (%)
Data Table on Brazil - Year-over-year growth 2025-2030 (%)

12.6.2 Argentina - Market size and forecast 2025-2030

Chart on Argentina - Market size and forecast 2025-2030 ($ thousand)
Data Table on Argentina - Market size and forecast 2025-2030 ($ thousand)
Chart on Argentina - Year-over-year growth 2025-2030 (%)
Data Table on Argentina - Year-over-year growth 2025-2030 (%)

12.6.3 Colombia - Market size and forecast 2025-2030

Chart on Colombia - Market size and forecast 2025-2030 ($ thousand)
Data Table on Colombia - Market size and forecast 2025-2030 ($ thousand)
Chart on Colombia - Year-over-year growth 2025-2030 (%)
Data Table on Colombia - Year-over-year growth 2025-2030 (%)

12.7 Middle East and Africa - Market size and forecast 2025-2030

Chart on Middle East and Africa - Market size and forecast 2025-2030 ($ thousand)
Data Table on Middle East and Africa - Market size and forecast 2025-2030 ($ thousand)
Chart on Middle East and Africa - Year-over-year growth 2025-2030 (%)
Data Table on Middle East and Africa - Year-over-year growth 2025-2030 (%)
Chart on Regional Comparison - Middle East and Africa
Data Table on Regional Comparison - Middle East and Africa

12.7.1 UAE - Market size and forecast 2025-2030

Chart on UAE - Market size and forecast 2025-2030 ($ thousand)
Data Table on UAE - Market size and forecast 2025-2030 ($ thousand)
Chart on UAE - Year-over-year growth 2025-2030 (%)
Data Table on UAE - Year-over-year growth 2025-2030 (%)

12.7.2 Israel - Market size and forecast 2025-2030

Chart on Israel - Market size and forecast 2025-2030 ($ thousand)
Data Table on Israel - Market size and forecast 2025-2030 ($ thousand)
Chart on Israel - Year-over-year growth 2025-2030 (%)
Data Table on Israel - Year-over-year growth 2025-2030 (%)

12.7.3 Saudi Arabia - Market size and forecast 2025-2030

Chart on Saudi Arabia - Market size and forecast 2025-2030 ($ thousand)
Data Table on Saudi Arabia - Market size and forecast 2025-2030 ($ thousand)
Chart on Saudi Arabia - Year-over-year growth 2025-2030 (%)
Data Table on Saudi Arabia - Year-over-year growth 2025-2030 (%)

12.7.4 South Africa - Market size and forecast 2025-2030

Chart on South Africa - Market size and forecast 2025-2030 ($ thousand)
Data Table on South Africa - Market size and forecast 2025-2030 ($ thousand)
Chart on South Africa - Year-over-year growth 2025-2030 (%)
Data Table on South Africa - Year-over-year growth 2025-2030 (%)

12.7.5 Turkey - Market size and forecast 2025-2030

Chart on Turkey - Market size and forecast 2025-2030 ($ thousand)
Data Table on Turkey - Market size and forecast 2025-2030 ($ thousand)
Chart on Turkey - Year-over-year growth 2025-2030 (%)
Data Table on Turkey - Year-over-year growth 2025-2030 (%)

12.8 Market opportunity by geography

Market opportunity by geography ($ thousand)
Data Tables on Market opportunity by geography ($ thousand)

13. Drivers, Challenges, and Opportunity

13.1 Market drivers

Escalating regulatory scrutiny and imperative for compliance
Widespread enterprise adoption of AI and escalation of associated risks
Increasing demand for transparency, explainability, and ethical AI frameworks

13.2 Market challenges

Prohibitive total cost of ownership and implementation
Inherent complexity of technical integration and interoperability
Pervasive skills gap and low organizational AI governance maturity

13.3 Impact of drivers and challenges

Impact of drivers and challenges in 2025 and 2030

13.4 Market opportunities

Ascendancy of explainable AI and model interpretability as core governance requirement
Strategic convergence of AI governance with broader enterprise risk management frameworks
Proliferation of automated solutions for continuous model monitoring and lifecycle validation

14. Competitive Landscape

14.1 Overview

14.2

Overview on criticality of inputs and factors of differentiation

14.3 Landscape disruption

Overview on factors of disruption

14.4 Industry risks

Impact of key risks on business

15. Competitive Analysis

15.1 Companies profiled

Companies covered

15.2 Company ranking index

15.3 Market positioning of companies

Matrix on companies position and classification

15.4 Alteryx Inc.

Alteryx Inc. - Overview
Alteryx Inc. - Product / Service
Alteryx Inc. - Key offerings
SWOT

15.5 Amazon Web Services Inc.

Amazon Web Services Inc. - Overview
Amazon Web Services Inc. - Product / Service
Amazon Web Services Inc. - Key offerings
SWOT

15.6 BigID Inc.

BigID Inc. - Overview
BigID Inc. - Product / Service
BigID Inc. - Key offerings
SWOT

15.7 Collibra

Collibra - Overview
Collibra - Product / Service
Collibra - Key offerings
SWOT

15.8 Dataiku Inc.

Dataiku Inc. - Overview
Dataiku Inc. - Product / Service
Dataiku Inc. - Key offerings
SWOT

15.9 DataRobot Inc.

DataRobot Inc. - Overview
DataRobot Inc. - Product / Service
DataRobot Inc. - Key offerings
SWOT

15.10 Fair Isaac Corp.

Fair Isaac Corp. - Overview
Fair Isaac Corp. - Business segments
Fair Isaac Corp. - Key news
Fair Isaac Corp. - Key offerings
Fair Isaac Corp. - Segment focus
SWOT

15.11 Google LLC

Google LLC - Overview
Google LLC - Product / Service
Google LLC - Key offerings
SWOT

15.12 H2O.ai Inc.

H2O.ai Inc. - Overview
H2O.ai Inc. - Product / Service
H2O.ai Inc. - Key offerings
SWOT

15.13 IBM Corp.

IBM Corp. - Overview
IBM Corp. - Business segments
IBM Corp. - Key news
IBM Corp. - Key offerings
IBM Corp. - Segment focus
SWOT

15.14 Informatica Inc.

Informatica Inc. - Overview
Informatica Inc. - Business segments
Informatica Inc. - Key offerings
Informatica Inc. - Segment focus
SWOT

15.15 Microsoft Corp.

Microsoft Corp. - Overview
Microsoft Corp. - Business segments
Microsoft Corp. - Key news
Microsoft Corp. - Key offerings
Microsoft Corp. - Segment focus
SWOT

15.16 SAS Institute Inc.

SAS Institute Inc. - Overview
SAS Institute Inc. - Product / Service
SAS Institute Inc. - Key offerings
SWOT

15.17 Seldon Technologies

Seldon Technologies - Overview
Seldon Technologies - Product / Service
Seldon Technologies - Key offerings
SWOT

15.18 Trust Arc Inc.

Trust Arc Inc. - Overview
Trust Arc Inc. - Product / Service
Trust Arc Inc. - Key offerings
SWOT

16. Appendix

16.1 Scope of the report

Market definition
Objectives
Notes and caveats

16.2 Inclusions and exclusions checklist

Inclusions checklist
Exclusions checklist

16.3 Currency conversion rates for US$

16.4 Research methodology

16.5 Data procurement

Information sources

16.6 Data validation

16.7 Validation techniques employed for market sizing

16.8 Data synthesis

16.9 360 degree market analysis

16.10 List of abbreviations

Research Methodology

Technavio presents a detailed picture of the market by way of study, synthesis, and summation of data from multiple sources. The analysts have presented the various facets of the market with a particular focus on identifying the key industry influencers. The data thus presented is comprehensive, reliable, and the result of extensive research, both primary and secondary.

INFORMATION SOURCES

Primary sources

  • Manufacturers and suppliers
  • Channel partners
  • Industry experts
  • Strategic decision makers

Secondary sources

  • Industry journals and periodicals
  • Government data
  • Financial reports of key industry players
  • Historical data
  • Press releases

DATA ANALYSIS

Data Synthesis

  • Collation of data
  • Estimation of key figures
  • Analysis of derived insights

Data Validation

  • Triangulation with data models
  • Reference against proprietary databases
  • Corroboration with industry experts

REPORT WRITING

Qualitative

  • Market drivers
  • Market challenges
  • Market trends
  • Five forces analysis

Quantitative

  • Market size and forecast
  • Market segmentation
  • Geographical insights
  • Competitive landscape

Interested in this report?

Get your sample now to see our research methodology and insights!

Download Now

Frequently Asked Questions

Ai Governance Tools market growth will increase by USD 6977430.1 thousand thousand during 2026-2030.

The Ai Governance Tools market is expected to grow at a CAGR of 48.7% during 2026-2030.

Ai Governance Tools market is segmented by End-user (Large enterprises, Mid-market companies, SMBs and startups) Type (Risk and compliance monitoring, Model lifecycle management, Bias detection and fairness auditing, Explainability and transparency tools) Deployment (Cloud-native SaaS, Hybrid or multi-cloud, On-premises integration)

Alteryx Inc., Amazon Web Services Inc., ARTHUR, BigID Inc., Collibra, Credo AI, Dataiku Inc., DataRobot Inc., Fair Isaac Corp., Fiddler AI, Google LLC, H2O.ai Inc., IBM Corp., Informatica Inc., Microsoft Corp., Monitaur Inc., OneTrust LLC, SAS Institute Inc., Seldon Technologies, Trust Arc Inc. are a few of the key vendors in the Ai Governance Tools market.

North America will register the highest growth rate of 37.4% among the other regions. Therefore, the Ai Governance Tools market in North America is expected to garner significant business opportunities for the vendors during the forecast period.

US, Canada, Mexico, UK, Germany, France, Italy, The Netherlands, Spain, China, Japan, India, South Korea, Australia, Indonesia, Brazil, Argentina, Colombia, UAE, Israel, Saudi Arabia, South Africa, Turkey

  • Escalating regulatory scrutiny and imperative for compliance is the driving factor this market.

The Ai Governance Tools market vendors should focus on grabbing business opportunities from the End-user segment as it accounted for the largest market share in the base year.
RIA - Research AI Assistant
Ask RIA