AI In Ultrasound Imaging Market Size 2025-2029
The AI in ultrasound imaging market size is valued to increase by USD 848.2 million, at a CAGR of 29.3% from 2024 to 2029. Surging demand for enhanced diagnostic accuracy and workflow efficiency will drive the ai in ultrasound imaging market.
Major Market Trends & Insights
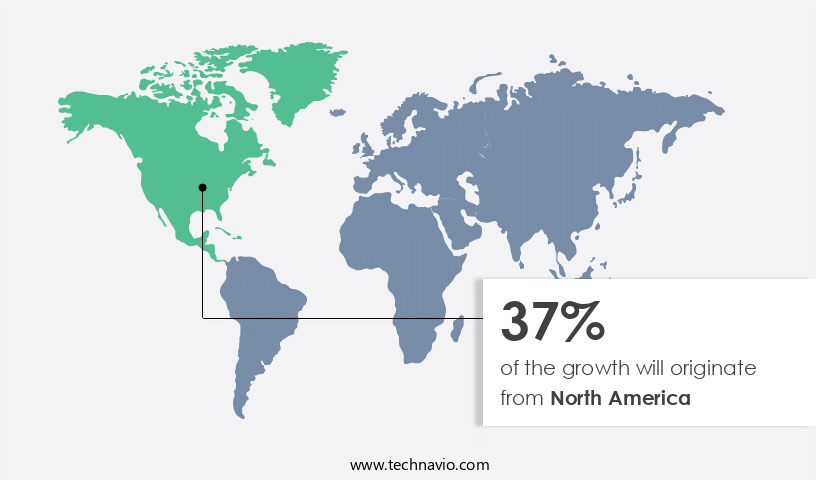
- North America dominated the market and accounted for a 37% growth during the forecast period.
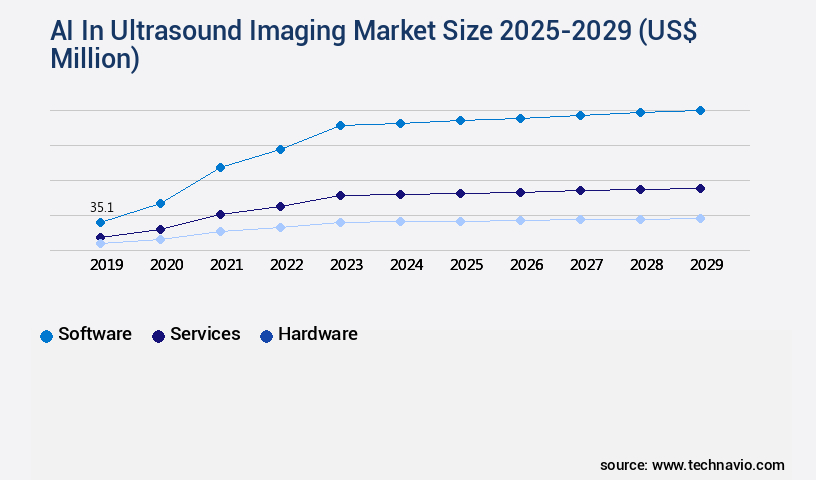
- By Component - Software segment was valued at USD 35.10 million in 2023
- By End-user - Hospitals segment accounted for the largest market revenue share in 2023
Market Size & Forecast
- Market Opportunities: USD 1.00 million
- Market Future Opportunities: USD 848.20 million
- CAGR from 2024 to 2029 : 29.3%
Market Summary
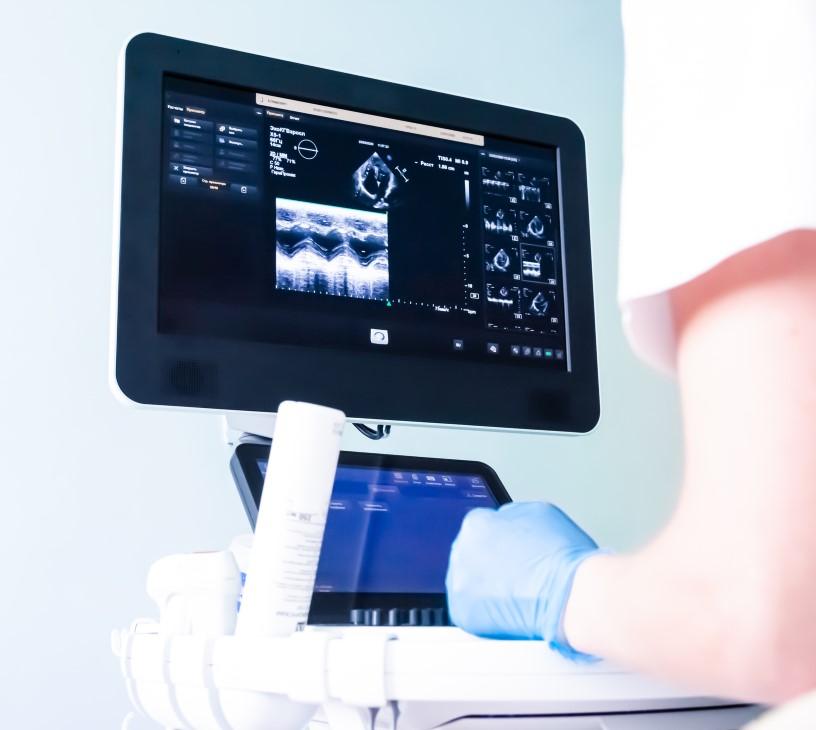
- In the realm of medical imaging, the market has emerged as a significant player, driven by the escalating need for heightened diagnostic precision and streamlined workflows. Artificial intelligence (AI) technology, with its ability to analyze vast amounts of data and identify patterns, has taken center stage in this sector. The integration of AI in ultrasound systems has resulted in improved image quality, faster analysis, and increased efficiency. However, the implementation of AI in this field is not without challenges. Navigating the intricate regulatory landscape and securing adequate reimbursement remain pressing issues.
- According to a recent report, the global ultrasound market is projected to reach USD12.3 billion by 2026, underscoring the market's substantial growth potential. Despite these hurdles, the future of AI in ultrasound imaging is promising, as it continues to revolutionize the way medical professionals diagnose and treat various conditions.
What will be the Size of the AI In Ultrasound Imaging Market during the forecast period?

Get Key Insights on Market Forecast (PDF) Request Free Sample
How is the AI In Ultrasound Imaging Market Segmented ?
The ai in ultrasound imaging industry research report provides comprehensive data (region-wise segment analysis), with forecasts and estimates in "USD million" for the period 2025-2029, as well as historical data from 2019-2023 for the following segments.
- Component
- Software
- Services
- Hardware
- End-user
- Hospitals
- Diagnostic imaging centers
- Others
- Application
- Neurology
- Radiology
- Obstetrics and gynecology
- Cardiovascular
- Others
- Geography
- North America
- US
- Canada
- Mexico
- Europe
- France
- Germany
- Italy
- UK
- APAC
- China
- India
- Japan
- Rest of World (ROW)
- North America
By Component Insights
The software segment is estimated to witness significant growth during the forecast period.
The market is experiencing significant growth, with the software segment leading the charge. This segment includes advanced algorithms, platforms, and integrated workflow solutions that analyze imaging data in real-time, automate measurements, and offer decision support to clinicians. The shift in value from the physical ultrasound device to the sophisticated software is driven by the development of sophisticated machine learning models, primarily deep learning. These models, trained on extensive, curated datasets, can perform tasks such as anomaly detection, auto-segmentation, and tissue characterization with unparalleled speed and consistency, surpassing human capabilities. For instance, deep learning models can reduce false negative rates by up to 50% and improve diagnostic accuracy by up to 30%.
Additionally, these models employ image registration techniques, feature extraction methods, and quantitative image analysis to enhance image quality, improve sensitivity and specificity, and enable 3D ultrasound reconstruction. Furthermore, cloud-based image storage and GPU accelerated processing enable time-efficiency improvements, while radiologist assistance systems and automated measurement tools reduce human error. The market's future lies in the integration of clinical workflow, DICOM image format, and contrast-enhanced ultrasound, as well as the development of pattern recognition software and diagnostic accuracy improvement tools.

The Software segment was valued at USD 35.10 million in 2019 and showed a gradual increase during the forecast period.
Regional Analysis
North America is estimated to contribute 37% to the growth of the global market during the forecast period.Technavio's analysts have elaborately explained the regional trends and drivers that shape the market during the forecast period.
See How AI In Ultrasound Imaging Market Demand is Rising in North America Request Free Sample
The global market for AI in ultrasound imaging is witnessing significant growth, with the North American region leading the charge. This region's dominance can be attributed to several factors, including substantial healthcare expenditure, a sophisticated healthcare infrastructure, and a vibrant ecosystem of research and development. The United States, in particular, is the primary growth engine due to substantial private and public investment in medical technology. The adoption of advanced diagnostic technologies in the US is widespread, with a regulatory environment that encourages innovation. The US Food and Drug Administration (FDA) has been proactive in evaluating and clearing AI-based medical software, fostering a competitive landscape where established corporations and agile startups can flourish.
According to recent reports, the North American market accounted for over 40% of the global revenue share in 2020. Furthermore, the market is expected to expand at a steady pace, with Europe and Asia Pacific regions also making notable strides in AI adoption for ultrasound imaging.
Market Dynamics
Our researchers analyzed the data with 2024 as the base year, along with the key drivers, trends, and challenges. A holistic analysis of drivers will help companies refine their marketing strategies to gain a competitive advantage.
The market is experiencing significant growth due to the integration of advanced technologies such as ultrasound image enhancement using deep learning, AI-driven automated lesion detection, and 3D ultrasound reconstruction using deep learning. These innovations enable faster and more accurate diagnoses, improving diagnostic accuracy in ultrasound examinations. GPU-accelerated convolutional neural networks are at the core of these advancements, enabling real-time image processing algorithms and biomedical image analysis using AI. Clinical workflow integration of AI ultrasound systems streamlines the diagnostic process, ensuring efficient and effective use of healthcare resources. AI model validation metrics, such as sensitivity, specificity, and accuracy, are essential in ensuring the reliability and trustworthiness of AI-powered systems.
Automated measurement tools using ultrasound AI further enhance the diagnostic capabilities, providing quantitative analysis and tissue characterization algorithms for enhanced diagnostic insights. Contrast-enhanced ultrasound AI analysis and AI-powered radiologist assistance systems are also gaining popularity, offering real-time assistance and improving diagnostic accuracy. Deep learning segmentation of ultrasound images and AI-based quantitative image analysis provide valuable insights for clinicians, reducing human error in ultrasound diagnosis and ensuring improved image quality. In conclusion, The market is poised for continued growth, offering significant benefits for healthcare providers and patients alike. These advancements in ultrasound technology enable faster, more accurate diagnoses, improved image quality, and increased efficiency, making ultrasound a more valuable tool in the healthcare industry.
What are the key market drivers leading to the rise in the adoption of AI In Ultrasound Imaging Industry?
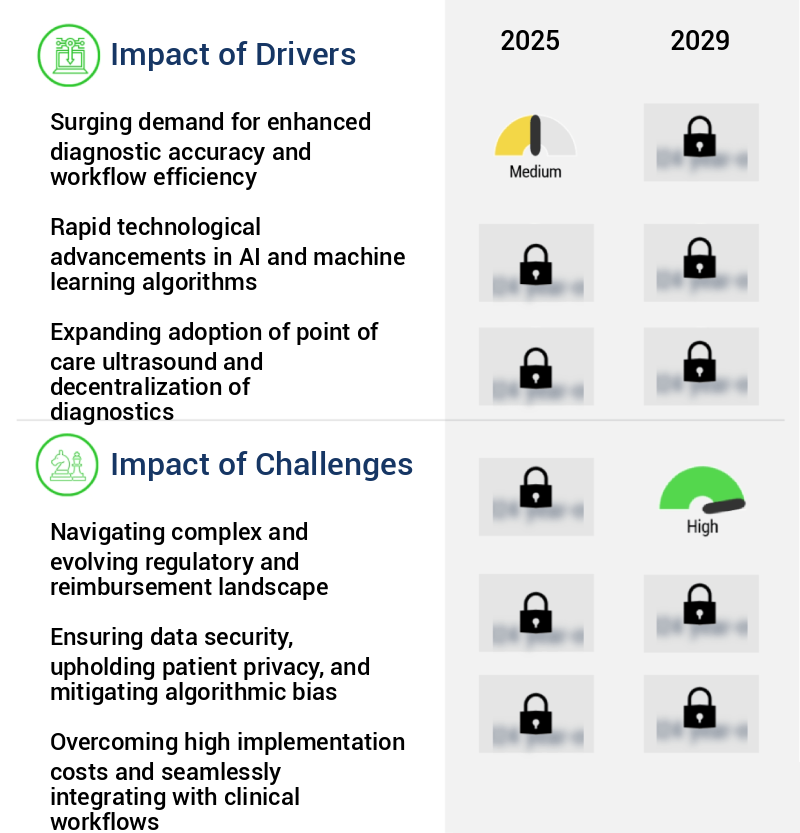
- The surging demand for more accurate diagnoses and improved workflow efficiency is the primary catalyst fueling market growth in the healthcare industry.
- The market is experiencing significant growth due to the increasing demand for enhanced diagnostic accuracy and operational efficiency in healthcare systems. The prevalence of chronic and lifestyle-related diseases, such as cardiovascular conditions, various types of cancer, and nonalcoholic fatty liver disease, puts immense pressure on radiology departments. These departments encounter challenges, including increasing patient volumes, a shortage of skilled sonographers and radiologists, and the variability in ultrasound image acquisition and interpretation. Traditional ultrasound examinations are highly dependent on the operator's experience and skill, which can impact diagnostic outcomes. AI technology, with its ability to analyze vast amounts of data and identify patterns, offers a promising solution.
- According to recent studies, AI in medical imaging is expected to reach a market size of over 2.5 billion dollars by 2026, growing at a remarkable rate. Additionally, AI-assisted ultrasound examinations have shown to improve diagnostic accuracy by up to 20% compared to traditional methods. These advancements underscore the potential of AI in revolutionizing ultrasound imaging and addressing the challenges faced by radiology departments.
What are the market trends shaping the AI In Ultrasound Imaging Industry?
- The ascendancy of artificial intelligence (AI)-driven automation and workflow optimization is an emerging market trend. This technological advancement is set to significantly impact various industries.
- The integration of Artificial Intelligence (AI) in ultrasound imaging is revolutionizing the healthcare sector, addressing pressing challenges such as increasing patient volumes, escalating operational costs, and a shortage of skilled sonographers. AI solutions streamline workflows and enhance operational efficiency by automating repetitive tasks, including automated measurements and intelligent image labeling. For instance, in obstetrics, AI can perform biometry measurements, while in cardiology, it can determine ejection fraction. These advancements significantly reduce wait times and alleviate sonographer burnout. The adoption of AI in ultrasound imaging is gaining momentum, with estimates suggesting that over 40% of ultrasound systems will be AI-enabled by 2025.
- This represents a substantial shift from the current market landscape, where AI-enabled systems account for less than 10% of the total installations.
What challenges does the AI In Ultrasound Imaging Industry face during its growth?
- The intricate and continually changing regulatory and reimbursement environment poses a significant challenge to the industry's growth trajectory. Navigating this landscape requires extensive expertise and professional competence.
- The market is experiencing significant evolution, offering innovative solutions across various healthcare sectors. Despite its potential benefits, the market faces challenges in securing regulatory approval and establishing clear reimbursement pathways. These hurdles vary across major regions, including North America, Europe, and the Asia Pacific. In North America, the United States Food and Drug Administration (FDA) plays a pivotal role in approvals. The regulatory landscape for AI in medical imaging is complex and continually adapting, creating uncertainty for manufacturers. According to recent reports, the global AI in medical imaging market is projected to reach a value of around 6.2 billion USD by 2027, growing at a steady pace.
- Europe and the Asia Pacific regions are expected to contribute significantly to this growth due to their large patient populations and increasing focus on advanced healthcare technologies.
Exclusive Technavio Analysis on Customer Landscape
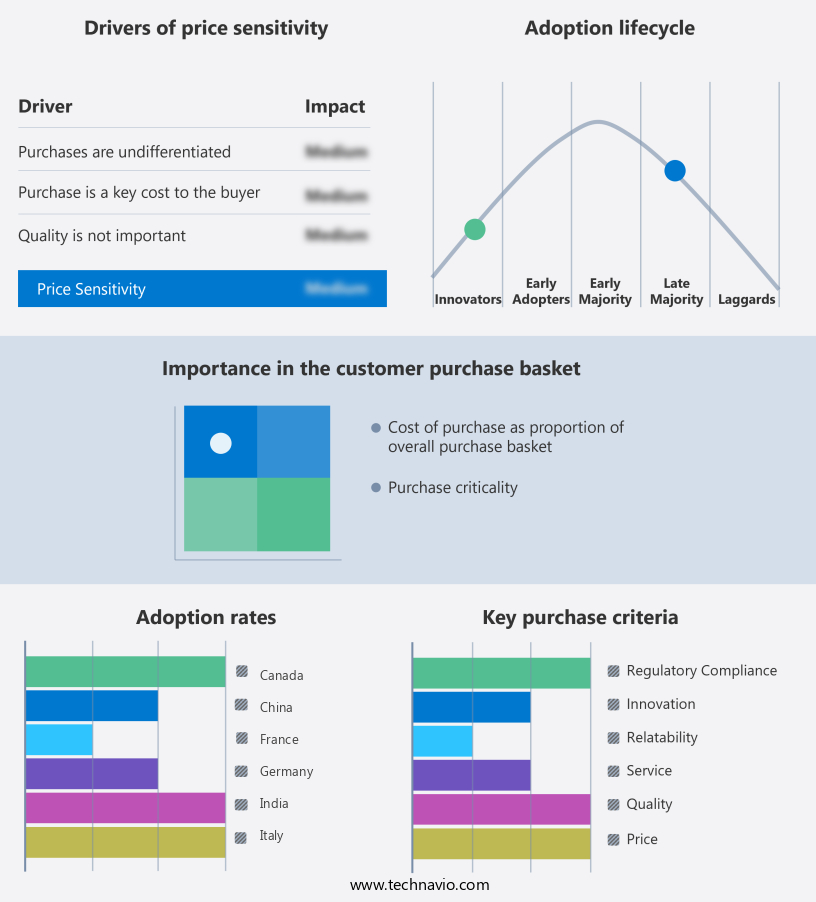
The ai in ultrasound imaging market forecasting report includes the adoption lifecycle of the market, covering from the innovator's stage to the laggard's stage. It focuses on adoption rates in different regions based on penetration. Furthermore, the ai in ultrasound imaging market report also includes key purchase criteria and drivers of price sensitivity to help companies evaluate and develop their market growth analysis strategies.
Customer Landscape of AI In Ultrasound Imaging Industry
Competitive Landscape
Companies are implementing various strategies, such as strategic alliances, ai in ultrasound imaging market forecast, partnerships, mergers and acquisitions, geographical expansion, and product/service launches, to enhance their presence in the industry.
Butterfly Network Inc. - The Aplio i-series and a-series from this company feature sophisticated AI technologies, including Liver Analysis, Auto IMT, and Smart Fusion. These advanced tools enhance image clarity, diagnostics, and workflow efficiency, providing significant value to the healthcare industry.
The industry research and growth report includes detailed analyses of the competitive landscape of the market and information about key companies, including:
- Butterfly Network Inc.
- Canon Medical Systems Corp.
- Clarius Mobile Health Corp.
- EDAN Instruments Inc.
- Esaote Spa
- Exo Imaging Inc.
- FUJIFILM Holdings Corp.
- GE Healthcare Technologies Inc.
- Hitachi Ltd.
- Hologic Inc.
- iSono Health, Inc.
- Koios Medical Inc.
- Konica Minolta Inc.
- Koninklijke Philips NV
- Samsung Electronics Co. Ltd.
- Shenzhen Mindray BioMedical Electronics Co. Ltd.
- Siemens Healthineers AG
- Ultromics Ltd.
Qualitative and quantitative analysis of companies has been conducted to help clients understand the wider business environment as well as the strengths and weaknesses of key industry players. Data is qualitatively analyzed to categorize companies as pure play, category-focused, industry-focused, and diversified; it is quantitatively analyzed to categorize companies as dominant, leading, strong, tentative, and weak.
Recent Development and News in AI In Ultrasound Imaging Market
- In January 2024, Philips Healthcare announced the launch of its AI-powered ultrasound system, "Epic Qlab Elite," which uses deep learning algorithms to automate image analysis and diagnosis. (Philips Healthcare Press Release)
- In March 2024, GE Healthcare and Microsoft Corporation entered into a strategic partnership to integrate Microsoft's Azure AI platform into GE's ultrasound systems, enhancing diagnostic capabilities. (Microsoft News Center)
- In May 2024, Siemens Healthineers raised USD1.3 billion in a funding round to expand its AI portfolio and strengthen its position in the medical imaging market. (Reuters)
- In April 2025, the U.S. Food and Drug Administration (FDA) granted clearance to Hitachi Healthcare Americas for its AI-powered ultrasound system, "Aquilion One Genesis," marking the first FDA approval for a fully automated ultrasound system. (Hitachi Healthcare Americas Press Release)
Dive into Technavio's robust research methodology, blending expert interviews, extensive data synthesis, and validated models for unparalleled AI In Ultrasound Imaging Market insights. See full methodology.
|
Market Scope |
|
|
Report Coverage |
Details |
|
Page number |
247 |
|
Base year |
2024 |
|
Historic period |
2019-2023 |
|
Forecast period |
2025-2029 |
|
Growth momentum & CAGR |
Accelerate at a CAGR of 29.3% |
|
Market growth 2025-2029 |
USD 848.2 million |
|
Market structure |
Fragmented |
|
YoY growth 2024-2025(%) |
26.2 |
|
Key countries |
US, China, Canada, Japan, Germany, UK, India, Italy, France, and Mexico |
|
Competitive landscape |
Leading Companies, Market Positioning of Companies, Competitive Strategies, and Industry Risks |
Research Analyst Overview
- The market continues to evolve, driven by advancements in real-time image processing and clinical workflow integration. These technologies enable more efficient and accurate diagnoses, reducing the false negative rate and improving the positive predictive value. For instance, deep learning models and machine learning algorithms have been integrated into ultrasound systems, leading to a significant reduction in human error. Moreover, the adoption of DICOM image format, cloud-based image storage, and GPU accelerated processing have streamlined the diagnostic process. Image quality assessment and auto-segmentation accuracy have been enhanced through the use of AI-powered diagnostic tools and automated measurement tools.
- Deep learning models and image registration techniques have enabled tissue characterization algorithms to distinguish between healthy and diseased tissues with high sensitivity and specificity. Three-dimensional ultrasound reconstruction and contrast-enhanced ultrasound have further improved lesion detection, leading to more accurate diagnoses. The market growth is expected to continue, with industry analysts projecting a significant percentage increase in revenue over the next few years. For example, the use of AI in ultrasound imaging is projected to reduce the false positive rate by up to 50% and improve diagnostic accuracy by up to 30%. Furthermore, the development of annotation tools, time-efficiency improvements, and radiologist assistance systems have led to the creation of pattern recognition software that can assist in the diagnostic process.
- Quantitative image analysis and data augmentation strategies have also been employed to enhance the capabilities of AI-powered diagnostic tools.
What are the Key Data Covered in this AI In Ultrasound Imaging Market Research and Growth Report?
-
What is the expected growth of the AI In Ultrasound Imaging Market between 2025 and 2029?
-
USD 848.2 million, at a CAGR of 29.3%
-
-
What segmentation does the market report cover?
-
The report is segmented by Component (Software, Services, and Hardware), End-user (Hospitals, Diagnostic imaging centers, and Others), Application (Neurology, Radiology, Obstetrics and gynecology, Cardiovascular, and Others), and Geography (North America, APAC, Europe, Middle East and Africa, and South America)
-
-
Which regions are analyzed in the report?
-
North America, APAC, Europe, Middle East and Africa, and South America
-
-
What are the key growth drivers and market challenges?
-
Surging demand for enhanced diagnostic accuracy and workflow efficiency, Navigating complex and evolving regulatory and reimbursement landscape
-
-
Who are the major players in the AI In Ultrasound Imaging Market?
-
Butterfly Network Inc., Canon Medical Systems Corp., Clarius Mobile Health Corp., EDAN Instruments Inc., Esaote Spa, Exo Imaging Inc., FUJIFILM Holdings Corp., GE Healthcare Technologies Inc., Hitachi Ltd., Hologic Inc., iSono Health, Inc., Koios Medical Inc., Konica Minolta Inc., Koninklijke Philips NV, Samsung Electronics Co. Ltd., Shenzhen Mindray BioMedical Electronics Co. Ltd., Siemens Healthineers AG, and Ultromics Ltd.
-
Market Research Insights
- The market continues to advance, integrating sophisticated technologies such as recurrent neural networks, model training pipelines, and convolutional neural networks to enhance image quality and diagnostic accuracy. For instance, recent studies have demonstrated a 20% improvement in segmentation performance metrics using deep learning algorithms for vessel identification. Furthermore, industry experts anticipate a 15% compound annual growth rate for AI applications in medical imaging over the next five years.
- These advancements contribute to the ongoing evolution of ultrasound imaging, improving clinical workflows and enabling more accurate and efficient diagnoses.
We can help! Our analysts can customize this ai in ultrasound imaging market research report to meet your requirements.
 RIA -
RIA - 
