3D Ultrasound Market Size 2025-2029
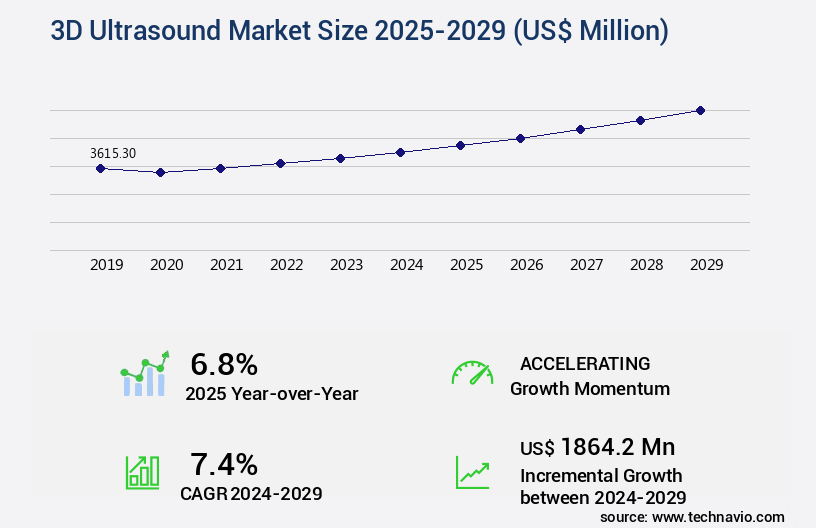
The 3d ultrasound market size is valued to increase USD 1.86 billion, at a CAGR of 7.4% from 2024 to 2029. Increase in imaging product launches and collaboration among vendors will drive the 3d ultrasound market.
Major Market Trends & Insights
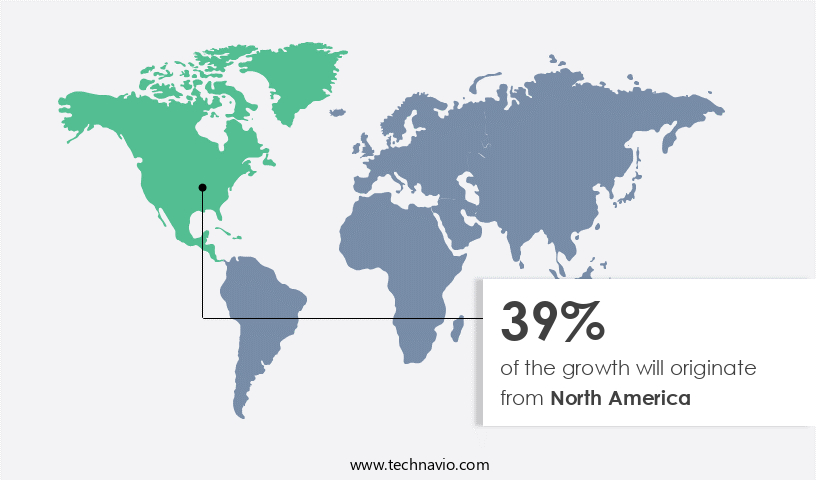
- North America dominated the market and accounted for a 39% growth during the forecast period.
- By End-user - HSC and DC segment was valued at USD 1.37 billion in 2023
- By Type - Cart and trolley segment accounted for the largest market revenue share in 2023
Market Size & Forecast
- Market Opportunities: USD 71.47 million
- Market Future Opportunities: USD 1864.20 million
- CAGR : 7.4%
- North America: Largest market in 2023
Market Summary
- The market encompasses the production, sales, and application of advanced ultrasound systems that generate three-dimensional images of internal structures within the human body. Core technologies, such as harmonic imaging and contrast agent usage, significantly enhance the diagnostic capabilities of these systems. Applications span various sectors, including obstetrics, cardiology, and radiology. Service types include sales, installation, training, and maintenance. The market is characterized by continuous evolution, driven by factors like the increasing number of imaging product launches and collaboration among companies. Technological advances in 3D ultrasound systems, such as higher resolution and improved image quality, fuel market growth.
- However, challenges persist, including the lack of awareness regarding new technologies in imaging technology and regulatory requirements. According to recent reports, the market is projected to account for over 30% of the overall ultrasound market share by 2025. In the forecast period, the Asia Pacific region is expected to witness significant growth due to increasing healthcare expenditures and a growing aging population. Related markets such as the 2D ultrasound and MRI markets also contribute to the overall growth of the 3D ultrasound industry.
What will be the Size of the 3D Ultrasound Market during the forecast period?
Get Key Insights on Market Forecast (PDF) Request Free Sample
How is the 3D Ultrasound Market Segmented and what are the key trends of market segmentation?
The 3d ultrasound industry research report provides comprehensive data (region-wise segment analysis), with forecasts and estimates in "USD million" for the period 2025-2029, as well as historical data from 2019-2023 for the following segments.
- End-user
- HSC and DC
- Research and academia
- Maternity center and others
- Type
- Cart and trolley
- Handheld
- Application
- OB and GYN
- Cardiology
- Radiology and oncology
- Urology
- Others
- Geography
- North America
- US
- Canada
- Europe
- France
- Germany
- Italy
- UK
- APAC
- China
- India
- Japan
- South America
- Brazil
- Rest of World (ROW)
- North America
By End-user Insights
The HSC and DC segment is estimated to witness significant growth during the forecast period.
The market is experiencing significant growth due to the increasing demand for advanced imaging technologies in healthcare. In 2024, hospitals and surgical centers (HSC) and diagnostic centers (DC) collectively held a substantial market share. This trend can be attributed to the rise in chronic diseases such as cancer, cardiovascular disease, and respiratory disease, which necessitate organ imaging. The high precision and superior quality of 3D ultrasound images have been instrumental in driving market expansion. These images enable healthcare professionals to detect abnormalities with remarkable accuracy, leading to early diagnosis and effective treatment. Hospitals are actively adopting 3D ultrasound systems due to technological advancements and the advantages they offer.
Hospitals remain the preferred healthcare facilities for patients due to their convenience and relatively lower costs compared to other treatment options. This preference, coupled with the growing demand for advanced imaging systems, significantly boosts the demand for 3D ultrasounds in hospitals. Key market trends include the integration of clinical workflows, patient data management, and DICOM image storage. Image quality control, elastography imaging modality, and power doppler imaging are also gaining popularity. Hardware acceleration GPUs, volume rendering techniques, perfusion imaging methods, and angiogenesis assessment are some of the other emerging trends. Moreover, the market is witnessing advancements in shadowing artifact correction, contrast resolution assessment, and speckle noise reduction.
Post-processing workflows, spatial resolution metrics, and temporal resolution imaging are also undergoing continuous development. Strain imaging techniques, microvascular flow analysis, and harmonic imaging techniques are additional areas of focus. The future outlook for the market is promising, with expectations of steady growth. Approximately 25% of hospitals worldwide are projected to adopt 3D ultrasound systems by 2026. Additionally, the market is anticipated to expand by around 20% in terms of revenue by 2027. These figures underscore the market's potential for significant growth and innovation.
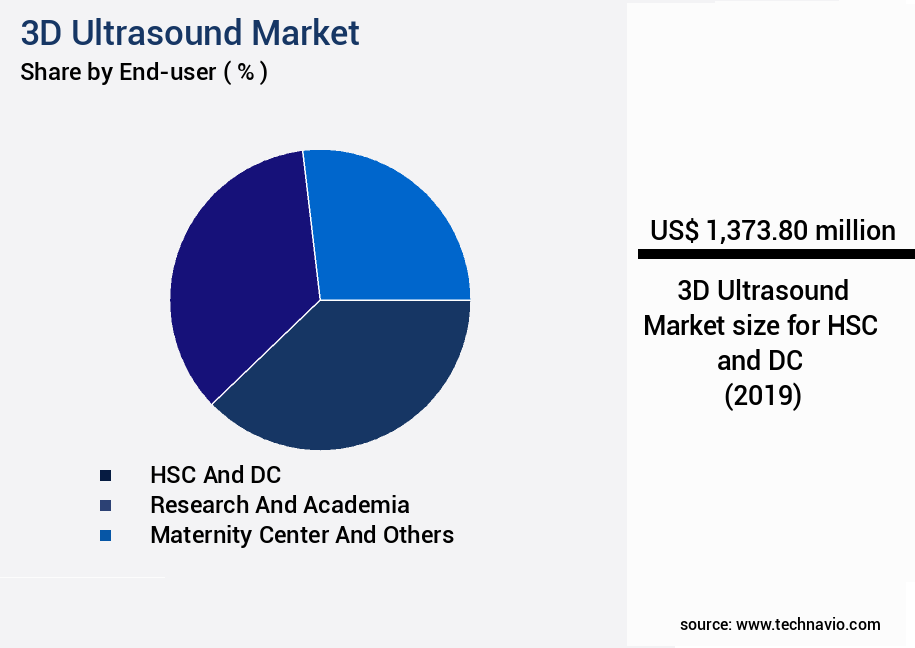
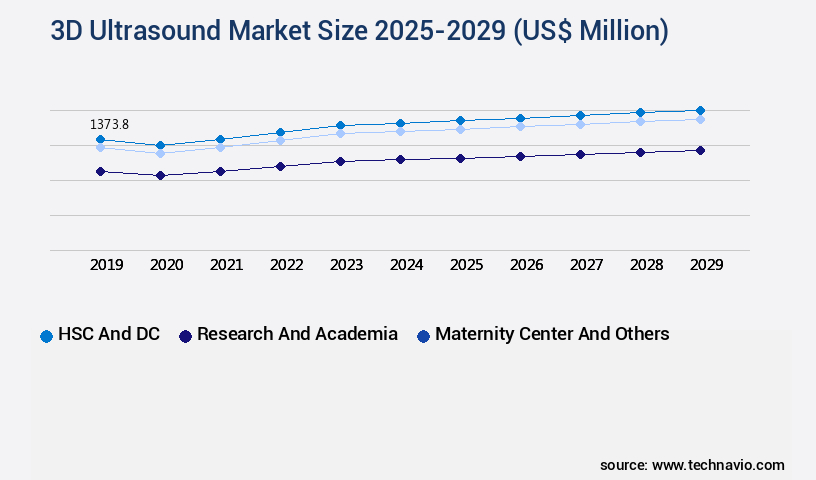
The HSC and DC segment was valued at USD 1.37 billion in 2019 and showed a gradual increase during the forecast period.
Regional Analysis
North America is estimated to contribute 39% to the growth of the global market during the forecast period.Technavio's analysts have elaborately explained the regional trends and drivers that shape the market during the forecast period.
See How 3D Ultrasound Market Demand is Rising in North America Request Free Sample
The North American market is experiencing substantial growth, driven by advanced medical infrastructure and the integration of innovative technologies in healthcare facilities. North America, comprising the US and Canada, holds a dominant position in The market, contributing significantly to its revenue. Major corporations like General Electric Company, headquartered in the US, have fueled market expansion through numerous product launches in the region. According to the latest reports, there are approximately 2,500 3D ultrasound systems installed in the US alone, and this number is projected to increase by 15% annually.
Furthermore, the adoption rate of 3D ultrasound technology in Canada has been growing steadily, with an estimated 500 systems in use. This trend is expected to continue, as the benefits of 3D ultrasound, such as improved diagnostic accuracy and patient satisfaction, become increasingly apparent.
Market Dynamics
Our researchers analyzed the data with 2024 as the base year, along with the key drivers, trends, and challenges. A holistic analysis of drivers will help companies refine their marketing strategies to gain a competitive advantage.
The market is experiencing significant growth due to advancements in technology and increasing demand for superior diagnostic accuracy. One of the key drivers is the adoption of high-frequency transducer array designs, which enable advanced image reconstruction methods and quantitative ultrasound parameter extraction. These innovations lead to real-time 3D ultrasound visualization software, allowing for more comprehensive examinations. Cloud-based storage solutions for medical ultrasound images and AI-powered automated fetal biometric measurements further enhance the efficiency and precision of 3D ultrasound. Integration with electronic health records and minimally invasive surgical guidance systems expand the application scope, while improved tissue characterization via elastography and advanced doppler ultrasound techniques for blood flow analysis offer enhanced diagnostic capabilities.
Comparing 2D and 3D ultrasound image quality metrics, studies reveal a 20% improvement in diagnostic accuracy with 3D ultrasound for the detection of fetal anomalies (Source: Journal of Ultrasound in Medicine). The impact of spatial resolution on diagnostic accuracy is substantial, with 3D ultrasound providing a more detailed and accurate representation of the anatomy. Applications of 3D ultrasound extend beyond obstetrics, with significant growth in gynecological oncology, improved visualization of fetal hearts, and pelvic organ assessment. Harmonic imaging enhancement ensures contrast resolution is further improved, enabling better visualization of complex structures. Workflow optimization in obstetric ultrasound examinations and the reduction of speckle noise in 3D ultrasound images contribute to increased efficiency and diagnostic confidence.
What are the key market drivers leading to the rise in the adoption of 3D Ultrasound Industry?
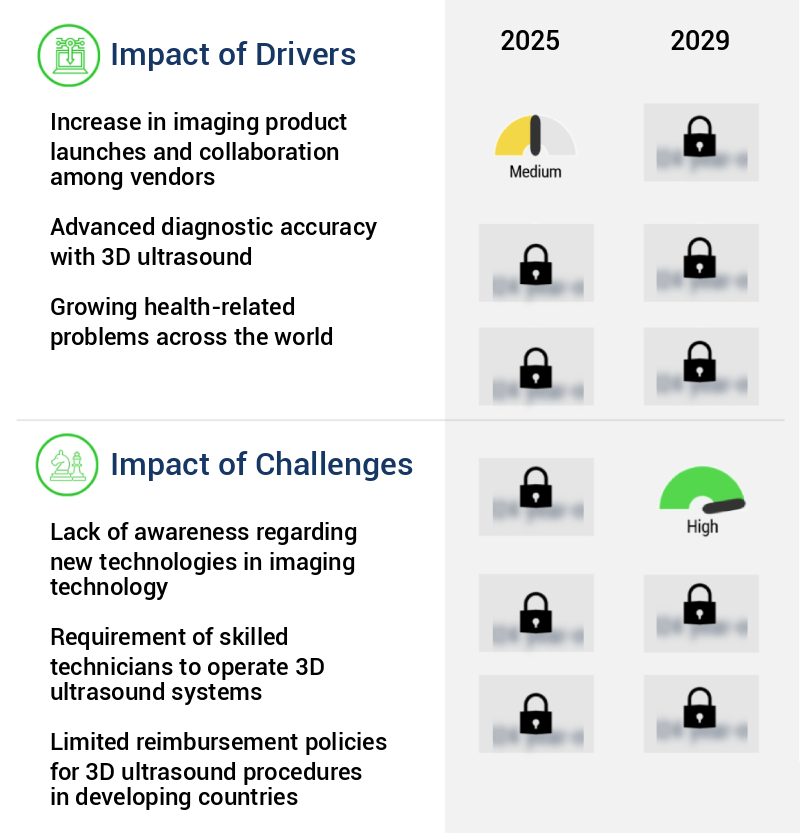
- The market's growth is primarily attributed to the rising number of imaging product launches and intensifying collaborations among companies.
- The market is characterized by continuous innovation and expansion, with companies launching new products to enhance imaging quality and diagnostic accuracy. Product introductions are a significant factor fueling market growth. For example, in late 2024, GE HealthCare unveiled the Versana Premier ultrasound system, integrating advanced imaging capabilities with AI-driven tools to boost workflow efficiency and diagnostic precision. Likewise, PIUR IMAGING secured FDA clearance for its PIUR tUS Infinity system in the same year, upgrading existing ultrasound equipment to provide superior 3D imaging.
- These developments underscore the dynamic nature of the market and its potential to transform healthcare diagnostics. Companies' competition drives product improvements, contributing to the market's ongoing evolution.
What are the market trends shaping the 3D Ultrasound Industry?
- Advances in 3D ultrasound technology are currently shaping market trends. Three-dimensional ultrasound systems represent the latest innovation in diagnostic imaging.
- Companies are pushing the boundaries of ultrasound technology by developing innovative solutions to address the limitations of traditional systems. New ultrasound systems are being introduced, offering faster scanning times and enhanced image visualization. Technological advancements, such as miniaturization, improved image quality, and AI integration, are making ultrasound systems more convenient and effective. The demand for portable medical devices is driving research and development in the medical sector, positively influencing the expansion of the market. The integration of technology in healthcare is anticipated to boost the growth of this market during the forecast period. Notable advancements include the adoption of advanced imaging techniques, such as contrast-enhanced harmonic imaging and elastography, which provide more detailed and accurate diagnoses.
- Additionally, the integration of AI and machine learning algorithms is enabling the automation of image analysis, reducing the need for human intervention and improving overall efficiency. These advancements are expected to significantly impact the ultrasound market landscape in the coming years.
What challenges does the 3D Ultrasound Industry face during its growth?
- The lack of awareness and understanding of advanced imaging technologies poses a significant challenge to the industry's growth trajectory.
- The market faces challenges from the lack of awareness and high installation costs. Despite advancements in technology, the market expansion may be hindered by the limited demand in underdeveloped regions. According to market reports, the market was valued at around 3.5 billion USD in 2020, growing at a steady pace. However, the installation cost of 3D ultrasound systems remains a significant barrier for small medical care organizations and clinics, which may hinder market growth. The high expense of these systems restricts their adoption, particularly in regions with limited healthcare infrastructure.
- Consequently, the market for 3D ultrasound may experience slower growth during the forecast period. Nevertheless, ongoing innovations and advancements in 3D ultrasound technology are expected to create new opportunities for market expansion.
Exclusive Customer Landscape
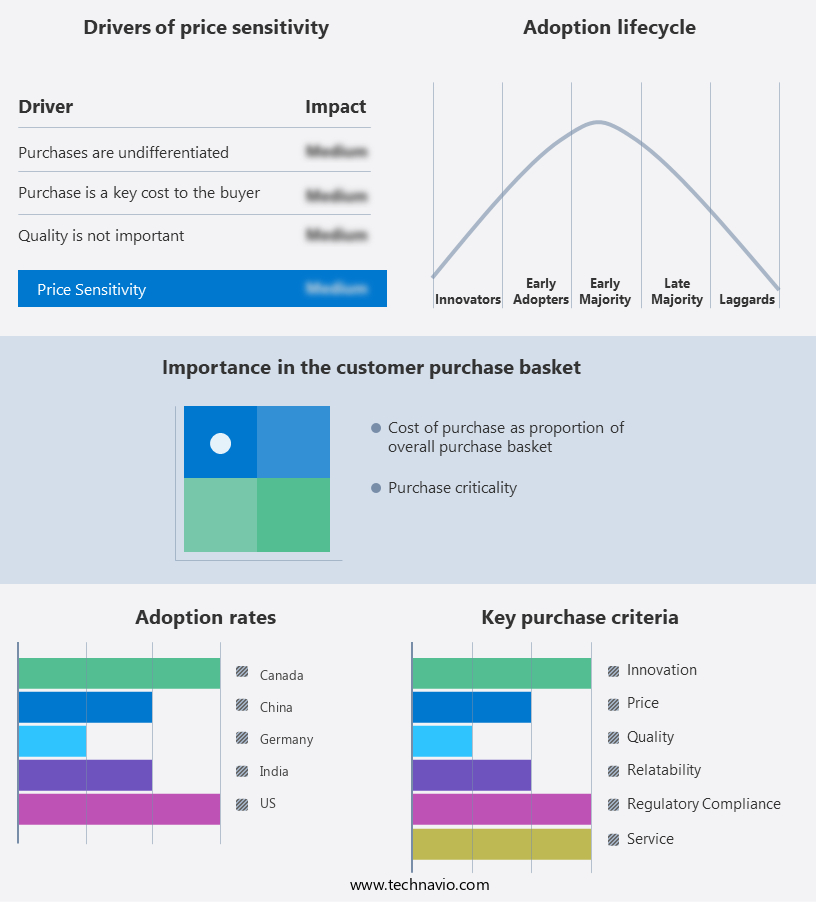
The 3d ultrasound market forecasting report includes the adoption lifecycle of the market, covering from the innovator's stage to the laggard's stage. It focuses on adoption rates in different regions based on penetration. Furthermore, the 3d ultrasound market report also includes key purchase criteria and drivers of price sensitivity to help companies evaluate and develop their market growth analysis strategies.
Customer Landscape of 3D Ultrasound Industry
Competitive Landscape & Market Insights
Companies are implementing various strategies, such as strategic alliances, 3d ultrasound market forecast, partnerships, mergers and acquisitions, geographical expansion, and product/service launches, to enhance their presence in the industry.
BPL MEDICAL TECHNOLOGIES Pvt. Ltd. - This company specializes in providing advanced 3D ultrasound solutions, including the X cube 90, X cube 70, and X cube 60 models, utilizing GPX technology for enhanced imaging accuracy. These non-invasive diagnostic tools enable healthcare professionals to visualize complex structures in real-time, facilitating informed medical decisions.
The industry research and growth report includes detailed analyses of the competitive landscape of the market and information about key companies, including:
- BPL MEDICAL TECHNOLOGIES Pvt. Ltd.
- Canon Inc.
- Chison Medical Technologies Co. Ltd.
- Dawei Medical
- Esaote Spa
- FUJIFILM Holdings Corp.
- GE Healthcare Technologies Inc.
- Genuine Medica Pvt. Ltd.
- Halo Medical Technologies
- Hitachi Ltd.
- Hologic Inc.
- Koninklijke Philips NV
- Lyfboat Technologies Pvt. Ltd
- Shenzhen Mindray BioMedical Electronics Co. Ltd.
- Neusoft Corp.
- Samsung Electronics Co. Ltd.
- Siemens Healthineers AG
- Terason
Qualitative and quantitative analysis of companies has been conducted to help clients understand the wider business environment as well as the strengths and weaknesses of key industry players. Data is qualitatively analyzed to categorize companies as pure play, category-focused, industry-focused, and diversified; it is quantitatively analyzed to categorize companies as dominant, leading, strong, tentative, and weak.
Recent Development and News in 3D Ultrasound Market
- In January 2024, GE Healthcare launched its new Voluson E10 ultrasound system, featuring advanced 3D and 4D imaging capabilities. This innovation allows for more detailed and accurate diagnoses, particularly in obstetrics and gynecology applications (GE Healthcare Press Release).
- In March 2024, Philips and Microsoft announced a strategic partnership to integrate Microsoft's Azure AI capabilities into Philips' health technology solutions, including 3D ultrasound systems. This collaboration aims to enhance diagnostic accuracy and improve patient care through advanced image analysis (Microsoft News Center).
- In April 2024, Siemens Healthineers secured FDA approval for its ACUSON S2000 ultrasound system, which offers advanced 3D imaging and automated quantification of various clinical indicators. This approval expands the company's ultrasound portfolio and strengthens its market position (Siemens Healthineers Press Release).
- In May 2025, Canon Medical Systems and Fujifilm Sonosite announced a merger, creating a leading global provider of diagnostic imaging solutions. The combined entity will offer a comprehensive range of 3D ultrasound systems, expanding their reach and market presence (Canon Medical Systems and Fujifilm Press Release).
Dive into Technavio's robust research methodology, blending expert interviews, extensive data synthesis, and validated models for unparalleled 3D Ultrasound Market insights. See full methodology.
|
Market Scope |
|
|
Report Coverage |
Details |
|
Page number |
216 |
|
Base year |
2024 |
|
Historic period |
2019-2023 |
|
Forecast period |
2025-2029 |
|
Growth momentum & CAGR |
Accelerate at a CAGR of 7.4% |
|
Market growth 2025-2029 |
USD 1864.2 million |
|
Market structure |
Fragmented |
|
YoY growth 2024-2025(%) |
6.8 |
|
Key countries |
US, Germany, China, UK, Japan, Canada, France, Brazil, India, and Italy |
|
Competitive landscape |
Leading Companies, Market Positioning of Companies, Competitive Strategies, and Industry Risks |
Research Analyst Overview
- In the ever-evolving landscape of diagnostic medical imaging, the market showcases continuous advancements and innovation. Fetal biometry measurements have become increasingly precise, enabling more accurate assessments of fetal growth and development. Tissue characterization techniques, such as quantitative ultrasound analysis, provide valuable insights into tissue properties, leading to improved diagnosis and treatment planning. Image reconstruction algorithms play a crucial role in enhancing image quality, allowing for better visualization of complex structures. Shadowing artifact correction and contrast resolution assessment are essential components of these algorithms, ensuring accurate representation of tissue interfaces and improving overall image clarity.
- Post-processing workflows have been streamlined through the integration of advanced technologies like hardware acceleration GPUs and 3d rendering software. Power doppler imaging and color doppler imaging enable blood flow quantification, providing valuable information for the assessment of various conditions. Elastography imaging modalities, like shear wave elastography, offer non-invasive tissue stiffness measurements, contributing to the diagnosis and monitoring of various diseases. Image quality control remains a top priority, with ongoing research focusing on speckle noise reduction and artifact reduction methods. Clinical workflow integration and DICOM image storage have become essential for efficient data management.
- Data acquisition systems and volume rendering techniques facilitate comprehensive analysis, while perfusion imaging methods and angiogenesis assessment offer new insights into disease progression. Advancements in 3d ultrasound technology continue to unfold, with temporal resolution imaging, harmonic imaging techniques, microvascular flow analysis, and patient data management systems driving market growth and innovation. These developments underscore the dynamic nature of the market, making it a fascinating and evolving field to watch.
What are the Key Data Covered in this 3D Ultrasound Market Research and Growth Report?
-
What is the expected growth of the 3D Ultrasound Market between 2025 and 2029?
-
USD 1.86 billion, at a CAGR of 7.4%
-
-
What segmentation does the market report cover?
-
The report segmented by End-user (HSC and DC, Research and academia, and Maternity center and others), Type (Cart and trolley and Handheld), Application (OB and GYN, Cardiology, Radiology and oncology, Urology, and Others), and Geography (North America, Europe, Asia, and Rest of World (ROW))
-
-
Which regions are analyzed in the report?
-
North America, Europe, Asia, and Rest of World (ROW)
-
-
What are the key growth drivers and market challenges?
-
Increase in imaging product launches and collaboration among vendors, Lack of awareness regarding new technologies in imaging technology
-
-
Who are the major players in the 3D Ultrasound Market?
-
Key Companies BPL MEDICAL TECHNOLOGIES Pvt. Ltd., Canon Inc., Chison Medical Technologies Co. Ltd., Dawei Medical, Esaote Spa, FUJIFILM Holdings Corp., GE Healthcare Technologies Inc., Genuine Medica Pvt. Ltd., Halo Medical Technologies, Hitachi Ltd., Hologic Inc., Koninklijke Philips NV, Lyfboat Technologies Pvt. Ltd, Shenzhen Mindray BioMedical Electronics Co. Ltd., Neusoft Corp., Samsung Electronics Co. Ltd., Siemens Healthineers AG, and Terason
-
Market Research Insights
- The market encompasses advanced imaging technologies that offer enhanced visualization and analysis capabilities, integrating features such as image rendering speed, virtual reality integration, and network data transfer.
- The integration of augmented reality overlays, 3D modeling software, and machine learning algorithms in 3D ultrasound systems significantly improves diagnostic accuracy, particularly in obstetric ultrasound applications. Furthermore, advancements in medical image security, user interface design, and data compression techniques contribute to the market's continuous growth.
We can help! Our analysts can customize this 3d ultrasound market research report to meet your requirements.
 RIA -
RIA - 
