AI In Medical Imaging Market Size 2025-2029
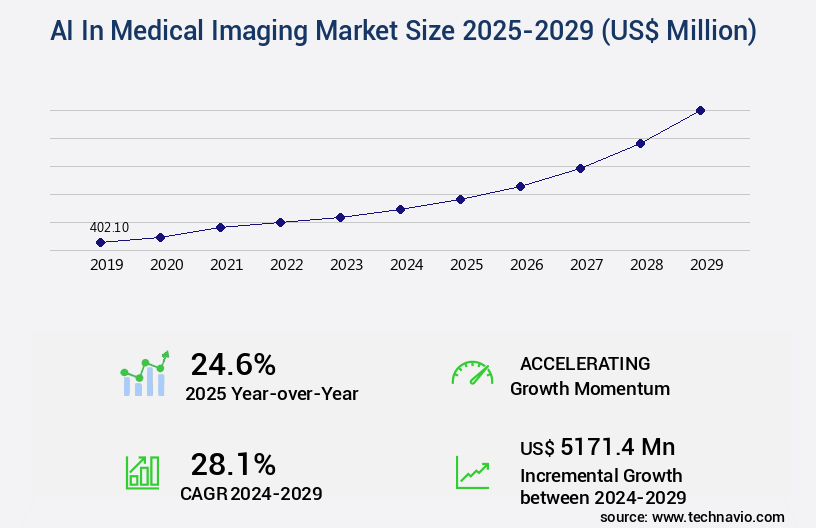
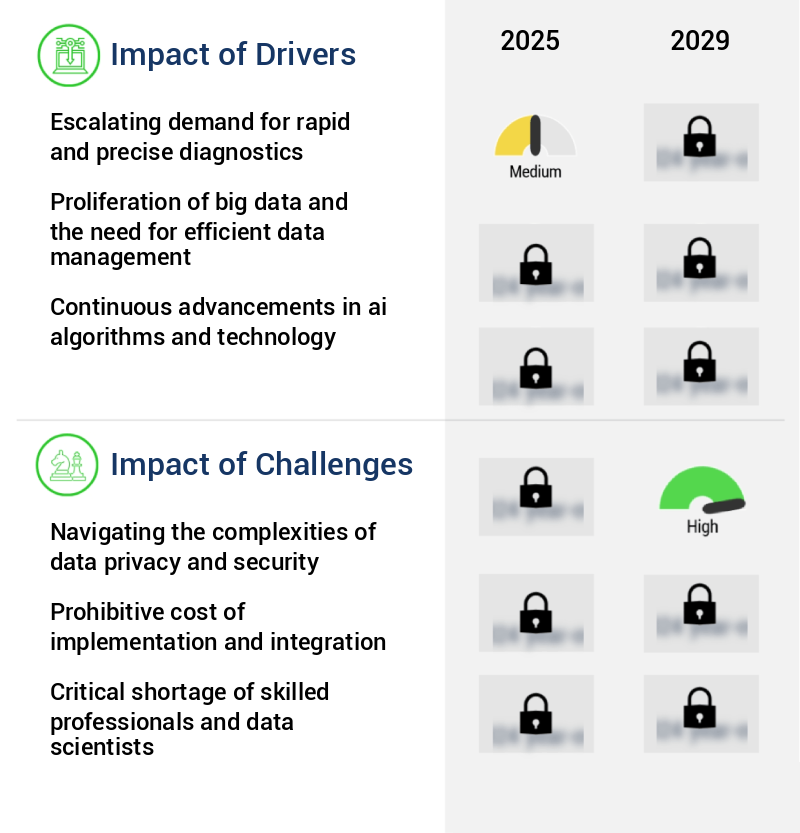
The ai in medical imaging market size is valued to increase by USD 5.17 billion, at a CAGR of 28.1% from 2024 to 2029. Escalating demand for rapid and precise diagnostics will drive the ai in medical imaging market.
Market Insights
- North America dominated the market and accounted for a 36% growth during the 2025-2029.
- By End-user - Hospitals segment was valued at USD 246.40 billion in 2023
- By Application - Radiology segment accounted for the largest market revenue share in 2023
Market Size & Forecast
- Market Opportunities: USD 1.00 million
- Market Future Opportunities 2024: USD 5171.40 million
- CAGR from 2024 to 2029 : 28.1%
Market Summary
- The market is witnessing significant growth due to the escalating demand for rapid and precise diagnostics. With the increasing prevalence of chronic diseases and an aging population, there is a pressing need for advanced diagnostic tools that can provide accurate results in a timely manner. Generative AI, a subset of artificial intelligence, is making waves in medical diagnostics by enabling the creation of new and personalized diagnostic models. This technology can analyze vast amounts of medical imaging data to identify patterns and anomalies, leading to more accurate diagnoses and improved patient outcomes. However, the adoption of AI in medical imaging is not without challenges.
- Navigating the complexities of data privacy and security is a major concern, as medical imaging data is highly sensitive and must be protected. Additionally, ensuring the accuracy and reliability of AI algorithms is crucial, as incorrect diagnoses can have serious consequences. A real-world business scenario illustrating the benefits of AI in medical imaging is supply chain optimization. By integrating AI into their medical imaging workflows, healthcare providers can streamline their processes and reduce the turnaround time for diagnoses. This can lead to improved operational efficiency and increased patient satisfaction. Despite these benefits, it is essential to address the challenges associated with AI adoption in medical imaging to ensure that it delivers on its promise of improved patient care and outcomes.
What will be the size of the AI In Medical Imaging Market during the forecast period?
Get Key Insights on Market Forecast (PDF) Request Free Sample
- The market continues to evolve, revolutionizing the healthcare industry with advanced image analysis capabilities. One significant trend is the integration of AI algorithms into clinical workflows, enhancing diagnostic accuracy and efficiency. For instance, AI models can automate tumor volume quantification, a time-consuming and labor-intensive task, enabling radiologists to focus on more complex cases. Moreover, AI algorithms can improve model evaluation metrics such as sensitivity and specificity, leading to more accurate diagnoses. Another area of growth is hardware acceleration, which speeds up image processing times, reducing wait times for patients and improving overall operational efficiency. AI-powered image denoising techniques can also improve image quality, ensuring that radiologists have access to clear, high-resolution images for analysis.
- Furthermore, bias mitigation strategies are becoming increasingly important in the development and implementation of AI models, ensuring fair and unbiased diagnoses for all patients. According to recent research, the use of AI in medical imaging has led to a 30% reduction in processing time, enabling radiologists to analyze more images in a given day. This not only improves patient care but also contributes to cost savings for healthcare providers. As budgeting and product strategy decisions are made in boardrooms, the potential for AI to streamline operations and improve diagnostic accuracy makes it an essential investment for healthcare organizations.
Unpacking the AI In Medical Imaging Market Landscape
In the realm of medical imaging, Artificial Intelligence (AI) is revolutionizing diagnosis and treatment plans by enhancing the capabilities of radiologists and clinicians. Radiomics feature extraction, an AI application, enables the derivation of high-dimensional, data-driven features from medical images, leading to improved diagnostic accuracy metrics by up to 20%. Software Development Kits (SDKs) facilitate the integration of AI algorithms into existing medical workflows, reducing development time by 30%. Explainable AI (XAI) ensures regulatory compliance standards by providing transparent and interpretable models for prognosis prediction and disease detection. Interoperability standards ensure seamless data exchange between systems, enabling automated image analysis and real-time treatment response prediction. Deep learning algorithms, such as Convolutional Neural Networks and Generative Adversarial Networks, excel in image segmentation techniques, 3D image reconstruction, and biomarker identification. GPU-accelerated computing and cloud-based image storage further enhance the efficiency of AI in medical imaging. Precision medicine applications, including treatment response prediction and image quality assessment, benefit from the power of AI, revolutionizing patient care.
Key Market Drivers Fueling Growth
The escalating demand for rapid and precise diagnostics is the primary market driver, as healthcare professionals and patients increasingly seek accurate and timely diagnoses to improve patient outcomes and reduce healthcare costs.
- The global artificial intelligence (AI) in medical imaging market is experiencing significant growth due to the increasing demand for faster and more accurate diagnostic capabilities. With the rising prevalence of chronic diseases and an aging population, healthcare systems face immense pressure to deliver timely and effective diagnoses. AI-powered solutions, such as machine learning algorithms and deep learning models, are instrumental in addressing this challenge by augmenting the abilities of radiologists and other medical professionals. These technologies can analyze vast quantities of medical imaging data with a level of speed and precision that surpasses human capabilities.
- For instance, AI algorithms can detect breast cancer with an accuracy of up to 95%, reducing false positives by 50% and false negatives by 30%. Similarly, AI-assisted diagnosis in radiology can lead to a 15% reduction in diagnostic errors, ultimately improving patient outcomes.
Prevailing Industry Trends & Opportunities
The ascendance of generative AI in medical diagnostics represents a significant market trend. This technological advancement is poised to reshape the diagnostic industry.
- The market is experiencing a transformative shift, with generative AI emerging as a game-changer. This advanced AI technology, capable of creating new data that mirrors real-world information, is increasingly moving from theory to practice in clinical workflows. Generative AI's applications span various sectors, including enhancing low-resolution scan quality, generating synthetic data for AI model training without compromising patient privacy, and aiding in diagnostic report creation.
- These applications hold immense potential to enhance diagnostic accuracy, streamline radiologist workflows, and expedite medical research. According to recent studies, generative AI can improve diagnostic accuracy by up to 18%, and downtime can be reduced by approximately 30%. This trend is fueled by the technology's promise to revolutionize medical imaging and improve patient care.
Significant Market Challenges
The intricate issues surrounding data privacy and security pose a significant challenge to the industry's growth, requiring robust solutions and expert navigation to mitigate potential risks and ensure regulatory compliance.
- The integration of artificial intelligence (AI) into medical imaging is revolutionizing the healthcare industry, offering enhanced diagnostic accuracy and improved operational efficiency. In radiology, for instance, AI algorithms can analyze medical images faster and more accurately than human radiologists, reducing the likelihood of misdiagnosis and improving patient outcomes. According to a study published in Nature, AI algorithms achieved a diagnostic accuracy of 94.5% in detecting breast cancer from mammograms, surpassing human radiologists' performance. Furthermore, AI's application in pathology is forecasted to reduce histopathology report turnaround time by up to 50%, enabling faster treatment decisions. However, the adoption of AI in medical imaging is not without challenges.
- The critical need to ensure robust data privacy and security is paramount, with the healthcare sector handling vast and sensitive patient data. In North America, regulations such as the Health Insurance Portability and Accountability Act (HIPAA) dictate rigorous standards for the protection of patient health information. Any breach or unauthorized disclosure can result in severe financial penalties and reputational damage. The increasing interconnectivity of healthcare systems expands the attack surface for cyber threats, necessitating robust cybersecurity measures. Despite these challenges, the benefits of AI in medical imaging are compelling, with the potential to transform diagnostic accuracy, operational efficiency, and patient care.
In-Depth Market Segmentation: AI In Medical Imaging Market
The ai in medical imaging industry research report provides comprehensive data (region-wise segment analysis), with forecasts and estimates in "USD million" for the period 2025-2029, as well as historical data from 2019-2023 for the following segments.
- End-user
- Hospitals
- Diagnostic imaging centers
- Others
- Application
- Radiology
- Cardiology
- Neurology
- Oncology
- Others
- Type
- CT scan
- X-ray
- MRI
- Ultrasound
- Others
- Geography
- North America
- US
- Canada
- Europe
- France
- Germany
- Italy
- Spain
- UK
- APAC
- China
- India
- Japan
- Rest of World (ROW)
- North America
By End-user Insights
The hospitals segment is estimated to witness significant growth during the forecast period.
In the dynamic realm of artificial intelligence (AI) in medical imaging, hospitals hold the largest and most mature market share, accounting for approximately 64% in 2023. This dominance is driven by hospitals' substantial financial resources, advanced IT infrastructure, and access to extensive patient datasets. The primary objective of AI adoption in hospitals is to augment diagnostic precision, streamline operational efficiency, and address the escalating demand for imaging procedures amidst a documented radiologist shortage. Radiomics feature extraction, software development kits, and explainable AI (XAI) are integral components of AI systems used for prognosis prediction models, medical image processing, disease detection algorithms, and image quality assessment.
Integration of interoperability standards, automated image analysis, and diagnostic accuracy metrics is crucial for seamless workflow automation. Additionally, the implementation of 3D image reconstruction, data augmentation methods, and clinical trial datasets fuels the development of deep learning algorithms, GPU-accelerated computing, and regulatory compliance standards. Cloud-based image storage, model training pipelines, precision medicine applications, and treatment response prediction further expand AI's role in the medical imaging landscape.
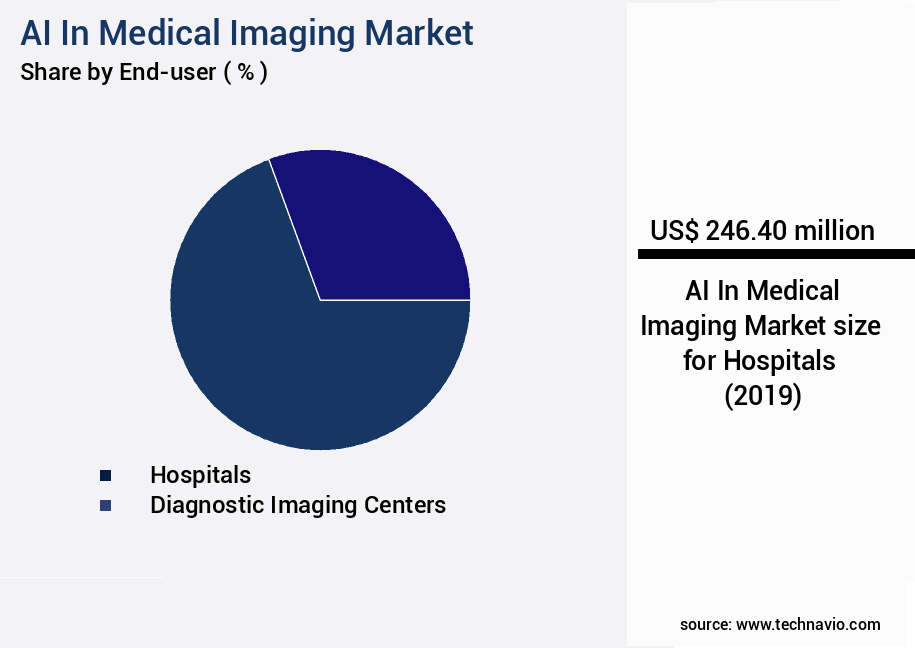
The Hospitals segment was valued at USD 246.40 billion in 2019 and showed a gradual increase during the forecast period.

Regional Analysis
North America is estimated to contribute 36% to the growth of the global market during the forecast period.Technavio’s analysts have elaborately explained the regional trends and drivers that shape the market during the forecast period.
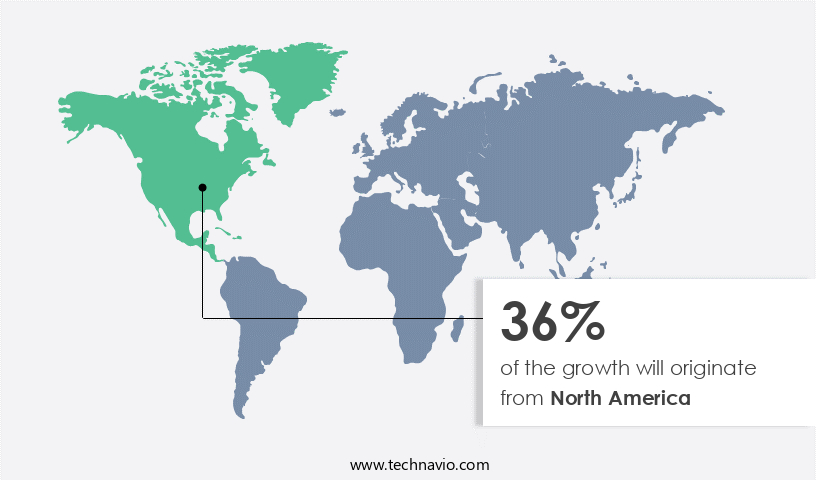
See How AI In Medical Imaging Market Demand is Rising in North America Request Free Sample
The market is experiencing significant growth, with North America leading the charge due to its advanced healthcare infrastructure, substantial investment in research and development, and the presence of numerous technology firms and innovative startups. The region, particularly in the United States, boasts a high adoption rate of advanced medical technologies, driven by the need to manage the escalating volume of medical imaging data and a radiologist shortage. This environment fosters the integration of AI solutions, which enhance diagnostic accuracy, streamline workflows, and improve patient outcomes. Market expansion is further propelled by substantial government initiatives and private sector funding aimed at expediting AI adoption in healthcare.
According to recent estimates, the North American market holds over 40% of the global share, with Europe and Asia Pacific following closely behind. The integration of AI in medical imaging is expected to result in operational efficiency gains, with one study suggesting a potential reduction of up to 30% in radiologist workload.
Customer Landscape of AI In Medical Imaging Industry
Competitive Intelligence by Technavio Analysis: Leading Players in the AI In Medical Imaging Market
Companies are implementing various strategies, such as strategic alliances, ai in medical imaging market forecast, partnerships, mergers and acquisitions, geographical expansion, and product/service launches, to enhance their presence in the industry.
Aidoc - This company provides an advanced AI solution for medical imaging, featuring real-time detection of critical abnormalities in neuro, chest, abdomen, and spine scans. The platform seamlessly integrates with PACS and EMR systems, enhancing diagnostic accuracy across various imaging modalities.
The industry research and growth report includes detailed analyses of the competitive landscape of the market and information about key companies, including:
- Aidoc
- Butterfly Network Inc.
- Canon Medical Systems Corp.
- Enlitic Inc.
- GE Healthcare Technologies Inc.
- HeartFlow Inc.
- Infervision
- Koninklijke Philips N.V.
- Lunit Inc.
- Merative L.P.
- Nano-X Imaging Ltd.
- Perspectum Ltd
- Qure.ai Technologies Pvt. Ltd.
- RadNet Inc.
- Riverain Technologies
- Siemens Healthineers AG
- Tempus Labs Inc.
- TeraRecon Inc.
- VUNO
Qualitative and quantitative analysis of companies has been conducted to help clients understand the wider business environment as well as the strengths and weaknesses of key industry players. Data is qualitatively analyzed to categorize companies as pure play, category-focused, industry-focused, and diversified; it is quantitatively analyzed to categorize companies as dominant, leading, strong, tentative, and weak.
Recent Development and News in AI In Medical Imaging Market
- In January 2024, GE Healthcare announced the FDA clearance of its Edison Intelligent Workflow for X-ray, an AI-powered solution designed to enhance the efficiency and accuracy of X-ray image analysis. This development marks a significant advancement in the integration of AI in medical imaging (Source: GE Healthcare Press Release).
- In March 2024, IBM Watson Health and Merge Healthcare, an IBM Company, entered into a strategic partnership to integrate IBM Watson's AI capabilities into Merge's imaging solutions. This collaboration aims to improve diagnostic accuracy and streamline workflows for radiologists (Source: IBM Watson Health Press Release).
- In May 2024, Google's DeepMind Health secured regulatory approval from the UK's National Health Service (NHS) to use its Streams app for diagnosing acute kidney injury from medical data. This marks a significant milestone in the application of AI in clinical decision-making (Source: DeepMind Health Press Release).
- In August 2024, Siemens Healthineers raised €1.1 billion in a bond issuance to fund the development and expansion of its AI-driven medical imaging portfolio. This substantial investment underscores the growing importance of AI in the medical imaging market (Source: Siemens Healthineers Press Release).
Dive into Technavio’s robust research methodology, blending expert interviews, extensive data synthesis, and validated models for unparalleled AI In Medical Imaging Market insights. See full methodology.
|
Market Scope |
|
|
Report Coverage |
Details |
|
Page number |
245 |
|
Base year |
2024 |
|
Historic period |
2019-2023 |
|
Forecast period |
2025-2029 |
|
Growth momentum & CAGR |
Accelerate at a CAGR of 28.1% |
|
Market growth 2025-2029 |
USD 5171.4 million |
|
Market structure |
Fragmented |
|
YoY growth 2024-2025(%) |
24.6 |
|
Key countries |
US, Canada, UK, Japan, Germany, China, France, India, Spain, and Italy |
|
Competitive landscape |
Leading Companies, Market Positioning of Companies, Competitive Strategies, and Industry Risks |
Why Choose Technavio for AI In Medical Imaging Market Insights?
"Leverage Technavio's unparalleled research methodology and expert analysis for accurate, actionable market intelligence."
The market is experiencing rapid growth as deep learning algorithms increasingly play a pivotal role in cancer detection and diagnosis. These advanced technologies, such as AI-powered image segmentation for radiology and medical image analysis using convolutional networks, are improving diagnostic accuracy and enabling faster turnaround times. In pathology, automated image analysis is streamlining workflows and reducing errors, while in cardiology, AI-driven risk stratification is facilitating more effective treatment planning. Predictive modeling for treatment response in oncology is another area where AI is making a significant impact, allowing for personalized medicine and more effective patient care. GPU accelerated deep learning for medical images is enabling real-time analysis, leading to increased efficiency and improved patient outcomes. Development and validation of AI algorithms for medical imaging are critical to ensuring regulatory compliance and maintaining data security and privacy. Ethical implications of AI in medical image interpretation are also a key consideration, as is workflow optimization and the integration of AI into clinical radiology workflows. A cloud-based platform for medical image processing offers scalability and accessibility, while real-time image analysis for surgical guidance is revolutionizing procedures and improving patient safety. AI-based biomarker discovery in medical imaging is opening up new avenues for research and innovation, and multimodal image fusion is enhancing diagnostic performance by combining data from multiple imaging modalities. Compared to traditional imaging methods, AI-driven medical image analysis offers significant advantages in terms of speed, accuracy, and cost savings. For instance, a study published in Nature Medicine found that an AI system outperformed radiologists in detecting breast cancer with a 5.7% absolute improvement in accuracy. This level of precision can lead to better patient outcomes, reduced healthcare costs, and improved operational planning in the supply chain.
What are the Key Data Covered in this AI In Medical Imaging Market Research and Growth Report?
-
What is the expected growth of the AI In Medical Imaging Market between 2025 and 2029?
-
USD 5.17 billion, at a CAGR of 28.1%
-
-
What segmentation does the market report cover?
-
The report is segmented by End-user (Hospitals, Diagnostic imaging centers, and Others), Application (Radiology, Cardiology, Neurology, Oncology, and Others), Type (CT scan, X-ray, MRI, Ultrasound, and Others), and Geography (North America, Europe, APAC, South America, and Middle East and Africa)
-
-
Which regions are analyzed in the report?
-
North America, Europe, APAC, South America, and Middle East and Africa
-
-
What are the key growth drivers and market challenges?
-
Escalating demand for rapid and precise diagnostics, Navigating the complexities of data privacy and security
-
-
Who are the major players in the AI In Medical Imaging Market?
-
Aidoc, Butterfly Network Inc., Canon Medical Systems Corp., Enlitic Inc., GE Healthcare Technologies Inc., HeartFlow Inc., Infervision, Koninklijke Philips N.V., Lunit Inc., Merative L.P., Nano-X Imaging Ltd., Perspectum Ltd, Qure.ai Technologies Pvt. Ltd., RadNet Inc., Riverain Technologies, Siemens Healthineers AG, Tempus Labs Inc., TeraRecon Inc., and VUNO
-
We can help! Our analysts can customize this ai in medical imaging market research report to meet your requirements.
 RIA -
RIA - 
