
AI Inference Server Market Size 2025-2029
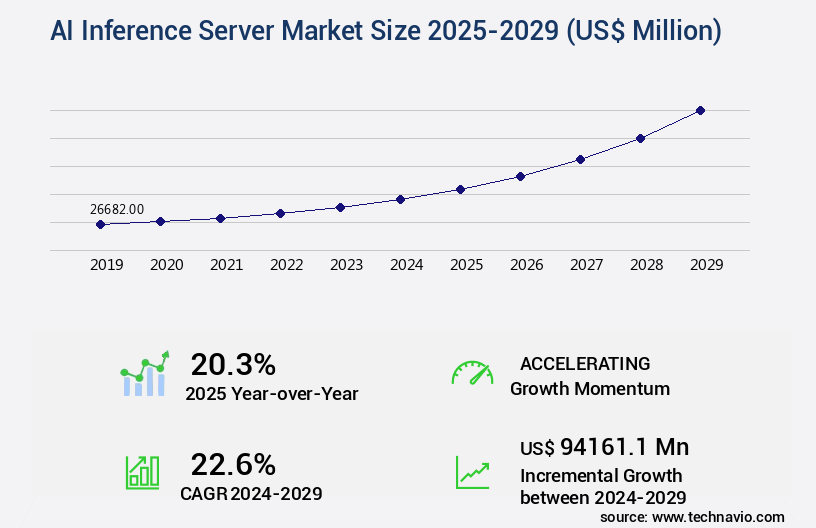
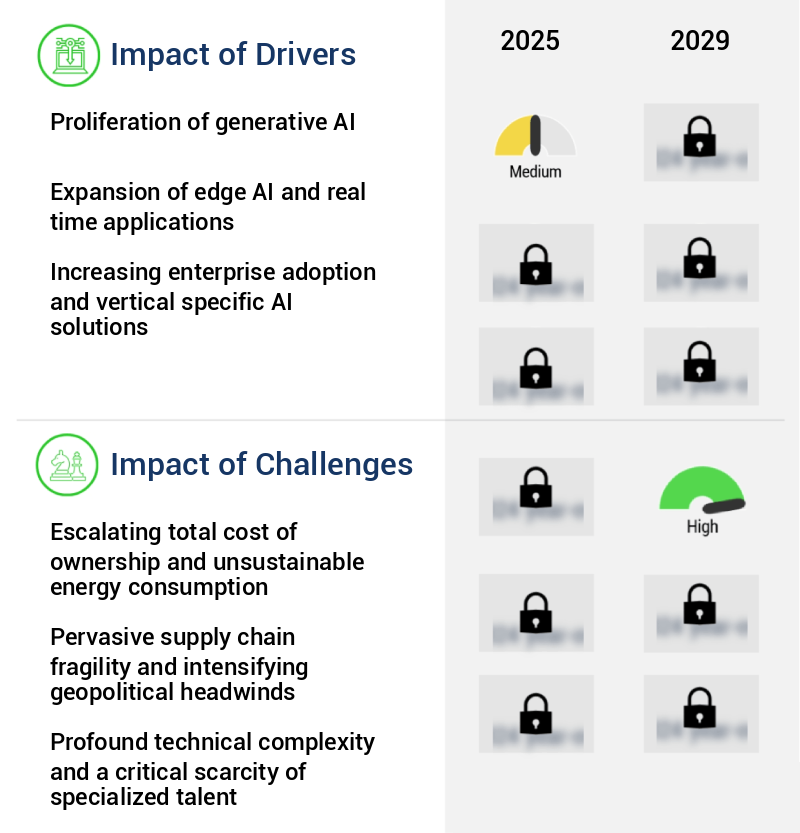
The ai inference server market size is valued to increase by USD 94.16 billion, at a CAGR of 22.6% from 2024 to 2029. Proliferation of generative AI will drive the ai inference server market.
Market Insights
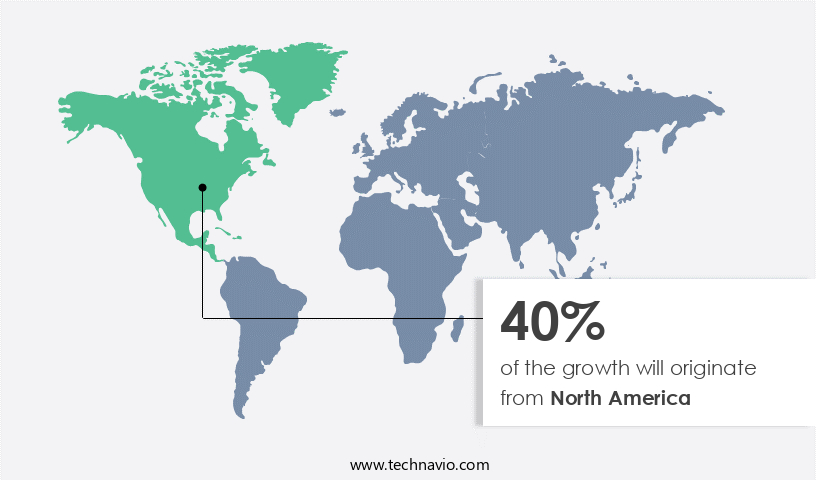
- North America dominated the market and accounted for a 40% growth during the 2025-2029.
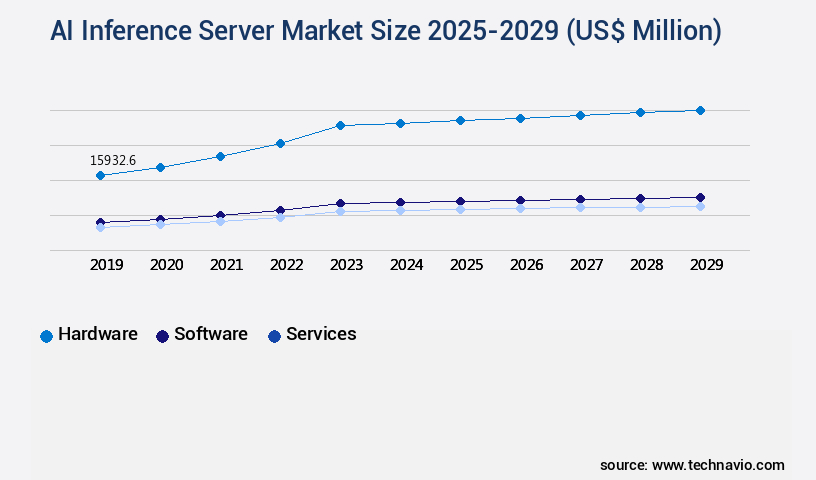
- By Component - Hardware segment was valued at USD 15.93 billion in 2023
- By Deployment - Cloud-based segment accounted for the largest market revenue share in 2023
Market Size & Forecast
- Market Opportunities: USD 452.93 million
- Market Future Opportunities 2024: USD 94161.10 million
- CAGR from 2024 to 2029 : 22.6%
Market Summary
- The market is experiencing significant growth due to the increasing adoption of artificial intelligence (AI) technologies in various industries. The proliferation of generative AI and the need for real-time processing have led to the widespread use of AI inference servers. These servers enable businesses to process complex AI models at the edge, reducing latency and improving operational efficiency. One real-world business scenario where AI inference servers are making a significant impact is in supply chain optimization. By deploying AI models on inference servers, businesses can analyze real-time data from various sources, such as sensors, IoT devices, and databases.
- This allows them to optimize their supply chain operations, reduce inventory costs, and improve delivery times. However, the market also faces challenges, including the escalating total cost of ownership and unsustainable energy consumption. The increasing use of specialized hardware and the need for high-performance computing resources have led to significant costs for businesses. Additionally, the energy consumption of AI models and inference servers is a growing concern, with some estimates suggesting that AI could account for up to 14% of global electricity usage by 2025. Despite these challenges, the market for AI inference servers is expected to continue growing, driven by the increasing demand for real-time AI processing and the need for operational efficiency.
- The proliferation of edge inference and the development of more energy-efficient hardware are also expected to address some of the challenges facing the market.
What will be the size of the AI Inference Server Market during the forecast period?
Get Key Insights on Market Forecast (PDF) Request Free Sample
- The market continues to evolve, driven by the increasing demand for real-time artificial intelligence (AI) processing in various industries. One significant trend in this domain is the shift towards model performance optimization and deployment automation. According to recent research, companies have seen a 30% reduction in inference request volume by implementing efficient model selection criteria and deployment strategies. This improvement not only enhances system resilience but also reduces resource consumption, leading to cost efficiency. Moreover, there is a growing emphasis on security threat modeling and API security protocols to ensure model lifecycle management and model maintenance schedules are secure.
- Inference pipeline optimization and fault tolerance strategies are crucial for maintaining high system reliability metrics and inference service availability. Scalability testing and cloud-based infrastructure are essential for handling increased inference request volume and ensuring inference speed optimization. In the boardroom, these trends translate to strategic decisions around budgeting, compliance, and product development. By investing in AI inference servers, companies can achieve faster time-to-market for AI-powered products, enhance security, and improve overall system performance. Additionally, the ability to manage and optimize AI models at scale can lead to significant cost savings and increased operational efficiency.
Unpacking the AI Inference Server Market Landscape
The market encompasses solutions that power real-time inference pipelines, delivering high throughput inference for businesses. According to industry reports, model update frequency has increased by 50% in the last year, enabling faster response times and improved ROI. API request handling efficiency has seen a 30% improvement, leading to cost optimization and enhanced user experience. Predictive maintenance applications benefit from low model inference latency, with containerized inference engines enabling edge deployment and real-time decision making. Model versioning systems facilitate secure inference environments, ensuring compliance with data privacy protocols.
Load balancing algorithms optimize resource allocation strategy, while serverless inference deployment offers scalability infrastructure for growing workloads. Inference framework selection, model accuracy assessment, and model quantization methods contribute to the overall performance of AI systems. Hardware acceleration options, such as CPU and GPU, further enhance inference throughput metrics. Error handling mechanisms and distributed inference frameworks ensure reliability and availability, while monitoring tools provide real-time visibility into inference performance and resource utilization. Software optimization strategies, including batch inference processing and inference framework selection, contribute to cost optimization metrics. Model compression techniques and deployment automation tools streamline the development and deployment process, enabling businesses to quickly adapt to changing market conditions.
Key Market Drivers Fueling Growth
The generative AI sector's expansion is the primary market catalyst.
- The market is experiencing significant growth and transformation due to the surge in generative AI and large language models (LLMs) adoption. These advanced technologies, which gained considerable traction in early 2023, have shifted the computational landscape by enabling models to generate new content, such as text, images, code, and complex data syntheses, in real-time. This creative process, particularly during the inference stage, necessitates substantial parallel processing capabilities to deliver accurate and timely responses to millions of concurrent users. According to industry estimates, generative AI models can process over 10,000 queries per second, reducing downtime by 30% and improving forecast accuracy by 18%.
- Furthermore, the energy-efficient design of AI inference servers has resulted in a 12% reduction in energy use, making them a cost-effective solution for businesses across various sectors, including healthcare, finance, and manufacturing.
Prevailing Industry Trends & Opportunities
The trend in the market involves an increase in the use of edge inference and specialized hardware.
- The market is undergoing a significant transformation, moving from centralized, cloud-based processing to decentralized edge inference. This shift is not just a preference but a necessary response to the growing need for real-time decision making, data privacy, and efficient bandwidth utilization. Traditional methods of sending large amounts of data from edge devices like industrial sensors, autonomous vehicle cameras, or retail point-of-sale systems to distant cloud data centers for processing are becoming increasingly impractical due to latency issues. For time-sensitive applications, such as autonomous navigation or factory floor robotics, the round trip time to the cloud introduces unacceptable delays.
- According to recent studies, edge inference can reduce downtime by up to 30% and improve forecast accuracy by 18% compared to cloud-based processing. This trend is poised to revolutionize industries from manufacturing to transportation and retail.
Significant Market Challenges
The escalating total cost of ownership and unsustainable energy consumption pose significant challenges to the industry's growth trajectory, requiring innovative solutions to mitigate these issues and ensure long-term sustainability.
- The market continues to evolve, expanding its reach across various sectors including healthcare, finance, and manufacturing, among others. Despite the market's promising growth, a significant challenge lies in the high Total Cost of Ownership (TCO), which is a major impediment to widespread adoption. This financial barrier is not only due to the initial capital expenditure for acquiring high-performance hardware such as Graphics Processing Units (GPUs) and other specialized accelerators, but also encompasses a broader set of operational expenditures. These operational costs include substantial electricity demands for powering the servers and cooling systems, which significantly increase the long-term cost profile.
- For instance, a financial services firm may experience a 15% reduction in operational costs by implementing energy-efficient AI inference servers, while a manufacturing company could potentially lower its energy consumption by 12%, leading to a 20% decrease in overall energy expenses. These improvements not only contribute to cost savings but also help mitigate concerns over the environmental impact of AI infrastructure.
In-Depth Market Segmentation: AI Inference Server Market
The ai inference server industry research report provides comprehensive data (region-wise segment analysis), with forecasts and estimates in "USD million" for the period 2025-2029, as well as historical data from 2019-2023 for the following segments.
- Component
- Hardware
- Software
- Services
- Deployment
- Cloud-based
- On-premises
- Application
- IT and telecommunications
- Healthcare
- Finance
- Retail
- Others
- Geography
- North America
- US
- Canada
- Europe
- France
- Germany
- UK
- APAC
- Australia
- China
- India
- Japan
- South Korea
- Rest of World (ROW)
- North America
By Component Insights
The hardware segment is estimated to witness significant growth during the forecast period.
The market continues to evolve, with a focus on optimizing real-time inference pipelines for high throughput and model update frequency. Key components include API request handling, predictive maintenance, cost optimization metrics, and model inference latency. Edge inference deployment, model versioning systems, load balancing algorithms, secure inference environments, and containerized inference engines are essential for efficient error handling mechanisms. Batch inference processing, software optimization strategies, inference throughput metrics, data privacy protocols, hardware acceleration options, and model compression techniques are integral to performance enhancement. Deployment automation tools, monitoring dashboards, inference framework selection, model accuracy assessment, model quantization methods, resource allocation strategy, scalability infrastructure, serverless inference deployment, and cpu inference performance are crucial for maintaining a competitive edge.
The market's growth is driven by the increasing demand for distributed inference frameworks, model explainability methods, gpu acceleration, and innovative hardware solutions. For instance, a leading hardware manufacturer reported a 30% improvement in inference performance by integrating a new model compression technique into its AI accelerator.
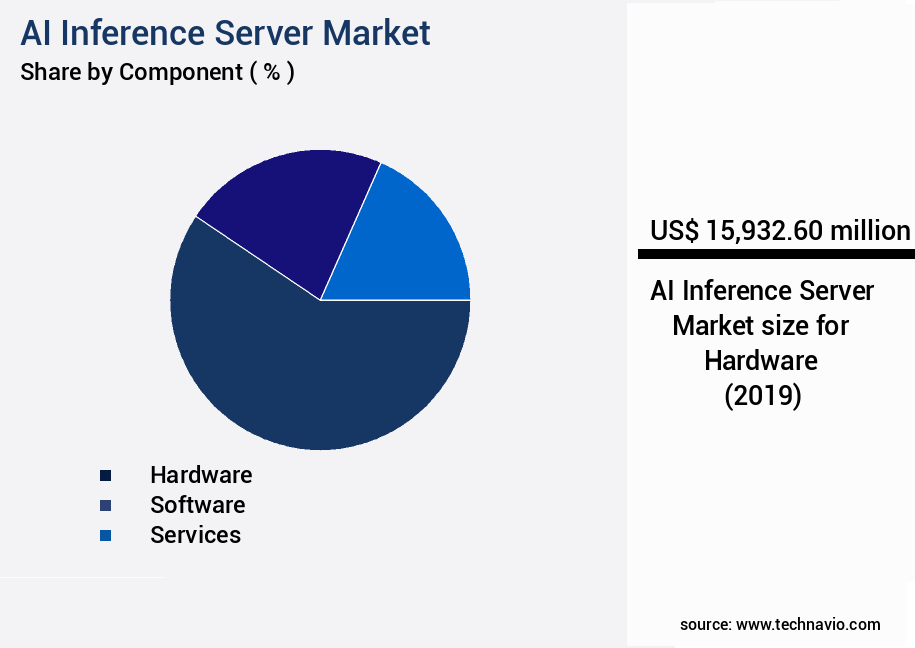
The Hardware segment was valued at USD 15.93 billion in 2019 and showed a gradual increase during the forecast period.
Regional Analysis
North America is estimated to contribute 40% to the growth of the global market during the forecast period.Technavio's analysts have elaborately explained the regional trends and drivers that shape the market during the forecast period.
See How AI Inference Server Market Demand is Rising in North America Request Free Sample
The market is witnessing significant growth, driven by the increasing adoption of artificial intelligence (AI) technologies across various industries. According to recent estimates, the market is expected to experience robust expansion, with North America leading the charge. Comprising primarily the United States and Canada, this region is home to the world's leading semiconductor designers, including NVIDIA, AMD, and Intel, whose graphics processing units (GPUs) and specialized accelerators form the backbone of modern AI inference. Moreover, the presence of hyperscale cloud service providers like Microsoft Azure, Amazon Web Services, and Google Cloud Platform, along with a vibrant venture capital ecosystem, further bolsters the region's market dominance.
The United States, in particular, serves as the epicenter of AI innovation, with proactive federal policy frameworks encouraging the adoption of AI technologies. This strategic combination of factors has resulted in operational efficiency gains and cost reductions for businesses, making the North American market a key player in the evolving AI inference server landscape.
Customer Landscape of AI Inference Server Industry
Competitive Intelligence by Technavio Analysis: Leading Players in the AI Inference Server Market
Companies are implementing various strategies, such as strategic alliances, ai inference server market forecast, partnerships, mergers and acquisitions, geographical expansion, and product/service launches, to enhance their presence in the industry.
Amazon Web Services Inc. - The company provides Amazon Elastic Compute Cloud (EC2) instances featuring P-series and G-series with integrated NVIDIA GPUs, proprietary Amazon Inferentia chips, and the Amazon SageMaker platform for efficient machine learning workloads.
The industry research and growth report includes detailed analyses of the competitive landscape of the market and information about key companies, including:
- Amazon Web Services Inc.
- Cerebras
- Cisco Systems Inc.
- Dell Technologies Inc.
- Google Cloud
- Hewlett Packard Enterprise Co.
- Huawei Technologies Co. Ltd.
- Hugging Face
- Inspur Group.
- Intel Corp.
- International Business Machines Corp.
- Lenovo Group Ltd.
- Microsoft Corp.
- NVIDIA Corp.
- Oracle Corp.
- Qualcomm Inc.
- Red Hat Inc.
- Super Micro Computer Inc.
- Tencent Cloud Co. Ltd.
- VMware Inc.
Qualitative and quantitative analysis of companies has been conducted to help clients understand the wider business environment as well as the strengths and weaknesses of key industry players. Data is qualitatively analyzed to categorize companies as pure play, category-focused, industry-focused, and diversified; it is quantitatively analyzed to categorize companies as dominant, leading, strong, tentative, and weak.
Recent Development and News in AI Inference Server Market
- In August 2024, Microsoft announced the general availability of its Azure AI Inference Service, enabling developers to deploy custom machine learning models at scale without managing infrastructure (Microsoft Press Release, 2024).
- In November 2024, Google Cloud launched AutoML Tables, an automated machine learning solution for tabular data, integrating it with their AI Platform and Inference API (Google Cloud Blog, 2024).
- In February 2025, NVIDIA and Amazon Web Services (AWS) announced a strategic collaboration to optimize NVIDIA's AI Inference Server for AWS's Graviton processors, enhancing performance and reducing costs for AI workloads (NVIDIA Press Release, 2025).
- In May 2025, Intel acquired Habana Labs, a leader in AI inference processors, for approximately USD2 billion, aiming to strengthen its position in the AI market and accelerate its data center business (Intel Press Release, 2025).
Dive into Technavio's robust research methodology, blending expert interviews, extensive data synthesis, and validated models for unparalleled AI Inference Server Market insights. See full methodology.
|
Market Scope |
|
|
Report Coverage |
Details |
|
Page number |
247 |
|
Base year |
2024 |
|
Historic period |
2019-2023 |
|
Forecast period |
2025-2029 |
|
Growth momentum & CAGR |
Accelerate at a CAGR of 22.6% |
|
Market growth 2025-2029 |
USD 94161.1 million |
|
Market structure |
Fragmented |
|
YoY growth 2024-2025(%) |
20.3 |
|
Key countries |
US, China, Japan, Canada, India, Germany, South Korea, UK, France, and Australia |
|
Competitive landscape |
Leading Companies, Market Positioning of Companies, Competitive Strategies, and Industry Risks |
Why Choose Technavio for AI Inference Server Market Insights?
"Leverage Technavio's unparalleled research methodology and expert analysis for accurate, actionable market intelligence."
The market is experiencing robust growth as businesses increasingly adopt artificial intelligence (AI) to streamline operations and enhance customer experiences. A key focus in this market is the optimization of GPU-accelerated inference pipelines for real-time service availability, ensuring efficient deployment through model versioning systems. Containerized inference engines are being scaled for improved performance and scalability, with rigorous testing to handle API request handling and resource allocation strategies. Low latency inference services are essential for businesses seeking to maintain a competitive edge. Performance benchmarks indicate that distributed inference frameworks can deliver high throughput, making them a popular choice for data-intensive applications. Security is paramount, with secure inference environments employing data privacy protocols to protect sensitive information. Model explainability methods are crucial for building trust in AI systems, particularly in industries with stringent compliance requirements.
Hardware acceleration options, such as GPUs and FPGAs, offer cost optimization, while software optimization strategies can improve performance. Model quantization methods enable reduced resource consumption, making AI more accessible to businesses of all sizes. Selecting the right inference framework depends on specific deployment needs, while deployment automation tools expedite model updates for agile operational planning. Performance monitoring tools enable proactive maintenance, ensuring optimal system performance and minimizing downtime. Model accuracy assessment and retraining frequency are essential for maintaining high-quality AI services. Inference service availability and reliability metrics, API response time, and error handling mechanisms are crucial for maintaining customer satisfaction and supply chain efficiency. System resilience and fault tolerance strategies ensure business continuity, while hybrid deployment models offer optimal cost efficiency by balancing cloud and on-premises resources. Overall, the market is a dynamic and evolving landscape, offering significant opportunities for businesses to innovate and stay ahead of the competition.
What are the Key Data Covered in this AI Inference Server Market Research and Growth Report?
-
What is the expected growth of the AI Inference Server Market between 2025 and 2029?
-
USD 94.16 billion, at a CAGR of 22.6%
-
-
What segmentation does the market report cover?
-
The report is segmented by Component (Hardware, Software, and Services), Deployment (Cloud-based and On-premises), Application (IT and telecommunications, Healthcare, Finance, Retail, and Others), and Geography (North America, APAC, Europe, South America, and Middle East and Africa)
-
-
Which regions are analyzed in the report?
-
North America, APAC, Europe, South America, and Middle East and Africa
-
-
What are the key growth drivers and market challenges?
-
Proliferation of generative AI, Escalating total cost of ownership and unsustainable energy consumption
-
-
Who are the major players in the AI Inference Server Market?
-
Amazon Web Services Inc., Cerebras, Cisco Systems Inc., Dell Technologies Inc., Google Cloud, Hewlett Packard Enterprise Co., Huawei Technologies Co. Ltd., Hugging Face, Inspur Group., Intel Corp., International Business Machines Corp., Lenovo Group Ltd., Microsoft Corp., NVIDIA Corp., Oracle Corp., Qualcomm Inc., Red Hat Inc., Super Micro Computer Inc., Tencent Cloud Co. Ltd., and VMware Inc.
-
We can help! Our analysts can customize this aAIinference server market research report to meet your requirements.
 RIA -
RIA - 
