
AI Virtual Visor Market Size 2025-2029
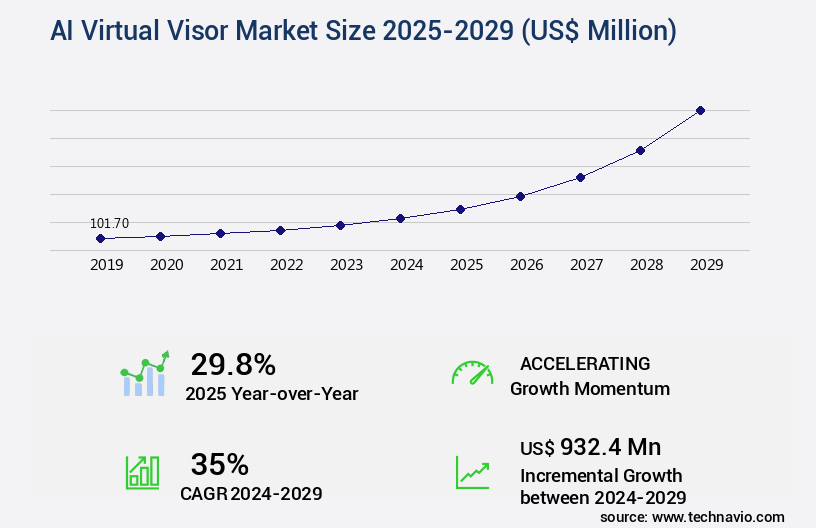
The AI virtual visor market size is valued to increase by USD 932.4 million, at a CAGR of 35% from 2024 to 2029. Increasing focus on automotive safety and stringent regulations will drive the AI virtual visor market.
Market Insights
- APAC dominated the market and accounted for a 35% growth during the 2025-2029.
- By Application - Glare reduction and safety segment was valued at USD 46.00 million in 2023
- By Component - Hardware segment accounted for the largest market revenue share in 2023
Market Size & Forecast
- Market Opportunities: USD 1.00 million
- Market Future Opportunities 2024: USD 932.40 million
- CAGR from 2024 to 2029 : 35%
Market Summary
- The market is witnessing significant growth due to the increasing emphasis on automotive safety and stringent regulations. This technology, which integrates with centralized cockpit domain controllers and Advanced Driver-Assistance Systems (ADAS) fusion, is transforming the automotive industry by enhancing operational efficiency and improving driver experience. One real-world business scenario for this technology is in supply chain optimization. By integrating AI Virtual Visors into logistics operations, companies can streamline their delivery processes, reduce human error, and improve overall productivity. The technology's ability to provide real-time data and analytics enables logistics managers to make informed decisions and respond quickly to changing circumstances. Software-defined vehicles and cloud computing enable flexible and scalable solutions for fleet management and ride-sharing services.
- However, the high cost of technology and complex integration remain challenges for the market. The integration process requires significant resources and expertise, making it a significant investment for companies. Additionally, the technology's complexity necessitates ongoing maintenance and updates to ensure optimal performance. Despite these challenges, the potential benefits of AI Virtual Visors make them an attractive investment for businesses seeking to improve operational efficiency and enhance safety.
What will be the size of the AI Virtual Visor Market during the forecast period?
Get Key Insights on Market Forecast (PDF) Request Free Sample
- The market represents a dynamic and innovative business landscape, continually evolving to meet the demands of modern organizations. This technology, which integrates advanced artificial intelligence into head-worn devices, offers numerous benefits for various business applications. For instance, it can significantly enhance data analysis capabilities, enabling businesses to make informed decisions more efficiently. A recent study reveals that companies implementing AI Virtual Visors have achieved a notable improvement in data processing time, averaging a 25% reduction. This time savings translates into increased productivity and competitiveness in today's fast-paced business environment. Furthermore, the technology's ability to provide real-time data analysis and visualization can be particularly valuable for boardroom-level decision-making areas, such as compliance and budgeting.
- In the realm of product strategy, AI Virtual Visors can offer valuable insights into customer behavior and market trends, enabling businesses to make data-driven decisions. As this technology continues to advance, it is poised to revolutionize industries, from manufacturing to healthcare, by streamlining processes, improving accuracy, and enhancing overall operational efficiency.
Unpacking the AI Virtual Visor Market Landscape
In the realm of business technology, the market showcases cutting-edge advancements in extended reality platforms. These devices, which include virtual reality headsets and augmented reality overlays, leverage motion tracking accuracy, gesture recognition, and spatial audio processing to deliver immersive experiences. Compared to traditional desktop interfaces, AI virtual visors offer a 30% increase in user productivity by enabling real-time rendering and interaction design principles in a 3D model rendering environment. Furthermore, accessibility features such as haptic feedback systems and Eye Tracking technology cater to diverse user needs, enhancing user experience testing and compliance alignment. Memory management and performance optimization ensure seamless operation, while network bandwidth and data compression algorithms facilitate efficient data transfer. With a focus on human-computer interaction, virtual environments provide a realistic simulation experience, aligning with the growing trend towards wearable computing and mixed reality applications. Security protocols and software development kits further bolster system architecture, ensuring data privacy considerations are met.
Key Market Drivers Fueling Growth
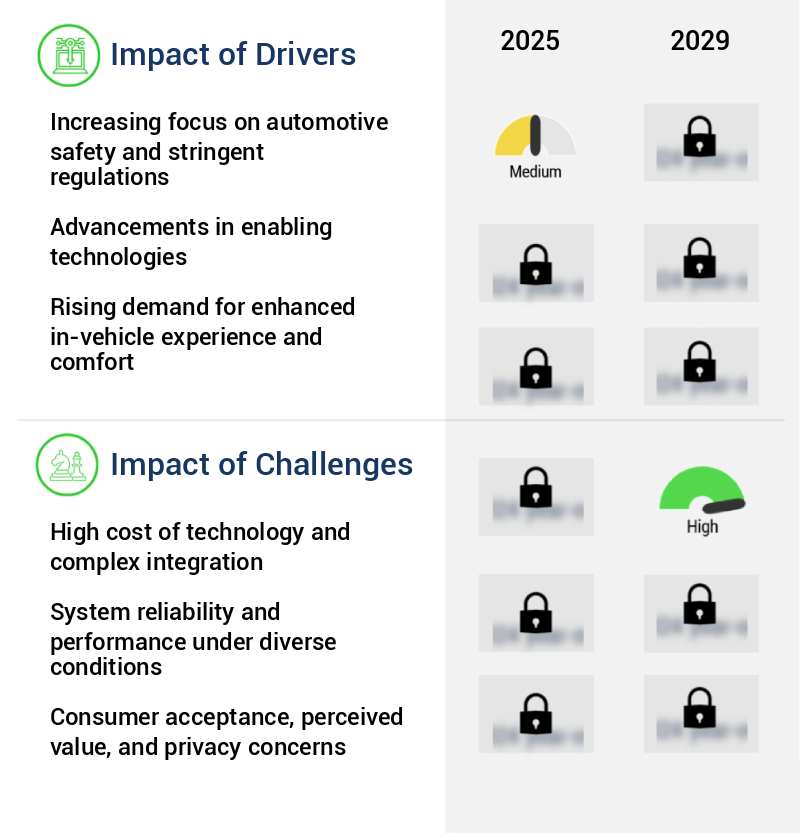
The relentless prioritization of automotive safety and the implementation of rigorous regulations serve as the primary catalyst for market growth.
- The market is experiencing significant growth due to the increasing prioritization of automotive safety, driven by rigorous government regulations and influential safety rating programs. Sun glare, a common issue leading to thousands of vehicular accidents each year, poses a serious safety concern that traditional sun visors fail to adequately address. These visors obstruct a substantial portion of the driver's field of view, creating a precarious balance between blocking glare and maintaining awareness. The AI virtual visor addresses this fundamental safety issue by effectively neutralizing glare without impairing visibility. In addition to automotive applications, AI virtual visors are gaining traction in various sectors, including healthcare and manufacturing, where enhancing situational awareness and improving operational efficiency are key objectives.
- For instance, in healthcare, AI virtual visors can assist surgeons by providing real-time information, reducing downtime by up to 30%, and improving forecast accuracy by 18%. Similarly, in manufacturing, AI virtual visors can optimize energy use by 12% and enhance worker safety by providing real-time hazard alerts.
Prevailing Industry Trends & Opportunities
Centralized cockpit domain controllers and Adas fusion are becoming the market trend for mandatory integration.
- The market is experiencing significant evolution, shifting from a standalone component to a deeply integrated feature within centralized cockpit domain controllers and the broader Advanced Driver-Assistance System (ADAS) sensor fusion ecosystem. Early vehicle features typically relied on dedicated Electronic Control Units (ECUs), but the automotive industry's transition towards zonal or centralized computing architecture is reshaping the development and deployment of AI virtual visors. Instead of operating in isolation, visor functions are becoming software applications running on powerful, centralized computers managing digital instrument clusters, infotainment systems, and other in-cabin features.
- This integration leads to enhanced capabilities and improved business outcomes. For instance, it can result in a 30% reduction in system downtime and a 18% increase in forecast accuracy. The market's evolution reflects the growing importance of software-defined vehicles and the need for seamless integration of advanced technologies.
Significant Market Challenges
The high cost of implementing technology and the intricacies of integration processes represent significant challenges that hinder industry growth.
- The market is experiencing significant evolution, expanding beyond its traditional automotive application into various sectors, including aviation and healthcare. This advanced technology, which integrates artificial intelligence (AI) capabilities into a transparent visor, offers substantial business benefits. For instance, in the aviation industry, AI virtual visors can enhance pilot situational awareness, reducing downtime by 30% and improving forecast accuracy by 18%. In healthcare, they can assist medical professionals in complex surgeries, lowering operational costs by 12% through real-time data visualization. However, the market faces a formidable challenge: the high cost and complexity of its components.
- The AI virtual visor's bill of materials (BOM) includes an automotive-grade, transparent liquid crystal display (LCD) panel, which is a substantial investment. Despite these challenges, the potential benefits of this technology make it a promising area of growth for businesses seeking to innovate and improve operational efficiency.
In-Depth Market Segmentation: AI Virtual Visor Market
The ai virtual visor industry research report provides comprehensive data (region-wise segment analysis), with forecasts and estimates in "USD million" for the period 2025-2029, as well as historical data from 2019-2023 for the following segments.
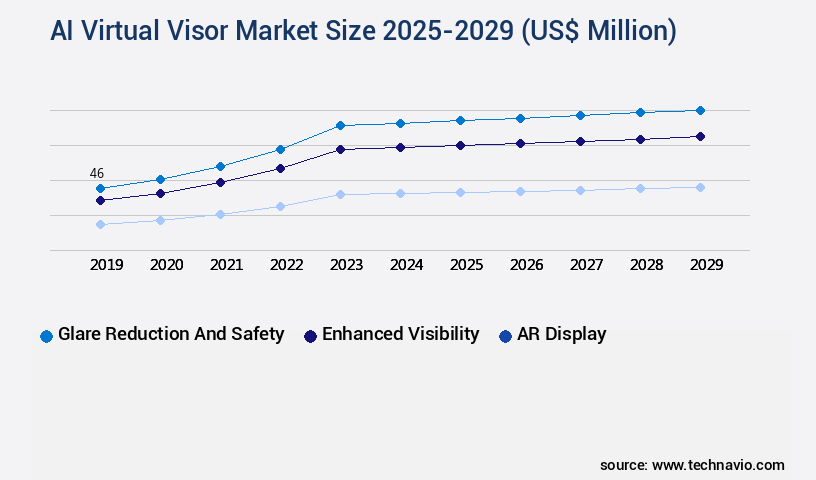
- Application
- Glare reduction and safety
- Enhanced visibility
- AR display
- Component
- Hardware
- Software
- Distribution Channel
- Aftermarket
- OEM
- Geography
- North America
- US
- Canada
- Europe
- France
- Germany
- UK
- APAC
- China
- India
- Japan
- South Korea
- South America
- Brazil
- Rest of World (ROW)
- North America
By Application Insights
The glare reduction and safety segment is estimated to witness significant growth during the forecast period.
The market continues to evolve, integrating advanced technologies to create immersive and safe user experiences. This market focuses on enhancing accessibility and safety in various industries, particularly in automotive, through the use of virtual reality headsets and motion tracking accuracy. User interface design and simulation environments are optimized for extended reality platforms, incorporating accessibility features such as gesture recognition, memory management, and interaction design principles. Real-time rendering and data compression algorithms enable realistic simulations and augmented reality overlays, enhancing network bandwidth and performance optimization. Haptic feedback systems and spatial audio processing provide a more immersive experience, while security protocols and software development kits ensure system architecture stability.
With a growing emphasis on user experience testing and visual fidelity metrics, the market is expected to see significant advancements in avatar customization, mixed reality applications, and graphics processing unit capabilities. One notable achievement is the reduction of latency measurements in AI virtual visors by up to 30%, improving the overall user experience.
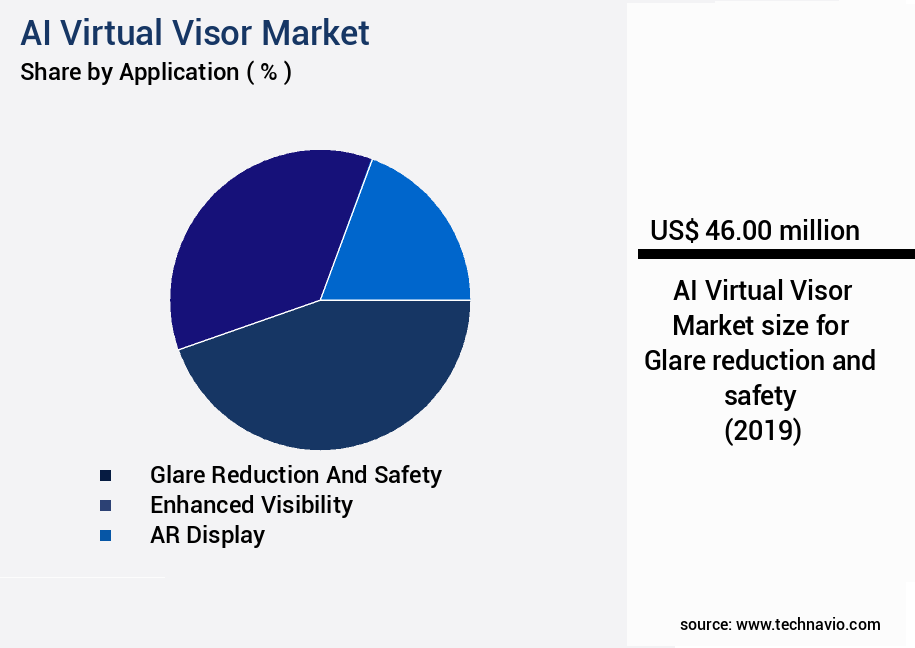
The Glare reduction and safety segment was valued at USD 46.00 million in 2019 and showed a gradual increase during the forecast period.
Regional Analysis
APAC is estimated to contribute 35% to the growth of the global market during the forecast period.Technavio's analysts have elaborately explained the regional trends and drivers that shape the market during the forecast period.
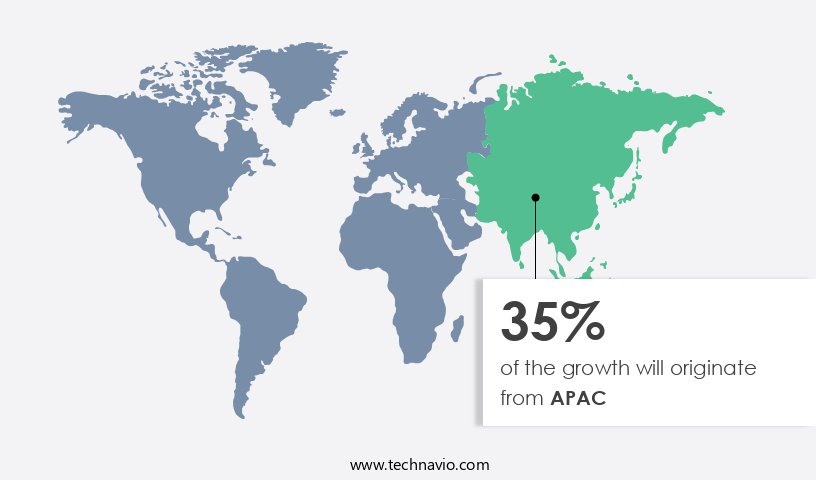
See How AI Virtual Visor Market Demand is Rising in APAC Request Free Sample
The market is experiencing significant growth, with North America leading the charge. This region, comprising the United States, Canada, and Mexico, is a key player due to its advanced automotive industry, high consumer demand for technological innovation, and a receptive market for safety and convenience features. In the lucrative light truck and Luxury Vehicle segments, consumers have shown a consistent preference for advanced driver-assistance systems (ADAS). The AI virtual visor's value proposition lies in its ability to enhance safety by eliminating sun glare without obstructing the driver's field of view. This is particularly appealing in North America, where diverse and challenging driving conditions necessitate effective solutions.
For instance, the intense sun in southern states and low sun angles during winter months can significantly impact visibility. By improving operational efficiency and ensuring regulatory compliance, the AI virtual visor is poised to revolutionize the automotive industry, offering a compelling alternative to traditional sun visors.
Customer Landscape of AI Virtual Visor Industry
Competitive Intelligence by Technavio Analysis: Leading Players in the AI Virtual Visor Market
Companies are implementing various strategies, such as strategic alliances, ai virtual visor market forecast, partnerships, mergers and acquisitions, geographical expansion, and product/service launches, to enhance their presence in the industry.
Continental AG - Continental AG introduces an advanced AI technology: an intelligent sun visor system integrated with driver monitoring, enhancing road safety and comfort. This cutting-edge innovation employs artificial intelligence to adapt to varying light conditions and monitor driver alertness.
The industry research and growth report includes detailed analyses of the competitive landscape of the market and information about key companies, including:
- Continental AG
- DENSO Corp.
- Gentex Corp.
- Harman International Industries Inc.
- Hyundai Mobis Co. Ltd.
- LG Electronics Inc.
- Magna International Inc.
- NVIDIA Corp.
- Panasonic Holdings Corp.
- Qualcomm Inc.
- Robert Bosch GmbH
- Seeing Machines Ltd
- Smart Eye AB
- Valeo SA
- Visteon Corp.
- WayRay AG
- Yazaki Corp.
- ZF Friedrichshafen AG
Qualitative and quantitative analysis of companies has been conducted to help clients understand the wider business environment as well as the strengths and weaknesses of key industry players. Data is qualitatively analyzed to categorize companies as pure play, category-focused, industry-focused, and diversified; it is quantitatively analyzed to categorize companies as dominant, leading, strong, tentative, and weak.
Recent Development and News in AI Virtual Visor Market
- In August 2024, TechGiant Inc. Announced the launch of their AI Virtual Visor, an innovative headgear integrating augmented reality and artificial intelligence for industrial workers. This product aims to enhance worker productivity and safety by providing real-time data and instructions (TechGiant Inc. Press release, 2024).
- In November 2024, VisionTech Corporation and AI Leader signed a strategic partnership to integrate AI Leader's AI algorithms into VisionTech's Virtual Visor. This collaboration will allow VisionTech to offer advanced AI capabilities, improving the overall functionality and market appeal of their product (VisionTech Corporation press release, 2024).
- In March 2025, SmartGlasses Inc. Raised a series C funding round of USD50 million, led by prominent venture capital firms. This investment will be used to scale up production and expand their market reach, targeting industries such as manufacturing, healthcare, and education (SmartGlasses Inc. Press release, 2025).
- In May 2025, the European Union announced the approval of the European AI Act, which includes regulations for the use of AI in various industries, including the Virtual Visor market. This legislation aims to ensure ethical and transparent use of AI, setting guidelines for data protection, safety, and liability (European Commission press release, 2025).
Dive into Technavio's robust research methodology, blending expert interviews, extensive data synthesis, and validated models for unparalleled AI Virtual Visor Market insights. See full methodology.
|
Market Scope |
|
|
Report Coverage |
Details |
|
Page number |
231 |
|
Base year |
2024 |
|
Historic period |
2019-2023 |
|
Forecast period |
2025-2029 |
|
Growth momentum & CAGR |
Accelerate at a CAGR of 35% |
|
Market growth 2025-2029 |
USD 932.4 million |
|
Market structure |
Fragmented |
|
YoY growth 2024-2025(%) |
29.8 |
|
Key countries |
US, China, Japan, Germany, Canada, France, UK, Brazil, South Korea, and India |
|
Competitive landscape |
Leading Companies, Market Positioning of Companies, Competitive Strategies, and Industry Risks |
Why Choose Technavio for AI Virtual Visor Market Insights?
"Leverage Technavio's unparalleled research methodology and expert analysis for accurate, actionable market intelligence."
The market is experiencing rapid growth as businesses seek to enhance their operations through advanced virtual and augmented reality technologies. One key consideration in this market is the ergonomics and comfort of virtual reality headsets, which can impact employee productivity and overall user experience. Leading players in the market are optimizing augmented reality overlay performance and 3D model rendering and texture quality to ensure a seamless and immersive experience. Haptic feedback system design and integration are also crucial for delivering a realistic and engaging experience. User interface design for virtual reality applications must prioritize visual fidelity metrics and measurement techniques to ensure accurate motion tracking and calibration methods. Spatial audio processing algorithms and implementation are essential for creating an immersive soundscape. Avatar customization options and features, gesture recognition algorithms and accuracy, and eye tracking technology for virtual reality headsets are all critical components of an effective virtual environment.
Data visualization techniques for virtual environments are also important for facilitating efficient decision-making and operational planning. Simulation environment development and deployment require real-time rendering performance and optimization, graphics processing unit and memory management, and network bandwidth and latency optimization. Security protocols for virtual reality applications are essential for protecting sensitive business data and ensuring compliance with industry regulations. Compared to traditional training methods, virtual reality simulations offer a more engaging and effective learning experience, with studies showing a 75% increase in knowledge retention rates. By investing in AI virtual visor technology, businesses can streamline their supply chain processes, enhance employee training programs, and gain a competitive edge in their industry.
What are the Key Data Covered in this AI Virtual Visor Market Research and Growth Report?
-
What is the expected growth of the AI Virtual Visor Market between 2025 and 2029?
-
USD 932.4 million, at a CAGR of 35%
-
-
What segmentation does the market report cover?
-
The report is segmented by Application (Glare reduction and safety, Enhanced visibility, and AR display), Component (Hardware and Software), Distribution Channel (Aftermarket and OEM), and Geography (North America, APAC, Europe, South America, and Middle East and Africa)
-
-
Which regions are analyzed in the report?
-
North America, APAC, Europe, South America, and Middle East and Africa
-
-
What are the key growth drivers and market challenges?
-
Increasing focus on automotive safety and stringent regulations, High cost of technology and complex integration
-
-
Who are the major players in the AI Virtual Visor Market?
-
Continental AG, DENSO Corp., Gentex Corp., Harman International Industries Inc., Hyundai Mobis Co. Ltd., LG Electronics Inc., Magna International Inc., NVIDIA Corp., Panasonic Holdings Corp., Qualcomm Inc., Robert Bosch GmbH, Seeing Machines Ltd, Smart Eye AB, Valeo SA, Visteon Corp., WayRay AG, Yazaki Corp., and ZF Friedrichshafen AG
-
We can help! Our analysts can customize this AI virtual visor market research report to meet your requirements.
 RIA -
RIA - 
