Air Cleaner Filters Market Analysis, Size, and Forecast 2026-2030: APAC (China, Japan, and India), Europe (Germany, UK, and France), North America (US, Canada, and Mexico), Middle East and Africa (Saudi Arabia, UAE, and South Africa), South America (Brazil and Argentina), and Rest of World (ROW)

Air Cleaner Filters Market Analysis, Size, and Forecast 2026-2030:
APAC (China, Japan, and India), Europe (Germany, UK, and France), North America (US, Canada, and Mexico), Middle East and Africa (Saudi Arabia, UAE, and South Africa), South America (Brazil and Argentina), and Rest of World (ROW)

Published: Apr 2026 308 Pages SKU: IRTNTR45775

Market Overview at a Glance

$18.86 B
Market Opportunity
9.3%
CAGR 2025 - 2030
58.9%
APAC Growth
$19.32 B
HVAC segment 2024

Air Cleaner Filters Market Size 2026-2030

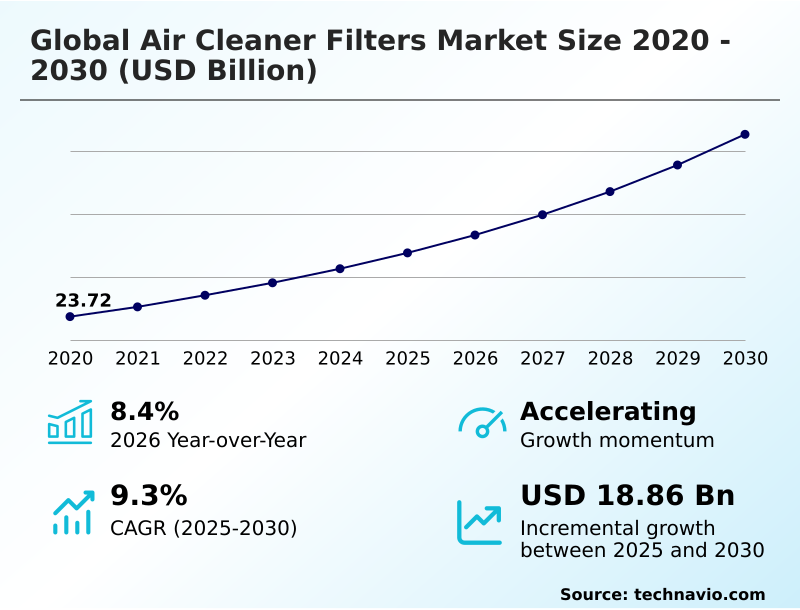
The air cleaner filters market size is valued to increase by USD 18.86 billion, at a CAGR of 9.3% from 2025 to 2030. Implementation of stringent environmental regulations and indoor air quality standards will drive the air cleaner filters market.

Major Market Trends & Insights

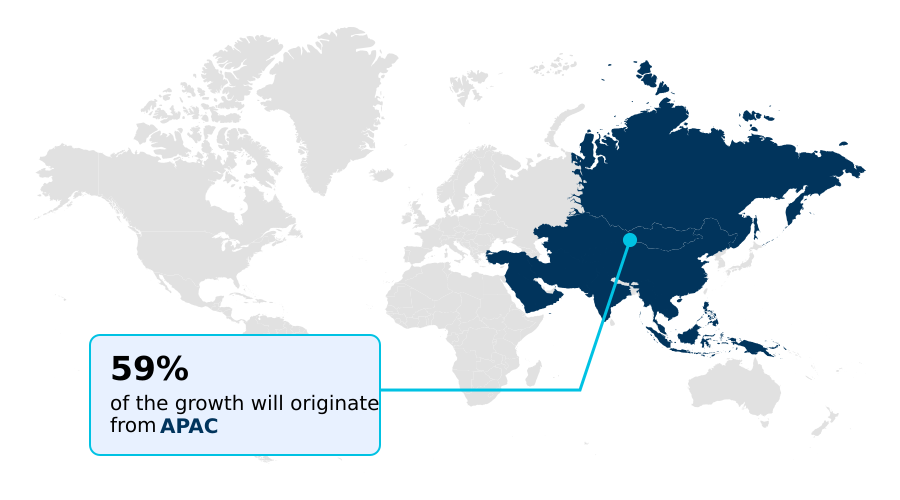
  • APAC dominated the market and accounted for a 58.9% growth during the forecast period.
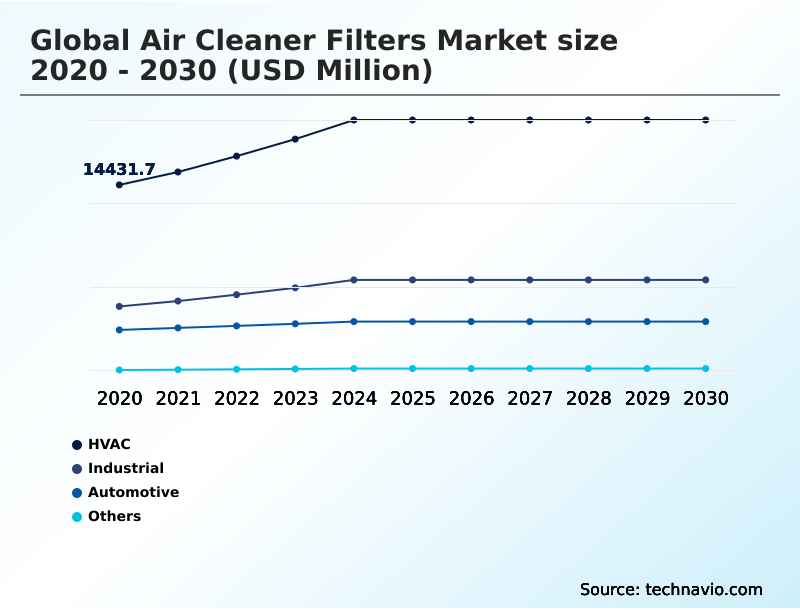
  • By End-user - HVAC segment was valued at USD 19.32 billion in 2024
  • By Distribution Channel - Offline segment accounted for the largest market revenue share in 2024

Market Size & Forecast

  • Market Opportunities: USD 29.00 billion
  • Market Future Opportunities: USD 18.86 billion
  • CAGR from 2025 to 2030 : 9.3%

Market Summary

  • The air cleaner filters market is shaped by a convergence of regulatory pressures, health-driven consumer demand, and technological evolution. Stringent indoor air quality standards and mandates from governmental bodies create a resilient demand cycle, compelling commercial and industrial facilities to adopt high-performance filter arrays, including specialized media such as activated carbon and HEPA filters.
  • This is particularly critical in scenarios like pharmaceutical manufacturing, where maintaining a contaminant-free environment with certified filter media is non-negotiable for product integrity and compliance. Concurrently, the proliferation of smart filtration systems integrated with IoT and AI introduces predictive maintenance capabilities, optimizing energy use and filter lifespan.
  • These data-driven platforms can forecast filter saturation and automate procurement, a significant advancement over traditional time-based replacement schedules. However, the market grapples with the proliferation of counterfeit filters, which compromise both air quality and equipment longevity, creating a trust deficit that legitimate manufacturers must address through consumer education and robust supply chain verification.

What will be the Size of the Air Cleaner Filters Market during the forecast period?

Get Key Insights on Market Forecast (PDF) Request Free Sample

How is the Air Cleaner Filters Market Segmented?

The air cleaner filters industry research report provides comprehensive data (region-wise segment analysis), with forecasts and estimates in "USD million" for the period 2026-2030, as well as historical data from 2020-2024 for the following segments.

  • End-user
    • HVAC
    • Industrial
    • Automotive
    • Others
  • Distribution channel
    • Offline
    • Online
  • Type
    • HEPA filters
    • Baghouse filters
    • Cartridge filters
    • Dust collectors
    • Others
  • Geography
    • APAC
      • China
      • Japan
      • India
    • Europe
      • Germany
      • UK
      • France
    • North America
      • US
      • Canada
      • Mexico
    • Middle East and Africa
      • Saudi Arabia
      • UAE
      • South Africa
    • South America
      • Brazil
      • Argentina
    • Rest of World (ROW)

By End-user Insights

The hvac segment is estimated to witness significant growth during the forecast period.

The HVAC segment is foundational, driven by the dual need to protect mechanical components and improve indoor air quality.

Heightened health awareness is compelling a shift toward high-efficiency particulate air filtration and advanced media like electrostatic precipitators capable of capturing microscopic contaminants.

Systems utilizing ULPA filters are now achieving a 99.999% capture rate for the most penetrating particle sizes, a key metric for cleanroom-equivalent air. This trend, coupled with stringent building codes, creates a stable replacement market.

Consequently, demand is consistent for solutions offering a low pressure drop and improved airflow resistance, driven by health trends that mandate superior mechanical interception and filtration efficiency.

Request Free Sample

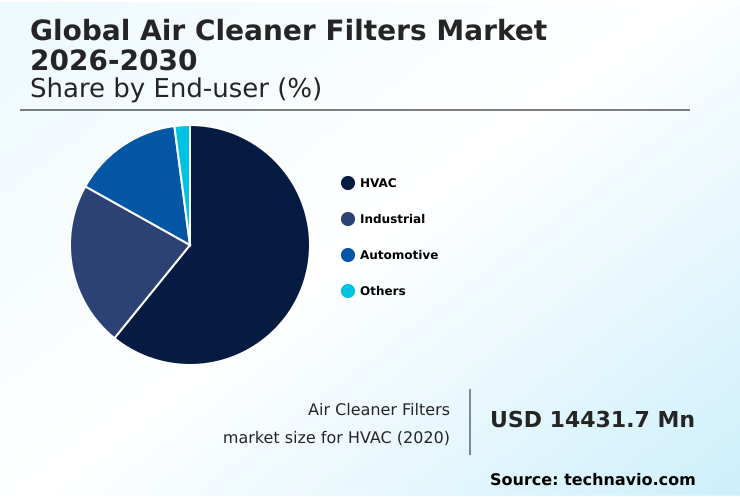
The HVAC segment was valued at USD 19.32 billion in 2024 and showed a gradual increase during the forecast period.

Request Free Sample

Regional Analysis

APAC is estimated to contribute 58.9% to the growth of the global market during the forecast period.Technavio’s analysts have elaborately explained the regional trends and drivers that shape the market during the forecast period.

See How Air Cleaner Filters Market Demand is Rising in APAC Request Free Sample

The geographic landscape is dominated by APAC, which accounts for over 58% of the market's incremental growth, fueled by rapid industrialization and acute air quality challenges.

In this region, government mandates and expanding manufacturing hubs for electronics, requiring ultra-clean environments with specialized filter media, drive significant demand.

In contrast, the mature markets of North America and Europe, which contribute a combined 32% of growth, are characterized by a focus on retrofitting existing infrastructure with high-performance filter arrays and smart filtration systems.

Regulatory frameworks in these regions mandate the use of certified filter media in public buildings to mitigate fine particulate matter, with systems using pleated media designs reducing energy consumption by up to 10%.

Market Dynamics

Our researchers analyzed the data with 2025 as the base year, along with the key drivers, trends, and challenges. A holistic analysis of drivers will help companies refine their marketing strategies to gain a competitive advantage.

  • The market is witnessing a decisive shift toward specialized and high-value filtration strategies. The integration of IoT for predictive maintenance in air cleaner filters is becoming standard in new commercial builds, moving beyond simple timers. This is complemented by the growing specification of high-efficiency particulate air filtration media in residential and healthcare settings, a direct response to heightened health awareness.
  • In industrial contexts, the use of cartridge filters for metalworking dust collection is expanding due to their efficiency and smaller footprint compared to older technologies. Simultaneously, the strategic pivot toward sustainable and biodegradable filter materials is gaining momentum, driven by corporate ESG goals and circular economy directives.
  • The development of ULPA filtration media for semiconductor fabrication cleanrooms continues to push the boundaries of air purity, while the application of activated carbon filters for VOC removal in offices is now a key consideration for workplace wellness programs.
  • This trend is further supported by the design of pleated media filters with low airflow resistance, which can reduce HVAC energy consumption by a notable margin over less advanced alternatives, illustrating a market-wide move toward holistic performance that balances efficiency, sustainability, and operational cost.

What are the key market drivers leading to the rise in the adoption of Air Cleaner Filters Industry?

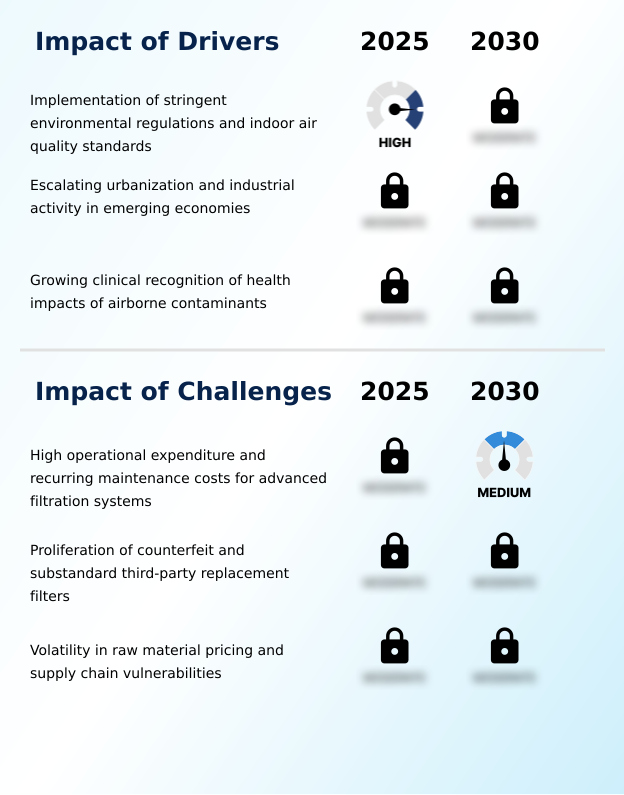
  • The implementation of stringent environmental regulations and indoor air quality standards serves as a key driver for market growth.

  • Stringent environmental regulations and a growing clinical recognition of the health impacts of airborne contaminants are primary market drivers.
  • Governmental mandates in North America and Europe, requiring certified filter media in commercial and industrial settings, create a resilient demand for high-performance filter arrays.
  • This regulatory push has accelerated the adoption of premium filtration, with facilities upgrading to systems that can mitigate fine particulate matter by over 99%.
  • Escalating urbanization, particularly in APAC, further fuels growth, as new infrastructure projects incorporate advanced HVAC systems from the outset. This structural expansion ensures a long-term trajectory for solutions addressing both health-centric consumer demands and industrial compliance needs.

What are the market trends shaping the Air Cleaner Filters Industry?

  • The proliferation of Internet of Things integration and artificial intelligence for predictive maintenance is an emerging market trend. This technological shift enables real-time monitoring and optimized filter performance.

  • The market is transforming through the integration of IoT and AI, enabling predictive maintenance and real-time air quality management. Smart filtration systems with embedded sensor technology can now analyze filter saturation and particulate matter levels, optimizing performance and reducing energy consumption by up to 20% in commercial buildings.
  • This shift to data-driven filtration is supported by AI algorithms that forecast replacement needs, eliminating wasteful, time-based schedules. The trend is especially prominent in smart home ecosystems, where connected devices provide users with detailed analytics.
  • This focus on intelligent air management is compelling manufacturers to innovate with advanced solutions like cartridge filters and baghouse filters that support digital diagnostics and align with sustainable building goals.

What challenges does the Air Cleaner Filters Industry face during its growth?

  • High operational expenditure and recurring maintenance costs associated with advanced filtration systems present a key challenge to industry growth.

  • Significant operational expenditure and the prevalence of counterfeit products are primary market challenges. The recurring cost of replacing high-performance filter media, such as nanofiber filter media, can be prohibitive, with maintenance expenses in some industrial settings accounting for up to 30% of the system's total lifecycle cost.
  • This financial pressure often leads to the extended use of saturated filters, which compromises filtration efficiency and increases energy consumption. Furthermore, the proliferation of counterfeit filters, which often fail to meet performance standards for mechanical interception, erodes consumer trust and can cause equipment damage. This situation creates significant price erosion and brand dilution for legitimate manufacturers.

Exclusive Technavio Analysis on Customer Landscape

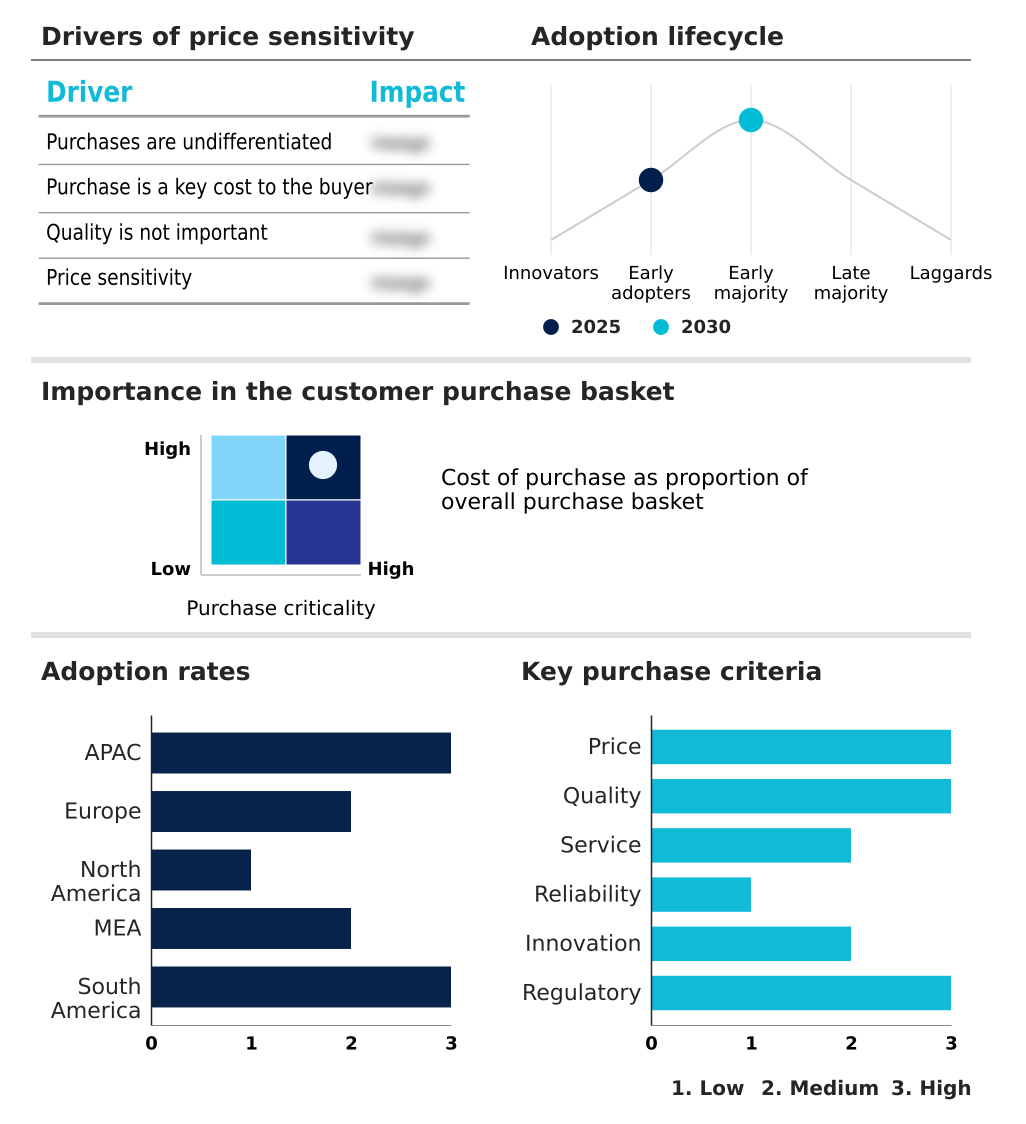
The air cleaner filters market forecasting report includes the adoption lifecycle of the market, covering from the innovator’s stage to the laggard’s stage. It focuses on adoption rates in different regions based on penetration. Furthermore, the air cleaner filters market report also includes key purchase criteria and drivers of price sensitivity to help companies evaluate and develop their market growth analysis strategies.

Customer Landscape of Air Cleaner Filters Industry

Competitive Landscape

Companies are implementing various strategies, such as strategic alliances, air cleaner filters market forecast, partnerships, mergers and acquisitions, geographical expansion, and product/service launches, to enhance their presence in the industry.

3M Co. - Offerings include comprehensive air filtration solutions designed to remove and control airborne particulates and gaseous contaminants across residential, commercial, and industrial applications.

The industry research and growth report includes detailed analyses of the competitive landscape of the market and information about key companies, including:

  • 3M Co.
  • American Air Filter Co. Inc.
  • Arovast Corp.
  • Blueair AB
  • Camfil AB
  • Carrier Global Corp.
  • Coway Co. Ltd.
  • Donaldson Co. Inc.
  • Dyson Ltd.
  • Honeywell International Inc.
  • IQAir AG
  • Koninklijke Philips NV
  • Lennox International Inc.
  • MANN HUMMEL International GmbH
  • Mativ Holdings Inc.
  • Pall Corp.
  • Panasonic Holdings Corp.
  • Parker Hannifin Corp.
  • Trane Technologies plc
  • Xiaomi Corp.

Qualitative and quantitative analysis of companies has been conducted to help clients understand the wider business environment as well as the strengths and weaknesses of key industry players. Data is qualitatively analyzed to categorize companies as pure play, category-focused, industry-focused, and diversified; it is quantitatively analyzed to categorize companies as dominant, leading, strong, tentative, and weak.

Recent Development and News in Air cleaner filters market

  • In January 2025, Rensa Filtration acquired Air Filtration Co., Inc., a specialized manufacturer for the paint and finishing industry, to expand its product portfolio and geographic reach into California and Iowa.
  • In February 2025, Johnson Controls announced a strategic partnership with a Silicon Valley technology firm to launch a new line of AI-integrated commercial air handling units featuring advanced sensor technology for dynamic performance optimization.
  • In March 2025, Panasonic launched its AtmosAI series, a next-generation air purification system for residential and commercial markets that uses AI and laser particle sensors for predictive filtration.
  • In April 2025, Coway Co. Ltd. launched its Airmega ProX line of residential air purifiers, featuring proprietary HyperCaptive filtration technology designed to deactivate certain viruses and bacteria on contact.

Dive into Technavio’s robust research methodology, blending expert interviews, extensive data synthesis, and validated models for unparalleled Air Cleaner Filters Market insights. See full methodology.

Market Scope
Page number 308
Base year 2025
Historic period 2020-2024
Forecast period 2026-2030
Growth momentum & CAGR Accelerate at a CAGR of 9.3%
Market growth 2026-2030 USD 18859.2 million
Market structure Fragmented
YoY growth 2025-2026(%) 8.4%
Key countries China, Japan, India, South Korea, Australia, Indonesia, Germany, UK, France, Italy, Spain, The Netherlands, US, Canada, Mexico, Saudi Arabia, UAE, South Africa, Israel, Turkey, Brazil, Argentina and Chile
Competitive landscape Leading Companies, Market Positioning of Companies, Competitive Strategies, and Industry Risks

Request Free Sample

Research Analyst Overview

  • The market is undergoing a significant transformation defined by technological advancement and a heightened focus on health and sustainability. Demand is no longer solely about basic mechanical interception; it has evolved to require sophisticated solutions like HEPA filters, ULPA filters, baghouse filters, and advanced electrostatic precipitators.
  • This shift is compelling a boardroom-level re-evaluation of capital expenditure, as investment in smart filtration systems with embedded sensor technology is now a strategic imperative. The use of nanofiber filter media and certified filter media is critical for meeting stringent indoor air quality standards.
  • For instance, advanced pleated media designs have demonstrated a 25% longer operational lifespan compared to traditional media, impacting both maintenance budgets and sustainability metrics. The adoption of AI algorithms and activated carbon filters is pivotal for managing complex airborne contaminants, while innovations in washable filter frames and media address growing environmental concerns.
  • This evolution necessitates a strategic pivot for manufacturers toward offering high-performance, data-driven, and sustainable filtration solutions.

What are the Key Data Covered in this Air Cleaner Filters Market Research and Growth Report?

  • What is the expected growth of the Air Cleaner Filters Market between 2026 and 2030?

    • USD 18.86 billion, at a CAGR of 9.3%

  • What segmentation does the market report cover?

    • The report is segmented by End-user (HVAC, Industrial, Automotive, and Others), Distribution Channel (Offline, and Online), Type (HEPA filters, Baghouse filters, Cartridge filters, Dust collectors, and Others) and Geography (APAC, Europe, North America, Middle East and Africa, South America)

  • Which regions are analyzed in the report?

    • APAC, Europe, North America, Middle East and Africa and South America

  • What are the key growth drivers and market challenges?

    • Implementation of stringent environmental regulations and indoor air quality standards, High operational expenditure and recurring maintenance costs for advanced filtration systems

  • Who are the major players in the Air Cleaner Filters Market?

    • 3M Co., American Air Filter Co. Inc., Arovast Corp., Blueair AB, Camfil AB, Carrier Global Corp., Coway Co. Ltd., Donaldson Co. Inc., Dyson Ltd., Honeywell International Inc., IQAir AG, Koninklijke Philips NV, Lennox International Inc., MANN HUMMEL International GmbH, Mativ Holdings Inc., Pall Corp., Panasonic Holdings Corp., Parker Hannifin Corp., Trane Technologies plc and Xiaomi Corp.

Market Research Insights

  • Market dynamics are increasingly influenced by a focus on verifiable performance metrics and sustainability. For instance, facilities adopting filtration systems with predictive maintenance capabilities have reported energy savings of up to 15% compared to those with fixed replacement schedules.
  • The shift towards circular economy initiatives is evident, as advanced systems now feature washable filter frames and media, reducing landfill waste by over 40% in some applications. This transition is driven by a heightened awareness of the health impacts of airborne contaminants like volatile organic compounds and fine particulate matter.
  • As a result, the market sees a divergence, with premium segments prioritizing data-driven filtration and a lower total cost of ownership, while price-sensitive segments still face challenges from the high operational expenditure of advanced systems.

We can help! Our analysts can customize this air cleaner filters market research report to meet your requirements.

Get in touch

1. Executive Summary

1.1 Market overview

Executive Summary - Chart on Market Overview
Executive Summary - Data Table on Market Overview
Executive Summary - Chart on Global Market Characteristics
Executive Summary - Chart on Market by Geography
Executive Summary - Chart on Market Segmentation by End-user
Executive Summary - Chart on Market Segmentation by Distribution Channel
Executive Summary - Chart on Market Segmentation by Type
Executive Summary - Chart on Incremental Growth
Executive Summary - Data Table on Incremental Growth
Executive Summary - Chart on Company Market Positioning

2. Technavio Analysis

2.1 Analysis of price sensitivity, lifecycle, customer purchase basket, adoption rates, and purchase criteria

2.2 Criticality of inputs and Factors of differentiation

Chart on Overview on criticality of inputs and factors of differentiation

2.3 Factors of disruption

Chart on Overview on factors of disruption

2.4 Impact of drivers and challenges

Chart on Impact of drivers and challenges in 2025 and 2030

3. Market Landscape

3.1 Market ecosystem

Chart on Parent Market
Data Table on - Parent Market

3.2 Market characteristics

Chart on Market characteristics analysis

3.3 Value chain analysis

Chart on Value chain analysis

4. Market Sizing

4.1 Market definition

Data Table on Offerings of companies included in the market definition

4.2 Market segment analysis

Market segments

4.3 Market size 2025

4.4 Market outlook: Forecast for 2025-2030

Chart on Global - Market size and forecast 2025-2030 ($ million)
Data Table on Global - Market size and forecast 2025-2030 ($ million)
Chart on Global Market: Year-over-year growth 2025-2030 (%)
Data Table on Global Market: Year-over-year growth 2025-2030 (%)

5. Historic Market Size

5.1 Global Air Cleaner Filters Market 2020 - 2024

Historic Market Size - Data Table on Global Air Cleaner Filters Market 2020 - 2024 ($ million)

5.2 End-user segment analysis 2020 - 2024

Historic Market Size - End-user Segment 2020 - 2024 ($ million)

5.3 Distribution Channel segment analysis 2020 - 2024

Historic Market Size - Distribution Channel Segment 2020 - 2024 ($ million)

5.4 Type segment analysis 2020 - 2024

Historic Market Size - Type Segment 2020 - 2024 ($ million)

5.5 Geography segment analysis 2020 - 2024

Historic Market Size - Geography Segment 2020 - 2024 ($ million)

5.6 Country segment analysis 2020 - 2024

Historic Market Size - Country Segment 2020 - 2024 ($ million)

6. Qualitative Analysis

6.1 Impact of AI on global air cleaner filters market

6.2 Impact of geopolitical conflicts on global air cleaner filters market

7. Five Forces Analysis

7.1 Five forces summary

Five forces analysis - Comparison between 2025 and 2030

7.2 Bargaining power of buyers

Bargaining power of buyers - Impact of key factors 2025 and 2030

7.3 Bargaining power of suppliers

Bargaining power of suppliers - Impact of key factors in 2025 and 2030

7.4 Threat of new entrants

Threat of new entrants - Impact of key factors in 2025 and 2030

7.5 Threat of substitutes

Threat of substitutes - Impact of key factors in 2025 and 2030

7.6 Threat of rivalry

Threat of rivalry - Impact of key factors in 2025 and 2030

7.7 Market condition

Chart on Market condition - Five forces 2025 and 2030

8. Market Segmentation by End-user

8.1 Market segments

Chart on End-user - Market share 2025-2030 (%)
Data Table on End-user - Market share 2025-2030 (%)

8.2 Comparison by End-user

Chart on Comparison by End-user
Data Table on Comparison by End-user

8.3 HVAC - Market size and forecast 2025-2030

Chart on HVAC - Market size and forecast 2025-2030 ($ million)
Data Table on HVAC - Market size and forecast 2025-2030 ($ million)
Chart on HVAC - Year-over-year growth 2025-2030 (%)
Data Table on HVAC - Year-over-year growth 2025-2030 (%)

8.4 Industrial - Market size and forecast 2025-2030

Chart on Industrial - Market size and forecast 2025-2030 ($ million)
Data Table on Industrial - Market size and forecast 2025-2030 ($ million)
Chart on Industrial - Year-over-year growth 2025-2030 (%)
Data Table on Industrial - Year-over-year growth 2025-2030 (%)

8.5 Automotive - Market size and forecast 2025-2030

Chart on Automotive - Market size and forecast 2025-2030 ($ million)
Data Table on Automotive - Market size and forecast 2025-2030 ($ million)
Chart on Automotive - Year-over-year growth 2025-2030 (%)
Data Table on Automotive - Year-over-year growth 2025-2030 (%)

8.6 Others - Market size and forecast 2025-2030

Chart on Others - Market size and forecast 2025-2030 ($ million)
Data Table on Others - Market size and forecast 2025-2030 ($ million)
Chart on Others - Year-over-year growth 2025-2030 (%)
Data Table on Others - Year-over-year growth 2025-2030 (%)

8.7 Market opportunity by End-user

Market opportunity by End-user ($ million)
Data Table on Market opportunity by End-user ($ million)

9. Market Segmentation by Distribution Channel

9.1 Market segments

Chart on Distribution Channel - Market share 2025-2030 (%)
Data Table on Distribution Channel - Market share 2025-2030 (%)

9.2 Comparison by Distribution Channel

Chart on Comparison by Distribution Channel
Data Table on Comparison by Distribution Channel

9.3 Offline - Market size and forecast 2025-2030

Chart on Offline - Market size and forecast 2025-2030 ($ million)
Data Table on Offline - Market size and forecast 2025-2030 ($ million)
Chart on Offline - Year-over-year growth 2025-2030 (%)
Data Table on Offline - Year-over-year growth 2025-2030 (%)

9.4 Online - Market size and forecast 2025-2030

Chart on Online - Market size and forecast 2025-2030 ($ million)
Data Table on Online - Market size and forecast 2025-2030 ($ million)
Chart on Online - Year-over-year growth 2025-2030 (%)
Data Table on Online - Year-over-year growth 2025-2030 (%)

9.5 Market opportunity by Distribution Channel

Market opportunity by Distribution Channel ($ million)
Data Table on Market opportunity by Distribution Channel ($ million)

10. Market Segmentation by Type

10.1 Market segments

Chart on Type - Market share 2025-2030 (%)
Data Table on Type - Market share 2025-2030 (%)

10.2 Comparison by Type

Chart on Comparison by Type
Data Table on Comparison by Type

10.3 HEPA filters - Market size and forecast 2025-2030

Chart on HEPA filters - Market size and forecast 2025-2030 ($ million)
Data Table on HEPA filters - Market size and forecast 2025-2030 ($ million)
Chart on HEPA filters - Year-over-year growth 2025-2030 (%)
Data Table on HEPA filters - Year-over-year growth 2025-2030 (%)

10.4 Baghouse filters - Market size and forecast 2025-2030

Chart on Baghouse filters - Market size and forecast 2025-2030 ($ million)
Data Table on Baghouse filters - Market size and forecast 2025-2030 ($ million)
Chart on Baghouse filters - Year-over-year growth 2025-2030 (%)
Data Table on Baghouse filters - Year-over-year growth 2025-2030 (%)

10.5 Cartridge filters - Market size and forecast 2025-2030

Chart on Cartridge filters - Market size and forecast 2025-2030 ($ million)
Data Table on Cartridge filters - Market size and forecast 2025-2030 ($ million)
Chart on Cartridge filters - Year-over-year growth 2025-2030 (%)
Data Table on Cartridge filters - Year-over-year growth 2025-2030 (%)

10.6 Dust collectors - Market size and forecast 2025-2030

Chart on Dust collectors - Market size and forecast 2025-2030 ($ million)
Data Table on Dust collectors - Market size and forecast 2025-2030 ($ million)
Chart on Dust collectors - Year-over-year growth 2025-2030 (%)
Data Table on Dust collectors - Year-over-year growth 2025-2030 (%)

10.7 Others - Market size and forecast 2025-2030

Chart on Others - Market size and forecast 2025-2030 ($ million)
Data Table on Others - Market size and forecast 2025-2030 ($ million)
Chart on Others - Year-over-year growth 2025-2030 (%)
Data Table on Others - Year-over-year growth 2025-2030 (%)

10.8 Market opportunity by Type

Market opportunity by Type ($ million)
Data Table on Market opportunity by Type ($ million)

11. Customer Landscape

11.1 Customer landscape overview

Analysis of price sensitivity, lifecycle, customer purchase basket, adoption rates, and purchase criteria

12. Geographic Landscape

12.1 Geographic segmentation

Chart on Market share by geography 2025-2030 (%)
Data Table on Market share by geography 2025-2030 (%)

12.2 Geographic comparison

Chart on Geographic comparison
Data Table on Geographic comparison

12.3 APAC - Market size and forecast 2025-2030

Chart on APAC - Market size and forecast 2025-2030 ($ million)
Data Table on APAC - Market size and forecast 2025-2030 ($ million)
Chart on APAC - Year-over-year growth 2025-2030 (%)
Data Table on APAC - Year-over-year growth 2025-2030 (%)
Chart on Regional Comparison - APAC
Data Table on Regional Comparison - APAC

12.3.1 China - Market size and forecast 2025-2030

Chart on China - Market size and forecast 2025-2030 ($ million)
Data Table on China - Market size and forecast 2025-2030 ($ million)
Chart on China - Year-over-year growth 2025-2030 (%)
Data Table on China - Year-over-year growth 2025-2030 (%)

12.3.2 Japan - Market size and forecast 2025-2030

Chart on Japan - Market size and forecast 2025-2030 ($ million)
Data Table on Japan - Market size and forecast 2025-2030 ($ million)
Chart on Japan - Year-over-year growth 2025-2030 (%)
Data Table on Japan - Year-over-year growth 2025-2030 (%)

12.3.3 India - Market size and forecast 2025-2030

Chart on India - Market size and forecast 2025-2030 ($ million)
Data Table on India - Market size and forecast 2025-2030 ($ million)
Chart on India - Year-over-year growth 2025-2030 (%)
Data Table on India - Year-over-year growth 2025-2030 (%)

12.3.4 South Korea - Market size and forecast 2025-2030

Chart on South Korea - Market size and forecast 2025-2030 ($ million)
Data Table on South Korea - Market size and forecast 2025-2030 ($ million)
Chart on South Korea - Year-over-year growth 2025-2030 (%)
Data Table on South Korea - Year-over-year growth 2025-2030 (%)

12.3.5 Australia - Market size and forecast 2025-2030

Chart on Australia - Market size and forecast 2025-2030 ($ million)
Data Table on Australia - Market size and forecast 2025-2030 ($ million)
Chart on Australia - Year-over-year growth 2025-2030 (%)
Data Table on Australia - Year-over-year growth 2025-2030 (%)

12.3.6 Indonesia - Market size and forecast 2025-2030

Chart on Indonesia - Market size and forecast 2025-2030 ($ million)
Data Table on Indonesia - Market size and forecast 2025-2030 ($ million)
Chart on Indonesia - Year-over-year growth 2025-2030 (%)
Data Table on Indonesia - Year-over-year growth 2025-2030 (%)

12.4 Europe - Market size and forecast 2025-2030

Chart on Europe - Market size and forecast 2025-2030 ($ million)
Data Table on Europe - Market size and forecast 2025-2030 ($ million)
Chart on Europe - Year-over-year growth 2025-2030 (%)
Data Table on Europe - Year-over-year growth 2025-2030 (%)
Chart on Regional Comparison - Europe
Data Table on Regional Comparison - Europe

12.4.1 Germany - Market size and forecast 2025-2030

Chart on Germany - Market size and forecast 2025-2030 ($ million)
Data Table on Germany - Market size and forecast 2025-2030 ($ million)
Chart on Germany - Year-over-year growth 2025-2030 (%)
Data Table on Germany - Year-over-year growth 2025-2030 (%)

12.4.2 UK - Market size and forecast 2025-2030

Chart on UK - Market size and forecast 2025-2030 ($ million)
Data Table on UK - Market size and forecast 2025-2030 ($ million)
Chart on UK - Year-over-year growth 2025-2030 (%)
Data Table on UK - Year-over-year growth 2025-2030 (%)

12.4.3 France - Market size and forecast 2025-2030

Chart on France - Market size and forecast 2025-2030 ($ million)
Data Table on France - Market size and forecast 2025-2030 ($ million)
Chart on France - Year-over-year growth 2025-2030 (%)
Data Table on France - Year-over-year growth 2025-2030 (%)

12.4.4 Italy - Market size and forecast 2025-2030

Chart on Italy - Market size and forecast 2025-2030 ($ million)
Data Table on Italy - Market size and forecast 2025-2030 ($ million)
Chart on Italy - Year-over-year growth 2025-2030 (%)
Data Table on Italy - Year-over-year growth 2025-2030 (%)

12.4.5 Spain - Market size and forecast 2025-2030

Chart on Spain - Market size and forecast 2025-2030 ($ million)
Data Table on Spain - Market size and forecast 2025-2030 ($ million)
Chart on Spain - Year-over-year growth 2025-2030 (%)
Data Table on Spain - Year-over-year growth 2025-2030 (%)

12.4.6 The Netherlands - Market size and forecast 2025-2030

Chart on The Netherlands - Market size and forecast 2025-2030 ($ million)
Data Table on The Netherlands - Market size and forecast 2025-2030 ($ million)
Chart on The Netherlands - Year-over-year growth 2025-2030 (%)
Data Table on The Netherlands - Year-over-year growth 2025-2030 (%)

12.5 North America - Market size and forecast 2025-2030

Chart on North America - Market size and forecast 2025-2030 ($ million)
Data Table on North America - Market size and forecast 2025-2030 ($ million)
Chart on North America - Year-over-year growth 2025-2030 (%)
Data Table on North America - Year-over-year growth 2025-2030 (%)
Chart on Regional Comparison - North America
Data Table on Regional Comparison - North America

12.5.1 US - Market size and forecast 2025-2030

Chart on US - Market size and forecast 2025-2030 ($ million)
Data Table on US - Market size and forecast 2025-2030 ($ million)
Chart on US - Year-over-year growth 2025-2030 (%)
Data Table on US - Year-over-year growth 2025-2030 (%)

12.5.2 Canada - Market size and forecast 2025-2030

Chart on Canada - Market size and forecast 2025-2030 ($ million)
Data Table on Canada - Market size and forecast 2025-2030 ($ million)
Chart on Canada - Year-over-year growth 2025-2030 (%)
Data Table on Canada - Year-over-year growth 2025-2030 (%)

12.5.3 Mexico - Market size and forecast 2025-2030

Chart on Mexico - Market size and forecast 2025-2030 ($ million)
Data Table on Mexico - Market size and forecast 2025-2030 ($ million)
Chart on Mexico - Year-over-year growth 2025-2030 (%)
Data Table on Mexico - Year-over-year growth 2025-2030 (%)

12.6 Middle East and Africa - Market size and forecast 2025-2030

Chart on Middle East and Africa - Market size and forecast 2025-2030 ($ million)
Data Table on Middle East and Africa - Market size and forecast 2025-2030 ($ million)
Chart on Middle East and Africa - Year-over-year growth 2025-2030 (%)
Data Table on Middle East and Africa - Year-over-year growth 2025-2030 (%)
Chart on Regional Comparison - Middle East and Africa
Data Table on Regional Comparison - Middle East and Africa

12.6.1 Saudi Arabia - Market size and forecast 2025-2030

Chart on Saudi Arabia - Market size and forecast 2025-2030 ($ million)
Data Table on Saudi Arabia - Market size and forecast 2025-2030 ($ million)
Chart on Saudi Arabia - Year-over-year growth 2025-2030 (%)
Data Table on Saudi Arabia - Year-over-year growth 2025-2030 (%)

12.6.2 UAE - Market size and forecast 2025-2030

Chart on UAE - Market size and forecast 2025-2030 ($ million)
Data Table on UAE - Market size and forecast 2025-2030 ($ million)
Chart on UAE - Year-over-year growth 2025-2030 (%)
Data Table on UAE - Year-over-year growth 2025-2030 (%)

12.6.3 South Africa - Market size and forecast 2025-2030

Chart on South Africa - Market size and forecast 2025-2030 ($ million)
Data Table on South Africa - Market size and forecast 2025-2030 ($ million)
Chart on South Africa - Year-over-year growth 2025-2030 (%)
Data Table on South Africa - Year-over-year growth 2025-2030 (%)

12.6.4 Israel - Market size and forecast 2025-2030

Chart on Israel - Market size and forecast 2025-2030 ($ million)
Data Table on Israel - Market size and forecast 2025-2030 ($ million)
Chart on Israel - Year-over-year growth 2025-2030 (%)
Data Table on Israel - Year-over-year growth 2025-2030 (%)

12.6.5 Turkey - Market size and forecast 2025-2030

Chart on Turkey - Market size and forecast 2025-2030 ($ million)
Data Table on Turkey - Market size and forecast 2025-2030 ($ million)
Chart on Turkey - Year-over-year growth 2025-2030 (%)
Data Table on Turkey - Year-over-year growth 2025-2030 (%)

12.7 South America - Market size and forecast 2025-2030

Chart on South America - Market size and forecast 2025-2030 ($ million)
Data Table on South America - Market size and forecast 2025-2030 ($ million)
Chart on South America - Year-over-year growth 2025-2030 (%)
Data Table on South America - Year-over-year growth 2025-2030 (%)
Chart on Regional Comparison - South America
Data Table on Regional Comparison - South America

12.7.1 Brazil - Market size and forecast 2025-2030

Chart on Brazil - Market size and forecast 2025-2030 ($ million)
Data Table on Brazil - Market size and forecast 2025-2030 ($ million)
Chart on Brazil - Year-over-year growth 2025-2030 (%)
Data Table on Brazil - Year-over-year growth 2025-2030 (%)

12.7.2 Argentina - Market size and forecast 2025-2030

Chart on Argentina - Market size and forecast 2025-2030 ($ million)
Data Table on Argentina - Market size and forecast 2025-2030 ($ million)
Chart on Argentina - Year-over-year growth 2025-2030 (%)
Data Table on Argentina - Year-over-year growth 2025-2030 (%)

12.7.3 Chile - Market size and forecast 2025-2030

Chart on Chile - Market size and forecast 2025-2030 ($ million)
Data Table on Chile - Market size and forecast 2025-2030 ($ million)
Chart on Chile - Year-over-year growth 2025-2030 (%)
Data Table on Chile - Year-over-year growth 2025-2030 (%)

12.8 Market opportunity by geography

Market opportunity by geography ($ million)
Data Tables on Market opportunity by geography ($ million)

13. Drivers, Challenges, and Opportunity

13.1 Market drivers

Implementation of stringent environmental regulations and indoor air quality standards
Escalating urbanization and industrial activity in emerging economies
Growing clinical recognition of health impacts of airborne contaminants

13.2 Market challenges

High operational expenditure and recurring maintenance costs for advanced filtration systems
Proliferation of counterfeit and substandard third-party replacement filters
Volatility in raw material pricing and supply chain vulnerabilities

13.3 Impact of drivers and challenges

Impact of drivers and challenges in 2025 and 2030

13.4 Market opportunities

Proliferation of internet of things integration and artificial intelligence for predictive maintenance
Heightened demand for high-efficiency particulate air and ultra-low penetration air filtration media
Strategic pivot toward sustainable and biodegradable filter materials to support circular economy initiatives

14. Competitive Landscape

14.1 Overview

14.2

Overview on criticality of inputs and factors of differentiation

14.3 Landscape disruption

Overview on factors of disruption

14.4 Industry risks

Impact of key risks on business

15. Competitive Analysis

15.1 Companies profiled

Companies covered

15.2 Company ranking index

15.3 Market positioning of companies

Matrix on companies position and classification

15.4 3M Co.

3M Co. - Overview
3M Co. - Business segments
3M Co. - Key news
3M Co. - Key offerings
3M Co. - Segment focus
SWOT

15.5 American Air Filter Co. Inc.

American Air Filter Co. Inc. - Overview
American Air Filter Co. Inc. - Product / Service
American Air Filter Co. Inc. - Key offerings
SWOT

15.6 Camfil AB

Camfil AB - Overview
Camfil AB - Product / Service
Camfil AB - Key offerings
SWOT

15.7 Carrier Global Corp.

Carrier Global Corp. - Overview
Carrier Global Corp. - Business segments
Carrier Global Corp. - Key news
Carrier Global Corp. - Key offerings
Carrier Global Corp. - Segment focus
SWOT

15.8 Donaldson Co. Inc.

Donaldson Co. Inc. - Overview
Donaldson Co. Inc. - Business segments
Donaldson Co. Inc. - Key offerings
Donaldson Co. Inc. - Segment focus
SWOT

15.9 Dyson Ltd.

Dyson Ltd. - Overview
Dyson Ltd. - Product / Service
Dyson Ltd. - Key offerings
SWOT

15.10 Honeywell International Inc.

Honeywell International Inc. - Overview
Honeywell International Inc. - Business segments
Honeywell International Inc. - Key news
Honeywell International Inc. - Key offerings
Honeywell International Inc. - Segment focus
SWOT

15.11 Koninklijke Philips NV

Koninklijke Philips NV - Overview
Koninklijke Philips NV - Business segments
Koninklijke Philips NV - Key news
Koninklijke Philips NV - Key offerings
Koninklijke Philips NV - Segment focus
SWOT

15.12 Lennox International Inc.

Lennox International Inc. - Overview
Lennox International Inc. - Business segments
Lennox International Inc. - Key offerings
Lennox International Inc. - Segment focus
SWOT

15.13 MANN HUMMEL International GmbH

MANN HUMMEL International GmbH - Overview
MANN HUMMEL International GmbH - Product / Service
MANN HUMMEL International GmbH - Key offerings
SWOT

15.14 Mativ Holdings Inc.

Mativ Holdings Inc. - Overview
Mativ Holdings Inc. - Business segments
Mativ Holdings Inc. - Key offerings
Mativ Holdings Inc. - Segment focus
SWOT

15.15 Panasonic Holdings Corp.

Panasonic Holdings Corp. - Overview
Panasonic Holdings Corp. - Business segments
Panasonic Holdings Corp. - Key news
Panasonic Holdings Corp. - Key offerings
Panasonic Holdings Corp. - Segment focus
SWOT

15.16 Parker Hannifin Corp.

Parker Hannifin Corp. - Overview
Parker Hannifin Corp. - Business segments
Parker Hannifin Corp. - Key offerings
Parker Hannifin Corp. - Segment focus
SWOT

15.17 Trane Technologies plc

Trane Technologies plc - Overview
Trane Technologies plc - Business segments
Trane Technologies plc - Key news
Trane Technologies plc - Key offerings
Trane Technologies plc - Segment focus
SWOT

15.18 Xiaomi Corp.

Xiaomi Corp. - Overview
Xiaomi Corp. - Business segments
Xiaomi Corp. - Key offerings
Xiaomi Corp. - Segment focus
SWOT

16. Appendix

16.1 Scope of the report

Market definition
Objectives
Notes and caveats

16.2 Inclusions and exclusions checklist

Inclusions checklist
Exclusions checklist

16.3 Currency conversion rates for US$

16.4 Research methodology

16.5 Data procurement

Information sources

16.6 Data validation

16.7 Validation techniques employed for market sizing

16.8 Data synthesis

16.9 360 degree market analysis

16.10 List of abbreviations

Research Methodology

Technavio presents a detailed picture of the market by way of study, synthesis, and summation of data from multiple sources. The analysts have presented the various facets of the market with a particular focus on identifying the key industry influencers. The data thus presented is comprehensive, reliable, and the result of extensive research, both primary and secondary.

INFORMATION SOURCES

Primary sources

  • Manufacturers and suppliers
  • Channel partners
  • Industry experts
  • Strategic decision makers

Secondary sources

  • Industry journals and periodicals
  • Government data
  • Financial reports of key industry players
  • Historical data
  • Press releases

DATA ANALYSIS

Data Synthesis

  • Collation of data
  • Estimation of key figures
  • Analysis of derived insights

Data Validation

  • Triangulation with data models
  • Reference against proprietary databases
  • Corroboration with industry experts

REPORT WRITING

Qualitative

  • Market drivers
  • Market challenges
  • Market trends
  • Five forces analysis

Quantitative

  • Market size and forecast
  • Market segmentation
  • Geographical insights
  • Competitive landscape

Interested in this report?

Get your sample now to see our research methodology and insights!

Download Now

Frequently Asked Questions

Air Cleaner Filters market growth will increase by USD 18859.2 million during 2026-2030.

The Air Cleaner Filters market is expected to grow at a CAGR of 9.3% during 2026-2030.

Air Cleaner Filters market is segmented by End-user (HVAC, Industrial, Automotive, Others) Distribution channel (Offline, Online) Type (HEPA filters, Baghouse filters, Cartridge filters, Dust collectors, Others)

3M Co., American Air Filter Co. Inc., Arovast Corp., Blueair AB, Camfil AB, Carrier Global Corp., Coway Co. Ltd., Donaldson Co. Inc., Dyson Ltd., Honeywell International Inc., IQAir AG, Koninklijke Philips NV, Lennox International Inc., MANN HUMMEL International GmbH, Mativ Holdings Inc., Pall Corp., Panasonic Holdings Corp., Parker Hannifin Corp., Trane Technologies plc, Xiaomi Corp. are a few of the key vendors in the Air Cleaner Filters market.

APAC will register the highest growth rate of 58.9% among the other regions. Therefore, the Air Cleaner Filters market in APAC is expected to garner significant business opportunities for the vendors during the forecast period.

China, Japan, India, South Korea, Australia, Indonesia, Germany, UK, France, Italy, Spain, The Netherlands, US, Canada, Mexico, Saudi Arabia, UAE, South Africa, Israel, Turkey, Brazil, Argentina, Chile

  • Implementation of stringent environmental regulations and indoor air quality standards is the driving factor this market.

The Air Cleaner Filters market vendors should focus on grabbing business opportunities from the End-user segment as it accounted for the largest market share in the base year.
RIA - Research AI Assistant
Ask RIA