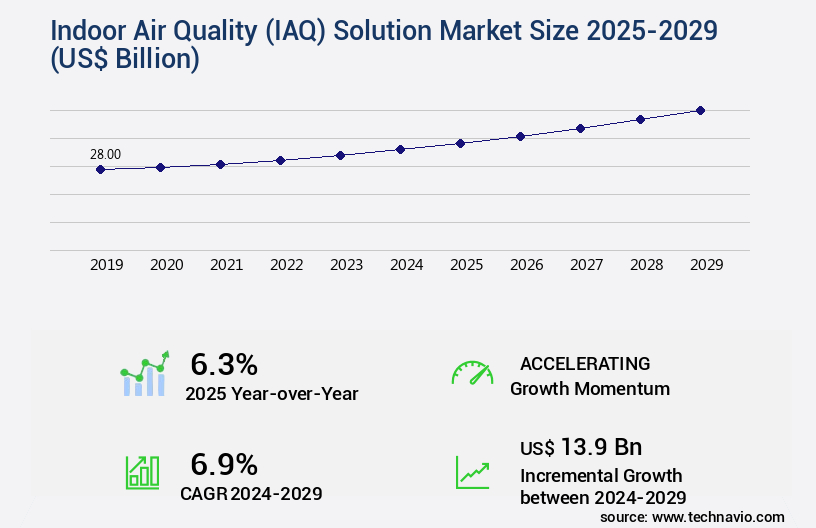
Indoor Air Quality (IAQ) Solution Market Size 2025-2029
The indoor air quality (iaq) solution market size is valued to increase USD 13.9 billion, at a CAGR of 6.9% from 2024 to 2029. New air quality product launches will drive the indoor air quality (iaq) solution market.
Major Market Trends & Insights
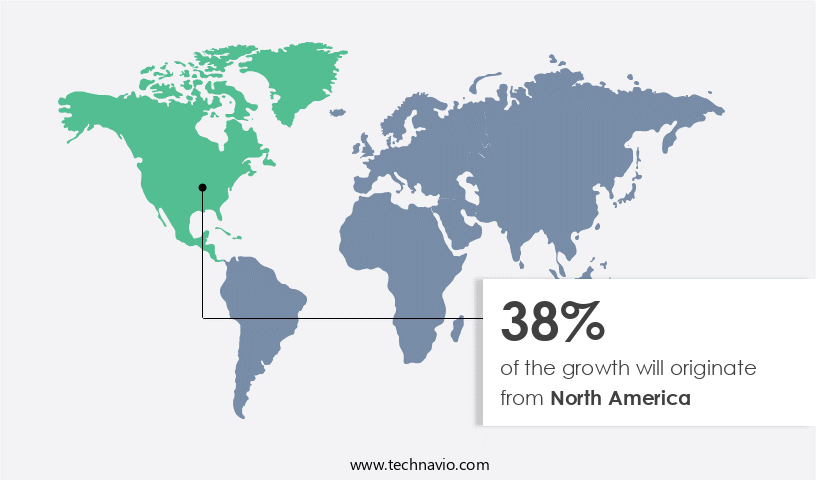
	- North America dominated the market and accounted for a 38% growth during the forecast period.
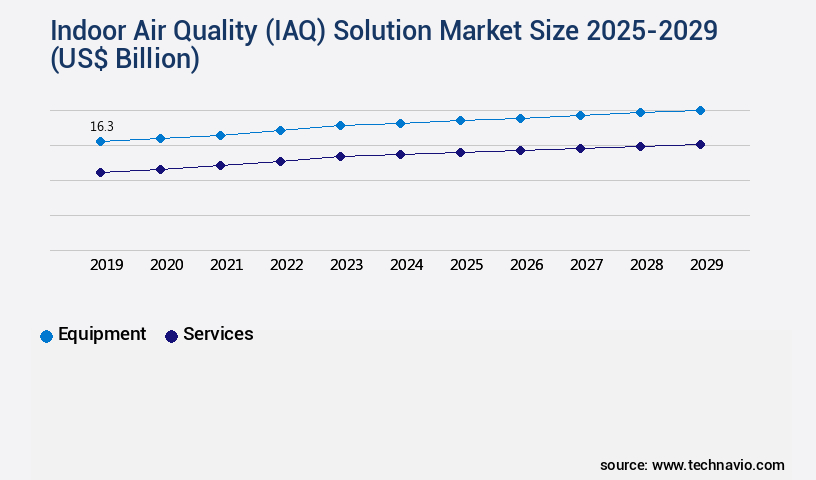
- By Product - Equipment segment was valued at USD 16.30 billion in 2023
- By Type - Fixed segment accounted for the largest market revenue share in 2023
Market Size & Forecast
	- Market Opportunities: USD 74.29 billion
- Market Future Opportunities: USD 13.90 billion
- CAGR : 6.9%
- North America: Largest market in 2023
Market Summary
- The market encompasses a continually evolving landscape of technologies, applications, and regulations aimed at improving the air we breathe in enclosed spaces. Core technologies, such as sensors, filtration systems, and air purifiers, are at the forefront of this market, driving innovation and adoption. Applications span various sectors, including healthcare, residential, and commercial, with growing emphasis on energy efficiency and user comfort. Service types or product categories, such as maintenance and installation services, are essential components of the market's ecosystem. Regulations, like the European Union's Indoor Air Quality Directive, play a crucial role in shaping market trends. The IAQ Solution Market is characterized by high competition among companies, with companies like Daikin, Honeywell, and Philips leading the charge.
- According to a recent report, the global market for air purifiers alone is projected to reach a 22% adoption rate by 2025. New product launches and technological advances in indoor air quality solutions continue to shape the market, offering both opportunities and challenges for companies.
What will be the Size of the Indoor Air Quality (IAQ) Solution Market during the forecast period?

Get Key Insights on Market Forecast (PDF) Request Free Sample
How is the Indoor Air Quality (IAQ) Solution Market Segmented and what are the key trends of market segmentation?
The indoor air quality (iaq) solution industry research report provides comprehensive data (region-wise segment analysis), with forecasts and estimates in "USD billion" for the period 2025-2029, as well as historical data from 2019-2023 for the following segments. 
- Product
- Type
- Pollutant Type- Chemical pollutants
- Physical pollutants
- Biological pollutants
- Chemical pollutants
- Physical pollutants
- Biological pollutants
 
- Technology- HEPA Filters
- UV-C
- IoT-Enabled
 
- Application
- Geography- North America
- Europe
- Middle East and Africa
- APAC
- South America
- Rest of World (ROW)
 
By Product Insights
The equipment segment is estimated to witness significant growth during the forecast period.
Indoor air quality (IAQ) plays a crucial role in maintaining the health and well-being of building occupants. Regular testing is essential to detect allergens, radon, CO2 emissions, and other harmful gases like chlorofluorocarbons (CFCs) and hydrofluorocarbons (HFCs), as well as volatile organic compounds (VOCs) emitted by electronic devices. The global market for IAQ solutions, comprising air monitor sensors, air purifiers, and humidifiers, is experiencing significant growth. According to recent reports, the market for IAQ equipment is projected to expand substantially during the forecast period. Smart and cost-effective air monitoring sensors are driving this growth due to their ability to provide real-time data on IAQ parameters.
Building energy modeling, HVAC system efficiency, and particle filtration efficacy are key factors influencing the demand for these sensors. Additionally, ventilation effectiveness testing, HVAC system upgrades, and microbial air contamination mitigation are other significant trends shaping the market. Moreover, the integration of advanced technologies, such as airborne pathogen reduction, indoor environmental control, and airflow distribution modeling, is enhancing the capabilities of IAQ systems. Humidity control systems, air purification technology, and integrated IAQ systems are also gaining popularity due to their energy efficiency improvements and airflow optimization capabilities. The building commissioning process, including energy recovery ventilation and thermal comfort assessment, is another area where IAQ solutions are making a significant impact.
Air purification effectiveness, sensor data analytics, and carbon dioxide concentration monitoring are essential aspects of these systems. Filtration media selection is a critical factor in ensuring the optimal performance of air purifiers and other IAQ equipment. In conclusion, the IAQ solution market is undergoing continuous evolution, with a focus on enhancing indoor air quality and comfort levels while minimizing energy consumption. The market's growth is driven by the increasing awareness of the health risks associated with poor indoor air quality and the availability of advanced technologies to address these challenges.

Request Free Sample
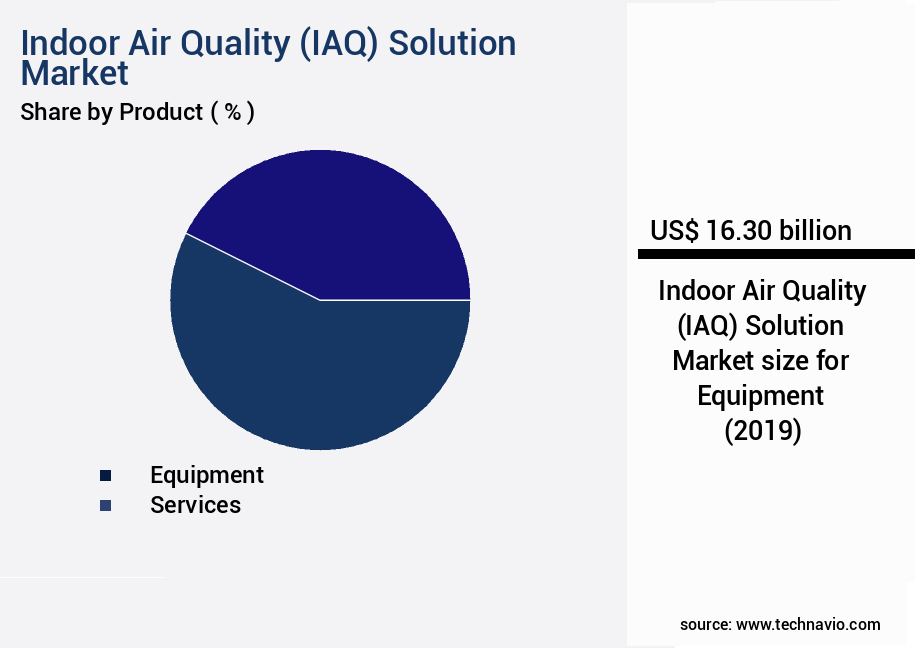
The Equipment segment was valued at USD 16.30 billion in 2019 and showed a gradual increase during the forecast period.

Request Free Sample
Regional Analysis
North America is estimated to contribute 38% to the growth of the global market during the forecast period.Technavio’s analysts have elaborately explained the regional trends and drivers that shape the market during the forecast period.

See How Indoor Air Quality (IAQ) Solution Market Demand is Rising in North America Request Free Sample
The market in North America is experiencing notable expansion, driven by the increasing number of pollutants and subsequent regulations. The US Environmental Protection Agency (EPA) and Occupational Safety and Health Administration (OSHA) are among the regulatory bodies setting standards to enhance indoor air quality. ASHRAE also plays a significant role in establishing guidelines for improving indoor air quality in the US. Approximately 50% of all building-related illnesses are linked to poor IAQ, making it a critical concern for businesses and homeowners alike. Additionally, the presence of allergens and volatile organic compounds (VOCs) in indoor environments further emphasizes the need for effective IAQ solutions.
According to recent studies, the market for IAQ products and services in North America is projected to reach 12.5 billion USD by 2026, growing at a steady pace. This growth can be attributed to the increasing awareness of the importance of maintaining healthy indoor environments and the availability of advanced technologies for IAQ monitoring and management.
Market Dynamics
Our researchers analyzed the data with 2024 as the base year, along with the key drivers, trends, and challenges. A holistic analysis of drivers will help companies refine their marketing strategies to gain a competitive advantage.
The market encompasses a range of technologies and services aimed at optimizing HVAC systems for energy efficiency, reducing airborne pathogens via air purification, implementing real-time air quality monitoring, assessing ventilation effectiveness in buildings, and improving indoor air quality with smart building tech. These solutions are essential for managing indoor environmental conditions, mitigating risks associated with Sick Building Syndrome, and enhancing thermal comfort through HVAC control. Measuring particulate matter in indoor air and analyzing ventilation system performance data are critical aspects of IAQ management. Implementing air quality standards and compliance, optimizing building design for IAQ, assessing the impact of building materials on IAQ, using sensor data for IAQ management and control, minimizing Volatile Organic Compounds (VOCs) indoors, and controlling humidity levels in indoor environments are all integral components of this market.
Notably, more than 70% of new product developments in the IAQ solution market focus on energy-efficient HVAC systems, reflecting the growing importance of reducing energy consumption while maintaining optimal indoor air quality. This trend underscores the market's commitment to enhancing occupant health via improved IAQ, making it a significant area of investment for businesses and organizations worldwide. In contrast, a minority of players in the IAQ solution market account for a significantly larger share of high-end filtration technologies, highlighting the importance of differentiation and innovation in this competitive landscape. By leveraging research-backed insights and advanced technologies, market participants can create value-added solutions that cater to the diverse needs of their clientele, ultimately driving growth and market expansion.

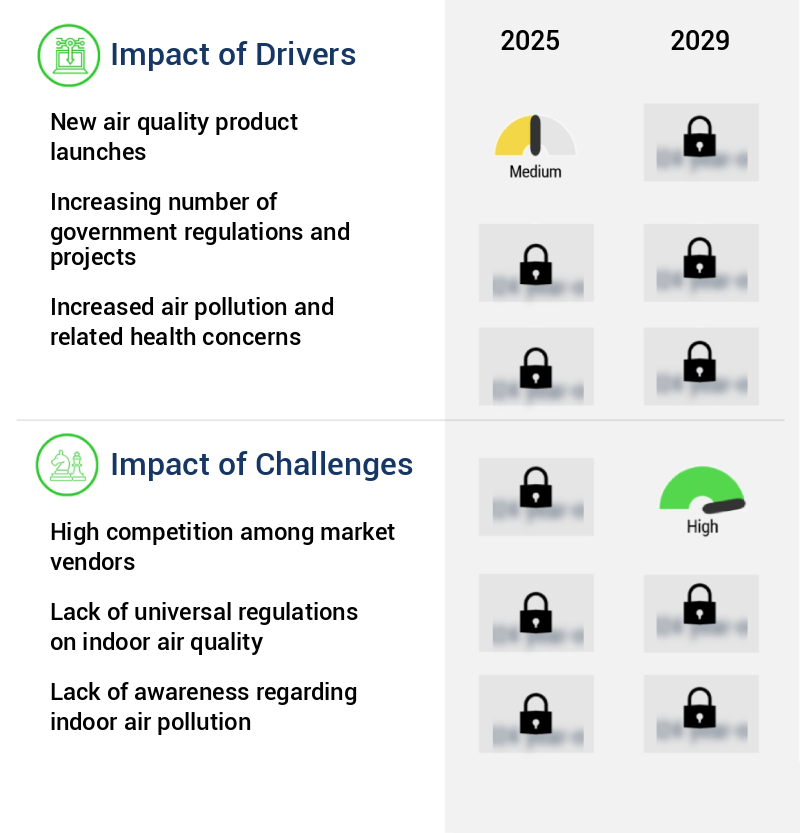
What are the key market drivers leading to the rise in the adoption of Indoor Air Quality (IAQ) Solution Industry?
	- The new air quality product launches are the primary catalyst for market growth. 
- Smart air purifiers have gained significant attention in the market due to increasing consumer awareness about indoor air quality. companies have responded by introducing new products and innovations to cater to this demand. For instance, in recent years, there has been a surge in the launch of smart air purifiers, which integrate advanced technologies to improve air quality and user experience. In January 2024, Airthings, a leading player in the market, unveiled two new offerings at CES 2024. The Airthings Renew, their first smart air purifier, features a 4-stage HEPA-13 filter and a high-performance carbon filter to enhance air quality and sleep quality.
- The Wave Enhance, a compact, battery-operated indoor air quality monitor, is specifically designed for bedrooms and provides unique sleep condition insights. These new product launches underscore the ongoing evolution of the smart air purifier market and its applications across various sectors.
What are the market trends shaping the Indoor Air Quality (IAQ) Solution Industry?
	- Indoor air quality solutions are experiencing significant technological advances, making them the current market trend.
- In recent years, indoor air pollution has surpassed outdoor pollution levels in homes, schools, offices, and factories, with approximately 90% of the global population spending most of their time indoors. This trend has fueled the demand for indoor air quality (IAQ) solutions from various industries. Technological advancements, such as IoT-based monitoring systems, cyber-physical systems for real-time monitoring, and advanced sensor networks, have facilitated the widespread adoption of IAQ systems. Furthermore, the integration of Industry 4.0 principles in indoor air quality solutions has gained traction due to growing concerns over employee health in manufacturing industries and power plants.
- The market for portable indoor air quality monitors is also experiencing significant growth, offering users the convenience of monitoring air quality levels in real-time. The ongoing technological innovations and increasing awareness of indoor air quality issues are expected to continue driving market expansion.
What challenges does the Indoor Air Quality (IAQ) Solution Industry face during its growth?
	- The intense competition among market companies poses a significant challenge to the growth of the industry. 
- The market faces intense competition, with a fragmented company landscape posing a significant challenge. Numerous regional and international players have entered the market, leading to increased competitiveness that negatively impacts indoor air quality solutions, equipment, and services. Local companies offer affordable alternatives, such as air filters, air purifiers, humidifiers, and other equipment, forcing global companies to match their prices. This price war hinders the market's growth, as companies struggle to maintain profitability and differentiate themselves.
- Despite the competition, the IAQ solution market continues to evolve, with technological advancements and growing awareness of indoor air quality's importance driving market expansion.
Exclusive Customer Landscape
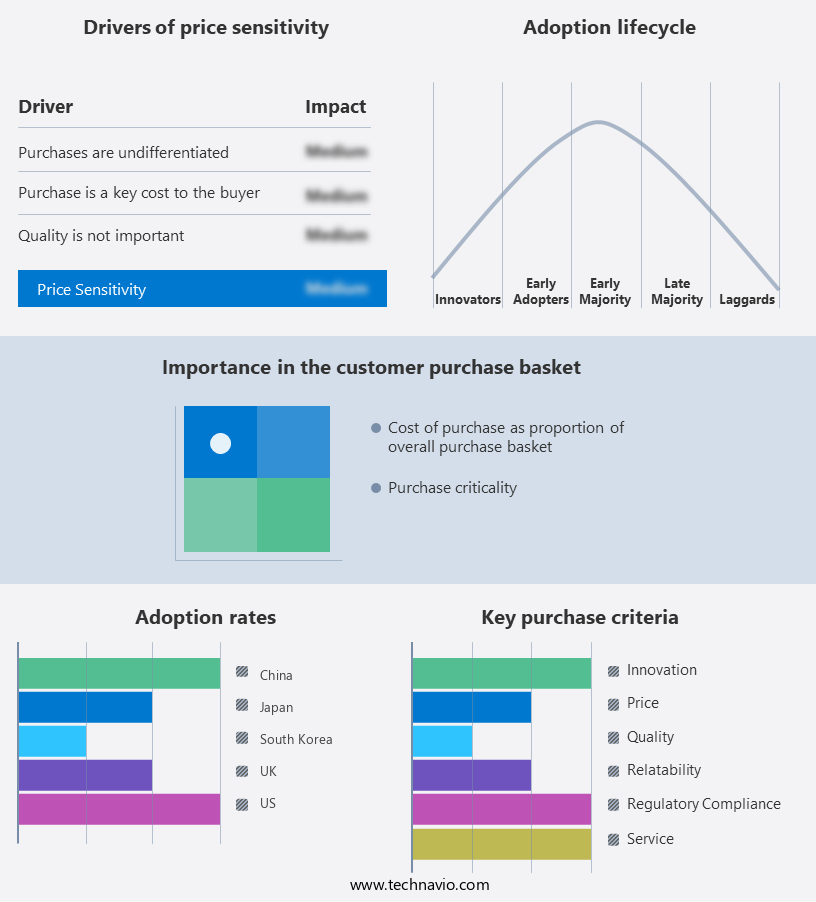
The indoor air quality (iaq) solution market forecasting report includes the adoption lifecycle of the market, covering from the innovator’s stage to the laggard’s stage. It focuses on adoption rates in different regions based on penetration. Furthermore, the indoor air quality (iaq) solution market report also includes key purchase criteria and drivers of price sensitivity to help companies evaluate and develop their market growth analysis strategies.

 Customer Landscape of Indoor Air Quality (IAQ) Solution Industry
Competitive Landscape & Market Insights
Companies are implementing various strategies, such as strategic alliances, indoor air quality (iaq) solution market forecast, partnerships, mergers and acquisitions, geographical expansion, and product/service launches, to enhance their presence in the industry.
3M Co. (United States) - Indoor air quality is a significant concern for many individuals. The company's electrostatically charged air filters effectively capture up to 96% of PM 2.5 particles, including dust, pollen, bacteria, viruses, and allergens, within 2 hours. These filters utilize a static charge to attract and trap particles, providing an efficient solution for improving indoor air quality.
The industry research and growth report includes detailed analyses of the competitive landscape of the market and information about key companies, including:
- 3M Co. (United States)
- Honeywell International Inc. (United States)
- Daikin Industries Ltd. (Japan)
- Panasonic Holdings Corp. (Japan)
- Carrier Global Corp. (United States)
- LG Corp. (South Korea)
- Johnson Controls International Plc (Ireland)
- Aeroqual Ltd. (New Zealand)
- Camfil AB (Sweden)
- MANN HUMMEL International GmbH (Germany)
- Lennox International Inc. (United States)
- Trane Technologies Plc (Ireland)
- Sensirion AG (Switzerland)
- Ferguson plc (United Kingdom)
- Germguard Technologies M Sdn. Bhd. (Malaysia)
- SGS SA (Switzerland)
- Perfect Pollucon Services (India)
- ClimateCare (Canada)
- UL Solutions Inc. (United States)
- Spectro Analytical Labs Pvt. Ltd. (India)
Qualitative and quantitative analysis of companies has been conducted to help clients understand the wider business environment as well as the strengths and weaknesses of key industry players. Data is qualitatively analyzed to categorize companies as pure play, category-focused, industry-focused, and diversified; it is quantitatively analyzed to categorize companies as dominant, leading, strong, tentative, and weak.
Recent Development and News in Indoor Air Quality (IAQ) Solution Market
- In January 2024, Honeywell International Inc. Announced the launch of their new Airflow Solutions business, focusing on Indoor Air Quality (IAQ) technologies and services (Honeywell Press Release). This expansion underscores Honeywell's commitment to the growing IAQ market.
- In March 2024, Carrier Global Corporation and Google entered into a strategic partnership to develop smart, connected IAQ solutions. This collaboration combines Carrier's expertise in HVAC systems and Google's technology to create intelligent indoor environments (Carrier Press Release).
- In April 2025, Daikin Industries Ltd. Completed the acquisition of US-based PureZone Technologies, a leading provider of portable air purifiers. This acquisition strengthens Daikin's position in the residential IAQ market and broadens its product portfolio (Daikin Press Release).
- In May 2025, the European Union passed the new Indoor Air Quality Directive, setting strict standards for IAQ in public and workplaces. The directive aims to reduce health risks associated with poor indoor air quality, driving demand for IAQ solutions in Europe (EU Press Release).
Dive into Technavio’s robust research methodology, blending expert interviews, extensive data synthesis, and validated models for unparalleled Indoor Air Quality (IAQ) Solution Market insights. See full methodology.
	
		
			| Market Scope | 
		
			| Report Coverage | Details | 
		
			| Page number | 203 | 
		
			| Base year | 2024 | 
		
			| Historic period | 2019-2023 | 
		
			| Forecast period | 2025-2029 | 
		
			| Growth momentum & CAGR | Accelerate at a CAGR of 6.9% | 
		
			| Market growth 2025-2029 | USD 13.9 billion | 
		
			| Market structure | Fragmented | 
		
			| YoY growth 2024-2025(%) | 6.3 | 
		
			| Key countries | US, China, UK, Japan, Brazil, Germany, South Korea, Canada, Saudi Arabia, France, and UAE | 
		
			| Competitive landscape | Leading Companies, Market Positioning of Companies, Competitive Strategies, and Industry Risks | 
	
Request Free Sample
Research Analyst Overview
- Indoor Air Quality (IAQ) solutions continue to gain prominence in the smart building automation landscape, as building owners and managers prioritize creating healthier and more energy-efficient structures. IAQ sensors undergo rigorous calibration to ensure accurate readings, while ventilation effectiveness testing evaluates system performance. Building energy modeling and HVAC system efficiency assessments optimize energy usage, reducing operational costs.  Particle filtration efficacy is a critical consideration, with HVAC system upgrades incorporating advanced filtration technologies. Sick Building Syndrome, a common concern, is addressed through regular IAQ system maintenance. Microbial air contamination is mitigated through specialized filtration media selections and humidity control systems.
-  The building commissioning process ensures optimal performance of all systems, including energy recovery ventilation and air purification technology. Airflow distribution modeling and airborne pathogen reduction technologies further enhance indoor environmental control. Integrated IAQ systems monitor carbon dioxide concentration and thermal comfort, providing valuable data for ventilation strategies optimization.  Air purification effectiveness is a key performance indicator, with various technologies offering varying degrees of efficiency. Filtration media selection plays a significant role in overall system performance. The adoption of advanced sensor data analytics facilitates proactive maintenance and continuous improvement, ensuring the highest levels of indoor air quality.
What are the Key Data Covered in this Indoor Air Quality (IAQ) Solution Market Research and Growth Report?
	- 
	What is the expected growth of the Indoor Air Quality (IAQ) Solution Market between 2025 and 2029? 
- 
	What segmentation does the market report cover? 
		- 
		The report segmented by Product (Equipment and Services), Type (Fixed and Portable), Geography (North America, Europe, APAC, South America, and Middle East and Africa), Pollutant Type (Chemical pollutants, Physical pollutants, Biological pollutants, Chemical pollutants, Physical pollutants, and Biological pollutants), Technology (HEPA Filters, UV-C, and IoT-Enabled), and Application (Homes, Offices, and Hospitals) 
 
- 
	Which regions are analyzed in the report? 
		- 
		North America, Europe, APAC, South America, and Middle East and Africa 
 
- 
	What are the key growth drivers and market challenges? 
- 
	Who are the major players in the Indoor Air Quality (IAQ) Solution Market? 
		- 
		Key Companies 3M Co. (United States), Honeywell International Inc. (United States), Daikin Industries Ltd. (Japan), Panasonic Holdings Corp. (Japan), Carrier Global Corp. (United States), LG Corp. (South Korea), Johnson Controls International Plc (Ireland), Aeroqual Ltd. (New Zealand), Camfil AB (Sweden), MANN HUMMEL International GmbH (Germany), Lennox International Inc. (United States), Trane Technologies Plc (Ireland), Sensirion AG (Switzerland), Ferguson plc (United Kingdom), Germguard Technologies M Sdn. Bhd. (Malaysia), SGS SA (Switzerland), Perfect Pollucon Services (India), ClimateCare (Canada), UL Solutions Inc. (United States), and Spectro Analytical Labs Pvt. Ltd. (India) 
 
Market Research Insights
- Indoor Air Quality (IAQ) solutions continue to gain significance in the building industry, with environmental monitoring and airborne particle count being key components. According to industry estimates, the global market for IAQ solutions is projected to reach USD30 billion by 2025, growing at a steady compound annual growth rate of 6%. This growth is driven by the increasing awareness of the health risks associated with poor IAQ and the need for building operation optimization.  Air filtration performance plays a crucial role in IAQ management, with advanced filtration systems capable of removing up to 99.97% of particles as small as 0.3 microns.
- In contrast, traditional filtration systems may only capture larger particles, leaving smaller pollutants to circulate in the air. Effective IAQ management also involves energy conservation methods, such as thermal comfort modeling and HVAC system controls, which can reduce energy consumption by up to 30% while maintaining optimal indoor conditions. IAQ risk mitigation strategies, including ventilation system optimization and air quality data visualization, further enhance the overall effectiveness of these solutions.
We can help! Our analysts can customize this indoor air quality (iaq) solution market research report to meet your requirements. 
Get in touch
                        
          
            1 Executive Summary
- 1.1 Market overview- Executive Summary - Chart on Market Overview
- Executive Summary - Data Table on Market Overview
- Executive Summary - Chart on Global Market Characteristics
- Executive Summary - Chart on Market by Geography
- Executive Summary - Chart on Market Segmentation by Product
- Executive Summary - Chart on Market Segmentation by Type
- Executive Summary - Chart on Incremental Growth
- Executive Summary - Data Table on Incremental Growth
- Executive Summary - Chart on Company Market Positioning
 
2 Technavio Analysis
- 2.1 Analysis of price sensitivity, lifecycle, customer purchase basket, adoption rates, and purchase criteria- Analysis of price sensitivity, lifecycle, customer purchase basket, adoption rates, and purchase criteria
 
- 2.2 Criticality of inputs and Factors of differentiation- Overview on criticality of inputs and factors of differentiation
 
- 2.3 Factors of disruption- Overview on factors of disruption
 
- 2.4 Impact of drivers and challenges- Impact of drivers and challenges in 2024 and 2029
 
3 Market Landscape
- 3.1 Market ecosystem- Parent Market
- Data Table on - Parent Market
 
- 3.2 Market characteristics- Market characteristics analysis
 
4 Market Sizing
- 4.1 Market definition- Offerings of companies included in the market definition
 
- 4.2 Market segment analysis
- 4.4 Market outlook: Forecast for 2024-2029- Chart on Global - Market size and forecast 2024-2029 ($ billion)
- Data Table on Global - Market size and forecast 2024-2029 ($ billion)
- Chart on Global Market: Year-over-year growth 2024-2029 (%)
- Data Table on Global Market: Year-over-year growth 2024-2029 (%)
 
5 Historic Market Size
- 5.1 Global Indoor Air Quality (IAQ) Solution Market 2019 - 2023- Historic Market Size - Data Table on Global Indoor Air Quality (IAQ) Solution Market 2019 - 2023 ($ billion)
 
- 5.2 Product segment analysis 2019 - 2023- Historic Market Size - Product Segment 2019 - 2023 ($ billion)
 
- 5.3 Type segment analysis 2019 - 2023- Historic Market Size - Type Segment 2019 - 2023 ($ billion)
 
- 5.4 Geography segment analysis 2019 - 2023- Historic Market Size - Geography Segment 2019 - 2023 ($ billion)
 
- 5.5 Country segment analysis 2019 - 2023- Historic Market Size - Country Segment 2019 - 2023 ($ billion)
 
6 Qualitative Analysis
- 6.1 The AI impact on Global Indoor Air Quality (IAQ) Solution Market
7 Five Forces Analysis
- 7.1 Five forces summary- Five forces analysis - Comparison between 2024 and 2029
 
- 7.2 Bargaining power of buyers- Bargaining power of buyers - Impact of key factors 2024 and 2029
 
- 7.3 Bargaining power of suppliers- Bargaining power of suppliers - Impact of key factors in 2024 and 2029
 
- 7.4 Threat of new entrants- Threat of new entrants - Impact of key factors in 2024 and 2029
 
- 7.5 Threat of substitutes- Threat of substitutes - Impact of key factors in 2024 and 2029
 
- 7.6 Threat of rivalry- Threat of rivalry - Impact of key factors in 2024 and 2029
 
- 7.7 Market condition- Chart on Market condition - Five forces 2024 and 2029
 
8 Market Segmentation by Product
- 8.1 Market segments- Chart on Product - Market share (2024-2029) (%)
- Data Table on Product - Market share (2024-2029) (%)
 
- 8.2 Comparison by Product- Chart on Comparison by Product
- Data Table on Comparison by Product
 
- 8.3 Equipment - Market size and forecast (2024-2029)- Chart on Equipment - Market size and forecast (2024-2029) ($ billion)
- Data Table on Equipment - Market size and forecast (2024-2029) ($ billion)
- Chart on Equipment - Year-over-year growth (2024-2029) (%)
- Data Table on Equipment - Year-over-year growth (2024-2029) (%)
 
- 8.4 Services - Market size and forecast (2024-2029)- Chart on Services - Market size and forecast (2024-2029) ($ billion)
- Data Table on Services - Market size and forecast (2024-2029) ($ billion)
- Chart on Services - Year-over-year growth (2024-2029) (%)
- Data Table on Services - Year-over-year growth (2024-2029) (%)
 
- 8.5 Market opportunity by Product- Market opportunity by Product ($ billion)
- Data Table on Market opportunity by Product ($ billion)
 
9 Market Segmentation by Type
- 9.1 Market segments- Chart on Type - Market share (2024-2029) (%)
- Data Table on Type - Market share (2024-2029) (%)
 
- 9.2 Comparison by Type- Chart on Comparison by Type
- Data Table on Comparison by Type
 
- 9.3 Fixed - Market size and forecast (2024-2029)- Chart on Fixed - Market size and forecast (2024-2029) ($ billion)
- Data Table on Fixed - Market size and forecast (2024-2029) ($ billion)
- Chart on Fixed - Year-over-year growth (2024-2029) (%)
- Data Table on Fixed - Year-over-year growth (2024-2029) (%)
 
- 9.4 Portable - Market size and forecast (2024-2029)- Chart on Portable - Market size and forecast (2024-2029) ($ billion)
- Data Table on Portable - Market size and forecast (2024-2029) ($ billion)
- Chart on Portable - Year-over-year growth (2024-2029) (%)
- Data Table on Portable - Year-over-year growth (2024-2029) (%)
 
- 9.5 Market opportunity by Type- Market opportunity by Type ($ billion)
- Data Table on Market opportunity by Type ($ billion)
 
10 Market Segmentation by Pollutant Type
- 10.1 Market segments- Chart on Pollutant Type - Market share (2024-2029) (%)
- Data Table on Pollutant Type - Market share (2024-2029) (%)
 
- 10.2 Comparison by Pollutant Type- Chart on Comparison by Pollutant Type
- Data Table on Comparison by Pollutant Type
 
- 10.3 Chemical pollutants - Market size and forecast (2024-2029)- Chart on Chemical pollutants - Market size and forecast (2024-2029) ($ billion)
- Data Table on Chemical pollutants - Market size and forecast (2024-2029) ($ billion)
- Chart on Chemical pollutants - Year-over-year growth (2024-2029) (%)
- Data Table on Chemical pollutants - Year-over-year growth (2024-2029) (%)
 
- 10.4 Physical pollutants - Market size and forecast (2024-2029)- Chart on Physical pollutants - Market size and forecast (2024-2029) ($ billion)
- Data Table on Physical pollutants - Market size and forecast (2024-2029) ($ billion)
- Chart on Physical pollutants - Year-over-year growth (2024-2029) (%)
- Data Table on Physical pollutants - Year-over-year growth (2024-2029) (%)
 
- 10.5 Biological pollutants - Market size and forecast (2024-2029)- Chart on Biological pollutants - Market size and forecast (2024-2029) ($ billion)
- Data Table on Biological pollutants - Market size and forecast (2024-2029) ($ billion)
- Chart on Biological pollutants - Year-over-year growth (2024-2029) (%)
- Data Table on Biological pollutants - Year-over-year growth (2024-2029) (%)
 
- 10.6 Market opportunity by Pollutant Type- Market opportunity by Pollutant Type ($ billion)
- Data Table on Market opportunity by Pollutant Type ($ billion)
 
11 Market Segmentation by Technology
- 11.1 Market segments- Chart on Technology - Market share (2024-2029) (%)
- Data Table on Technology - Market share (2024-2029) (%)
 
- 11.2 Comparison by Technology- Chart on Comparison by Technology
- Data Table on Comparison by Technology
 
- 11.3 HEPA Filters - Market size and forecast (2024-2029)- Chart on HEPA Filters - Market size and forecast (2024-2029) ($ billion)
- Data Table on HEPA Filters - Market size and forecast (2024-2029) ($ billion)
- Chart on HEPA Filters - Year-over-year growth (2024-2029) (%)
- Data Table on HEPA Filters - Year-over-year growth (2024-2029) (%)
 
- 11.4 UV-C - Market size and forecast (2024-2029)- Chart on UV-C - Market size and forecast (2024-2029) ($ billion)
- Data Table on UV-C - Market size and forecast (2024-2029) ($ billion)
- Chart on UV-C - Year-over-year growth (2024-2029) (%)
- Data Table on UV-C - Year-over-year growth (2024-2029) (%)
 
- 11.5 IoT-Enabled - Market size and forecast (2024-2029)- Chart on IoT-Enabled - Market size and forecast (2024-2029) ($ billion)
- Data Table on IoT-Enabled - Market size and forecast (2024-2029) ($ billion)
- Chart on IoT-Enabled - Year-over-year growth (2024-2029) (%)
- Data Table on IoT-Enabled - Year-over-year growth (2024-2029) (%)
 
- 11.6 Market opportunity by Technology- Market opportunity by Technology ($ billion)
- Data Table on Market opportunity by Technology ($ billion)
 
12 Market Segmentation by Application
- 12.1 Market segments- Chart on Application - Market share (2024-2029) (%)
- Data Table on Application - Market share (2024-2029) (%)
 
- 12.2 Comparison by Application- Chart on Comparison by Application
- Data Table on Comparison by Application
 
- 12.3 Homes - Market size and forecast (2024-2029)- Chart on Homes - Market size and forecast (2024-2029) ($ billion)
- Data Table on Homes - Market size and forecast (2024-2029) ($ billion)
- Chart on Homes - Year-over-year growth (2024-2029) (%)
- Data Table on Homes - Year-over-year growth (2024-2029) (%)
 
- 12.4 Offices - Market size and forecast (2024-2029)- Chart on Offices - Market size and forecast (2024-2029) ($ billion)
- Data Table on Offices - Market size and forecast (2024-2029) ($ billion)
- Chart on Offices - Year-over-year growth (2024-2029) (%)
- Data Table on Offices - Year-over-year growth (2024-2029) (%)
 
- 12.5 Hospitals - Market size and forecast (2024-2029)- Chart on Hospitals - Market size and forecast (2024-2029) ($ billion)
- Data Table on Hospitals - Market size and forecast (2024-2029) ($ billion)
- Chart on Hospitals - Year-over-year growth (2024-2029) (%)
- Data Table on Hospitals - Year-over-year growth (2024-2029) (%)
 
- 12.6 Market opportunity by Application- Market opportunity by Application ($ billion)
- Data Table on Market opportunity by Application ($ billion)
 
13 Customer Landscape
- 13.1 Customer landscape overview- Analysis of price sensitivity, lifecycle, customer purchase basket, adoption rates, and purchase criteria
 
14 Geographic Landscape
- 14.1 Geographic segmentation- Chart on Market share by geography 2024-2029 (%)
- Data Table on Market share by geography 2024-2029 (%)
 
- 14.2 Geographic comparison- Chart on Geographic comparison
- Data Table on Geographic comparison
 
- 14.3 North America - Market size and forecast 2024-2029- Chart on North America - Market size and forecast 2024-2029 ($ billion)
- Data Table on North America - Market size and forecast 2024-2029 ($ billion)
- Chart on North America - Year-over-year growth 2024-2029 (%)
- Data Table on North America - Year-over-year growth 2024-2029 (%)
 
- 14.4 Europe - Market size and forecast 2024-2029- Chart on Europe - Market size and forecast 2024-2029 ($ billion)
- Data Table on Europe - Market size and forecast 2024-2029 ($ billion)
- Chart on Europe - Year-over-year growth 2024-2029 (%)
- Data Table on Europe - Year-over-year growth 2024-2029 (%)
 
- 14.5 APAC - Market size and forecast 2024-2029- Chart on APAC - Market size and forecast 2024-2029 ($ billion)
- Data Table on APAC - Market size and forecast 2024-2029 ($ billion)
- Chart on APAC - Year-over-year growth 2024-2029 (%)
- Data Table on APAC - Year-over-year growth 2024-2029 (%)
 
- 14.6 South America - Market size and forecast 2024-2029- Chart on South America - Market size and forecast 2024-2029 ($ billion)
- Data Table on South America - Market size and forecast 2024-2029 ($ billion)
- Chart on South America - Year-over-year growth 2024-2029 (%)
- Data Table on South America - Year-over-year growth 2024-2029 (%)
 
- 14.7 Middle East and Africa - Market size and forecast 2024-2029- Chart on Middle East and Africa - Market size and forecast 2024-2029 ($ billion)
- Data Table on Middle East and Africa - Market size and forecast 2024-2029 ($ billion)
- Chart on Middle East and Africa - Year-over-year growth 2024-2029 (%)
- Data Table on Middle East and Africa - Year-over-year growth 2024-2029 (%)
 
- 14.8 US - Market size and forecast 2024-2029- Chart on US - Market size and forecast 2024-2029 ($ billion)
- Data Table on US - Market size and forecast 2024-2029 ($ billion)
- Chart on US - Year-over-year growth 2024-2029 (%)
- Data Table on US - Year-over-year growth 2024-2029 (%)
 
- 14.9 China - Market size and forecast 2024-2029- Chart on China - Market size and forecast 2024-2029 ($ billion)
- Data Table on China - Market size and forecast 2024-2029 ($ billion)
- Chart on China - Year-over-year growth 2024-2029 (%)
- Data Table on China - Year-over-year growth 2024-2029 (%)
 
- 14.10 UK - Market size and forecast 2024-2029- Chart on UK - Market size and forecast 2024-2029 ($ billion)
- Data Table on UK - Market size and forecast 2024-2029 ($ billion)
- Chart on UK - Year-over-year growth 2024-2029 (%)
- Data Table on UK - Year-over-year growth 2024-2029 (%)
 
- 14.11 Japan - Market size and forecast 2024-2029- Chart on Japan - Market size and forecast 2024-2029 ($ billion)
- Data Table on Japan - Market size and forecast 2024-2029 ($ billion)
- Chart on Japan - Year-over-year growth 2024-2029 (%)
- Data Table on Japan - Year-over-year growth 2024-2029 (%)
 
- 14.12 Brazil - Market size and forecast 2024-2029- Chart on Brazil - Market size and forecast 2024-2029 ($ billion)
- Data Table on Brazil - Market size and forecast 2024-2029 ($ billion)
- Chart on Brazil - Year-over-year growth 2024-2029 (%)
- Data Table on Brazil - Year-over-year growth 2024-2029 (%)
 
- 14.13 Germany - Market size and forecast 2024-2029- Chart on Germany - Market size and forecast 2024-2029 ($ billion)
- Data Table on Germany - Market size and forecast 2024-2029 ($ billion)
- Chart on Germany - Year-over-year growth 2024-2029 (%)
- Data Table on Germany - Year-over-year growth 2024-2029 (%)
 
- 14.14 South Korea - Market size and forecast 2024-2029- Chart on South Korea - Market size and forecast 2024-2029 ($ billion)
- Data Table on South Korea - Market size and forecast 2024-2029 ($ billion)
- Chart on South Korea - Year-over-year growth 2024-2029 (%)
- Data Table on South Korea - Year-over-year growth 2024-2029 (%)
 
- 14.15 Canada - Market size and forecast 2024-2029- Chart on Canada - Market size and forecast 2024-2029 ($ billion)
- Data Table on Canada - Market size and forecast 2024-2029 ($ billion)
- Chart on Canada - Year-over-year growth 2024-2029 (%)
- Data Table on Canada - Year-over-year growth 2024-2029 (%)
 
- 14.16 Saudi Arabia - Market size and forecast 2024-2029- Chart on Saudi Arabia - Market size and forecast 2024-2029 ($ billion)
- Data Table on Saudi Arabia - Market size and forecast 2024-2029 ($ billion)
- Chart on Saudi Arabia - Year-over-year growth 2024-2029 (%)
- Data Table on Saudi Arabia - Year-over-year growth 2024-2029 (%)
 
- 14.17 France - Market size and forecast 2024-2029- Chart on France - Market size and forecast 2024-2029 ($ billion)
- Data Table on France - Market size and forecast 2024-2029 ($ billion)
- Chart on France - Year-over-year growth 2024-2029 (%)
- Data Table on France - Year-over-year growth 2024-2029 (%)
 
- 14.18 Market opportunity by geography- Market opportunity by geography ($ billion)
- Data Tables on Market opportunity by geography ($ billion)
 
- 14.19 UAE - Market size and forecast (2024-2029)- Chart on UAE - Market size and forecast (2024-2029) ($ billion)
- Data Table on UAE - Market size and forecast (2024-2029) ($ billion)
- Chart on UAE - Year-over-year growth (2024-2029) (%)
- Data Table on UAE - Year-over-year growth (2024-2029) (%)
 
- 14.20 Rest of World (ROW) - Market size and forecast (2024-2029)- Chart on Rest of World (ROW) - Market size and forecast (2024-2029) ($ billion)
- Data Table on Rest of World (ROW) - Market size and forecast (2024-2029) ($ billion)
- Chart on Rest of World (ROW) - Year-over-year growth (2024-2029) (%)
- Data Table on Rest of World (ROW) - Year-over-year growth (2024-2029) (%)
 
15 Drivers, Challenges, and Opportunity/Restraints
- 15.3 Impact of drivers and challenges- Impact of drivers and challenges in 2024 and 2029
 
- 15.4 Market opportunities/restraints
16 Competitive Landscape
- 16.2 Competitive Landscape- Overview on criticality of inputs and factors of differentiation
 
- 16.3 Landscape disruption- Overview on factors of disruption
 
- 16.4 Industry risks- Impact of key risks on business
 
17 Competitive Analysis
- 17.2 Market positioning of companies- Matrix on companies position and classification
 
- 3M Co. (United States)- 3M Co. (United States) - Overview
- 3M Co. (United States) - Product / Service
- 3M Co. (United States) - Key offerings
 
- 17.4 Honeywell International Inc. (United States)- Honeywell International Inc. (United States) - Overview
- Honeywell International Inc. (United States) - Product / Service
- Honeywell International Inc. (United States) - Key offerings
 
- 17.5 Daikin Industries Ltd. (Japan)- Daikin Industries Ltd. (Japan) - Overview
- Daikin Industries Ltd. (Japan) - Product / Service
- Daikin Industries Ltd. (Japan) - Key offerings
 
- 17.6 Panasonic Holdings Corp. (Japan)- Panasonic Holdings Corp. (Japan) - Overview
- Panasonic Holdings Corp. (Japan) - Product / Service
- Panasonic Holdings Corp. (Japan) - Key offerings
 
- 17.7 Carrier Global Corp. (United States)- Carrier Global Corp. (United States) - Overview
- Carrier Global Corp. (United States) - Product / Service
- Carrier Global Corp. (United States) - Key offerings
 
- 17.8 LG Corp. (South Korea)- LG Corp. (South Korea) - Overview
- LG Corp. (South Korea) - Product / Service
- LG Corp. (South Korea) - Key offerings
 
- 17.9 Johnson Controls International Plc (Ireland)- Johnson Controls International Plc (Ireland) - Overview
- Johnson Controls International Plc (Ireland) - Product / Service
- Johnson Controls International Plc (Ireland) - Key offerings
 
- 17.10 Aeroqual Ltd. (New Zealand)- Aeroqual Ltd. (New Zealand) - Overview
- Aeroqual Ltd. (New Zealand) - Product / Service
- Aeroqual Ltd. (New Zealand) - Key offerings
 
- 17.11 Camfil AB (Sweden)- Camfil AB (Sweden) - Overview
- Camfil AB (Sweden) - Product / Service
- Camfil AB (Sweden) - Key offerings
 
- 17.12 MANN HUMMEL International GmbH (Germany)- MANN HUMMEL International GmbH (Germany) - Overview
- MANN HUMMEL International GmbH (Germany) - Product / Service
- MANN HUMMEL International GmbH (Germany) - Key offerings
 
- 17.13 Lennox International Inc. (United States)- Lennox International Inc. (United States) - Overview
- Lennox International Inc. (United States) - Product / Service
- Lennox International Inc. (United States) - Key offerings
 
- 17.14 Trane Technologies Plc (Ireland)- Trane Technologies Plc (Ireland) - Overview
- Trane Technologies Plc (Ireland) - Product / Service
- Trane Technologies Plc (Ireland) - Key offerings
 
- 17.15 Sensirion AG (Switzerland)- Sensirion AG (Switzerland) - Overview
- Sensirion AG (Switzerland) - Product / Service
- Sensirion AG (Switzerland) - Key offerings
 
- 17.16 Ferguson plc (United Kingdom)- Ferguson plc (United Kingdom) - Overview
- Ferguson plc (United Kingdom) - Product / Service
- Ferguson plc (United Kingdom) - Key offerings
 
- 17.17 Germguard Technologies M Sdn. Bhd. (Malaysia)- Germguard Technologies M Sdn. Bhd. (Malaysia) - Overview
- Germguard Technologies M Sdn. Bhd. (Malaysia) - Product / Service
- Germguard Technologies M Sdn. Bhd. (Malaysia) - Key offerings
 
- 17.18 SGS SA (Switzerland)- SGS SA (Switzerland) - Overview
- SGS SA (Switzerland) - Product / Service
- SGS SA (Switzerland) - Key offerings
 
- 17.19 Perfect Pollucon Services (India)- Perfect Pollucon Services (India) - Overview
- Perfect Pollucon Services (India) - Product / Service
- Perfect Pollucon Services (India) - Key offerings
 
- 17.20 ClimateCare (Canada)- ClimateCare (Canada) - Overview
- ClimateCare (Canada) - Product / Service
- ClimateCare (Canada) - Key offerings
 
- 17.21 UL Solutions Inc. (United States)- UL Solutions Inc. (United States) - Overview
- UL Solutions Inc. (United States) - Product / Service
- UL Solutions Inc. (United States) - Key offerings
 
- 17.22 Spectro Analytical Labs Pvt. Ltd. (India)- Spectro Analytical Labs Pvt. Ltd. (India) - Overview
- Spectro Analytical Labs Pvt. Ltd. (India) - Product / Service
- Spectro Analytical Labs Pvt. Ltd. (India) - Key offerings
 
- 3M Co.- 3M Co. - Overview
- 3M Co. - Product / Service
- 3M Co. - Key offerings
 
- 17.24 Aeroqual Ltd.- Aeroqual Ltd. - Overview
- Aeroqual Ltd. - Product / Service
- Aeroqual Ltd. - Key offerings
 
- 17.25 Camfil AB- Camfil AB - Overview
- Camfil AB - Product / Service
- Camfil AB - Key offerings
 
- 17.26 Carrier Global Corp.- Carrier Global Corp. - Overview
- Carrier Global Corp. - Product / Service
- Carrier Global Corp. - Key offerings
 
- 17.27 ClimateCare- ClimateCare - Overview
- ClimateCare - Product / Service
- ClimateCare - Key offerings
 
- 17.28 Daikin Industries Ltd.- Daikin Industries Ltd. - Overview
- Daikin Industries Ltd. - Product / Service
- Daikin Industries Ltd. - Key offerings
 
- 17.29 Ferguson plc- Ferguson plc - Overview
- Ferguson plc - Product / Service
- Ferguson plc - Key offerings
 
- 17.30 Germguard Technologies M Sdn. Bhd.- Germguard Technologies M Sdn. Bhd. - Overview
- Germguard Technologies M Sdn. Bhd. - Product / Service
- Germguard Technologies M Sdn. Bhd. - Key offerings
 
- 17.31 Honeywell International Inc.- Honeywell International Inc. - Overview
- Honeywell International Inc. - Product / Service
- Honeywell International Inc. - Key offerings
 
- 17.32 Johnson Controls International Plc- Johnson Controls International Plc - Overview
- Johnson Controls International Plc - Product / Service
- Johnson Controls International Plc - Key offerings
 
- 17.33 Lennox International Inc.- Lennox International Inc. - Overview
- Lennox International Inc. - Product / Service
- Lennox International Inc. - Key offerings
 
- 17.34 LG Corp.- LG Corp. - Overview
- LG Corp. - Product / Service
- LG Corp. - Key offerings
 
- 17.35 MANN HUMMEL International GmbH and Co. KG- MANN HUMMEL International GmbH and Co. KG - Overview
- MANN HUMMEL International GmbH and Co. KG - Product / Service
- MANN HUMMEL International GmbH and Co. KG - Key offerings
 
- 17.36 Panasonic Holdings Corp.- Panasonic Holdings Corp. - Overview
- Panasonic Holdings Corp. - Product / Service
- Panasonic Holdings Corp. - Key offerings
 
- 17.37 Perfect Pollucon Services- Perfect Pollucon Services - Overview
- Perfect Pollucon Services - Product / Service
- Perfect Pollucon Services - Key offerings
 
- 17.38 Sensirion AG- Sensirion AG - Overview
- Sensirion AG - Product / Service
- Sensirion AG - Key offerings
 
- 17.39 SGS SA- SGS SA - Overview
- SGS SA - Product / Service
- SGS SA - Key offerings
 
- 17.40 Spectro Analytical Labs Pvt. Ltd.- Spectro Analytical Labs Pvt. Ltd. - Overview
- Spectro Analytical Labs Pvt. Ltd. - Product / Service
- Spectro Analytical Labs Pvt. Ltd. - Key offerings
 
- 17.41 Trane Technologies Plc- Trane Technologies Plc - Overview
- Trane Technologies Plc - Product / Service
- Trane Technologies Plc - Key offerings
 
- 17.42 UL Solutions Inc.- UL Solutions Inc. - Overview
- UL Solutions Inc. - Product / Service
- UL Solutions Inc. - Key offerings
 
18 Appendix
- 18.2 Inclusions and exclusions checklist- Inclusions checklist
- Exclusions checklist
 
- 18.3 Currency conversion rates for US$- Currency conversion rates for US$
 
- 18.4 Research methodology
- 18.7 Validation techniques employed for market sizing- Validation techniques employed for market sizing
 
- 18.9 360 degree market analysis- 360 degree market analysis
 
- 18.10 List of abbreviations