Air Purifier Market Size 2026-2030
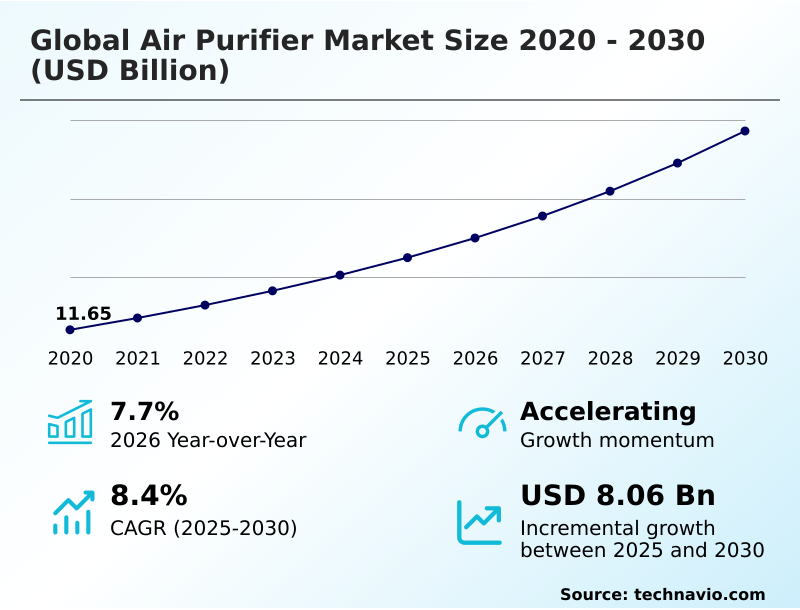
The air purifier market size is valued to increase by USD 8.06 billion, at a CAGR of 8.4% from 2025 to 2030. Increasing awareness of indoor air quality and health concerns will drive the air purifier market.
Major Market Trends & Insights
- APAC dominated the market and accounted for a 37.8% growth during the forecast period.
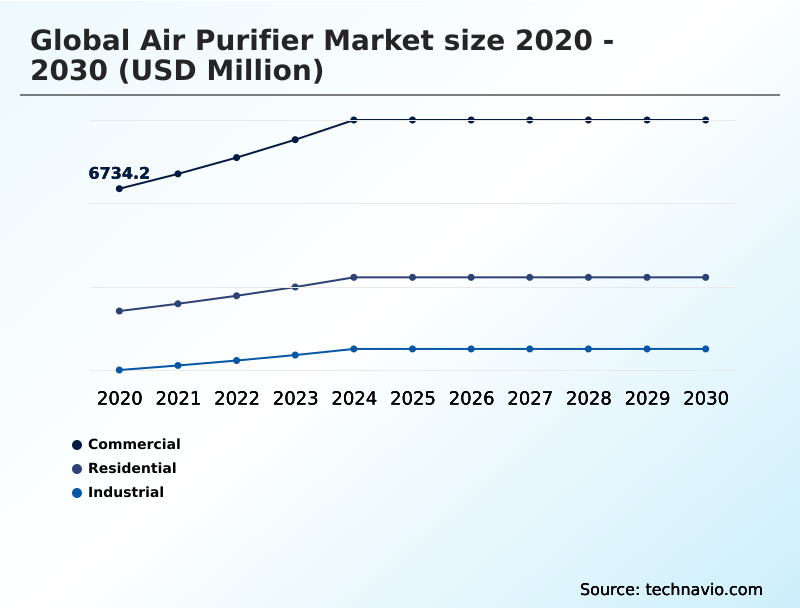
- By Application - Commercial segment was valued at USD 8.67 billion in 2024
- By Technology - HEPA segment accounted for the largest market revenue share in 2024
Market Size & Forecast
- Market Opportunities: USD 12.65 billion
- Market Future Opportunities: USD 8.06 billion
- CAGR from 2025 to 2030 : 8.4%
Market Summary
- The air purifier market is defined by a growing emphasis on health and well-being, translating into demand for more sophisticated filtration technologies.
- Systems are moving beyond basic particle capture, incorporating multi-stage filtration that combines HEPA filtration with activated carbon layers and sometimes UV light purification to neutralize a broader spectrum of indoor contaminants, including fine particulate matter (PM2.5), volatile organic compounds (VOCs), and airborne pathogens.
- In a typical commercial building scenario, smart air quality monitoring systems use integrated particulate matter sensors to continuously track indoor air quality (IAQ) and automatically adjust fan speeds. This approach not only ensures a healthier environment for occupants, which can improve productivity, but also enhances energy efficiency by running the units at optimal levels, thus balancing operational costs with performance.
- This evolution highlights a shift from standalone devices to integrated components of a comprehensive building management and wellness strategy, addressing everything from allergen removal to odor control. The market's trajectory is toward creating healthier indoor ecosystems through advanced, responsive technology.
What will be the Size of the Air Purifier Market during the forecast period?
Get Key Insights on Market Forecast (PDF) Get Free Sample
How is the Air Purifier Market Segmented?
The air purifier industry research report provides comprehensive data (region-wise segment analysis), with forecasts and estimates in "USD million" for the period 2026-2030, as well as historical data from 2020-2024 for the following segments.
- Application
- Commercial
- Residential
- Industrial
- Technology
- HEPA
- Electrostatic precipitators
- Ionizers and ozone generators
- Others
- Distribution channel
- Offline channel
- Online channel
- Geography
- APAC
- China
- Japan
- India
- North America
- US
- Canada
- Mexico
- Europe
- Germany
- UK
- France
- South America
- Brazil
- Argentina
- Colombia
- Middle East and Africa
- UAE
- Saudi Arabia
- South Africa
- Rest of World (ROW)
- APAC
By Application Insights
The commercial segment is estimated to witness significant growth during the forecast period.
Commercial application of air purification systems is expanding, driven by a focus on employee well-being and productivity. These environments require robust industrial air filtration and commercial air purification solutions capable of managing high-density occupancy.
Advanced systems often feature multi-stage filtration, combining HEPA filtration with activated carbon filtration to address both particulate matter and VOCs. The integration of smart air quality monitoring allows for real-time adjustments, optimizing performance.
This segment, which contributes nearly 38% of market growth, prioritizes high CADR (Clean Air Delivery Rate) and low-noise air purifier models to maintain a conducive atmosphere in offices, healthcare, and hospitality, reflecting a shift towards proactive indoor environmental management and airborne virus protection.
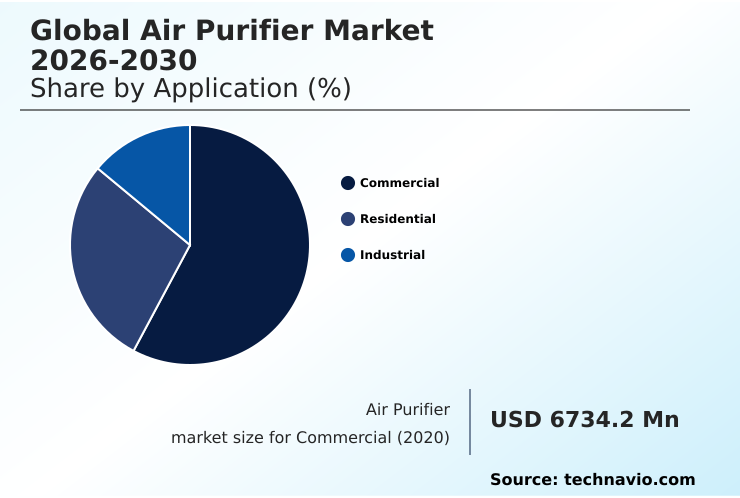
The Commercial segment was valued at USD 8.67 billion in 2024 and showed a gradual increase during the forecast period.
Regional Analysis
APAC is estimated to contribute 37.8% to the growth of the global market during the forecast period.Technavio’s analysts have elaborately explained the regional trends and drivers that shape the market during the forecast period.
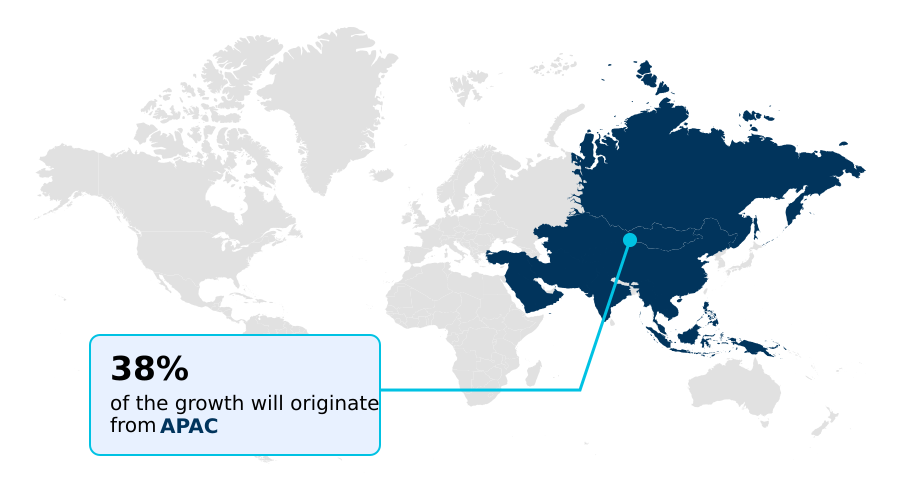
See How Air Purifier Market Demand is Rising in APAC Get Free Sample
The market's geographic distribution is led by APAC, which accounts for 37.8% of incremental growth, driven by urbanization and significant air quality challenges.
North America follows, contributing 34.51% of the expansion, with demand intensified by events like wildfires and a strong focus on health and wellness. This has led to widespread adoption of wildfire smoke filtration and allergen removal systems in residential settings.
In Europe, stringent regulations and a focus on energy efficiency guide the market.
Commercial installations in the region have demonstrated tangible benefits, with some businesses reporting up to a 15% reduction in employee sick days after upgrading their indoor air quality (IAQ) systems.
This data underscores the dual benefit of regulatory compliance and improved operational health, making commercial air purification a strategic investment.
Market Dynamics
Our researchers analyzed the data with 2025 as the base year, along with the key drivers, trends, and challenges. A holistic analysis of drivers will help companies refine their marketing strategies to gain a competitive advantage.
- Consumer and commercial purchasing decisions in the Global Air Purifier Market 2026-2030 are becoming increasingly nuanced. Buyers evaluating HEPA filter performance for allergies are now cross-referencing this with smart air purifier energy consumption to manage long-term operational costs.
- For businesses, achieving commercial air filtration system compliance is a primary objective, which contrasts with the individual's search for the best portable air purifier for travel. A deeper understanding of specific technologies, such as the effectiveness of activated carbon for VOC removal, is now critical for both residential and industrial use cases.
- The Global Air Purifier Market 2026-2030's competitive landscape shows how vendors are differentiating offerings. While one focuses on industrial settings, another may target residential use cases with advanced features.
- For example, some specialized systems for commercial use can double the initial investment compared to standard residential units but can reduce long-term maintenance costs by over 40% through more durable, washable pre-filters and longer-lasting main filters. This technology comparison highlights the market's segmentation and the varied requirements across different applications.
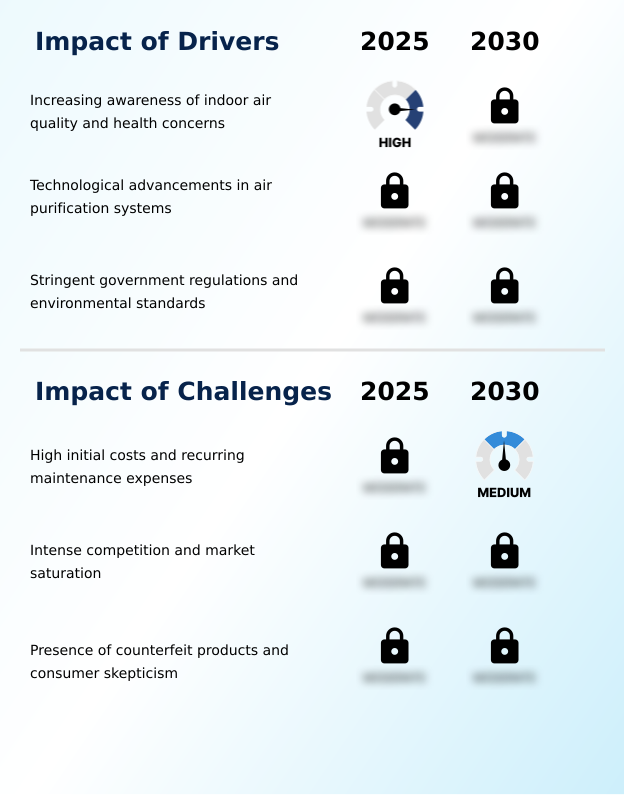
What are the key market drivers leading to the rise in the adoption of Air Purifier Industry?
- The primary market driver is the increasing consumer awareness regarding the impact of indoor air quality on overall health and well-being.
- Market growth is significantly driven by heightened public awareness of indoor air quality (IAQ) and its link to health.
- This has spurred demand for effective allergen removal systems, especially in households with pets, leading to the development of specialized pet dander air cleaners. Technological advancements are another key driver, with features like smart air quality monitoring becoming standard.
- The integration of whole-home air purification systems with smart home platforms has improved efficiency by up to 20% through automated adjustments based on real-time data.
- Furthermore, government regulations mandating cleaner indoor environments in commercial spaces and offering incentives for energy-efficient appliances continue to bolster adoption across various sectors.
What are the market trends shaping the Air Purifier Industry?
- A key market trend is the integration of smart features and connectivity in air purifiers. This shift enhances user control and enables automated, real-time air quality management.
- Key trends shaping the market include the rise of portable and compact air purifier models, which address the need for flexible, space-efficient solutions in urban homes and offices. This aligns with the growing demand for personal air purification, including wearable and automotive variants that offer on-the-go airborne virus protection.
- Simultaneously, sustainability is becoming a competitive differentiator, with a focus on eco-friendly air cleaners and sustainable air purifier designs. Manufacturers are developing energy-efficient air purifiers with washable pre-filters and recyclable components. These trends are supported by operational gains, as some new sustainable models reduce energy use by over 15% compared to older counterparts, directly lowering household and commercial operating costs.
What challenges does the Air Purifier Industry face during its growth?
- High initial costs and recurring maintenance expenses present a key challenge, potentially limiting widespread market adoption and affecting industry growth.
- High initial costs and recurring maintenance, particularly for filter replacements, remain a primary challenge, limiting adoption among price-sensitive consumers. This is compounded by intense competition, which leads to price pressures and makes product differentiation difficult, especially with core technologies like HEPA filtration becoming commoditized.
- The market also contends with the presence of counterfeit products, which erodes consumer trust and creates skepticism about performance claims. This issue is particularly prevalent in online channels, where unverified products can mislead buyers.
- In response, legitimate manufacturers are investing in authentication measures and transparent testing, which can increase compliance-related costs by 5-10% but are crucial for maintaining brand integrity and consumer confidence.
Exclusive Technavio Analysis on Customer Landscape
The air purifier market forecasting report includes the adoption lifecycle of the market, covering from the innovator’s stage to the laggard’s stage. It focuses on adoption rates in different regions based on penetration. Furthermore, the air purifier market report also includes key purchase criteria and drivers of price sensitivity to help companies evaluate and develop their market growth analysis strategies.
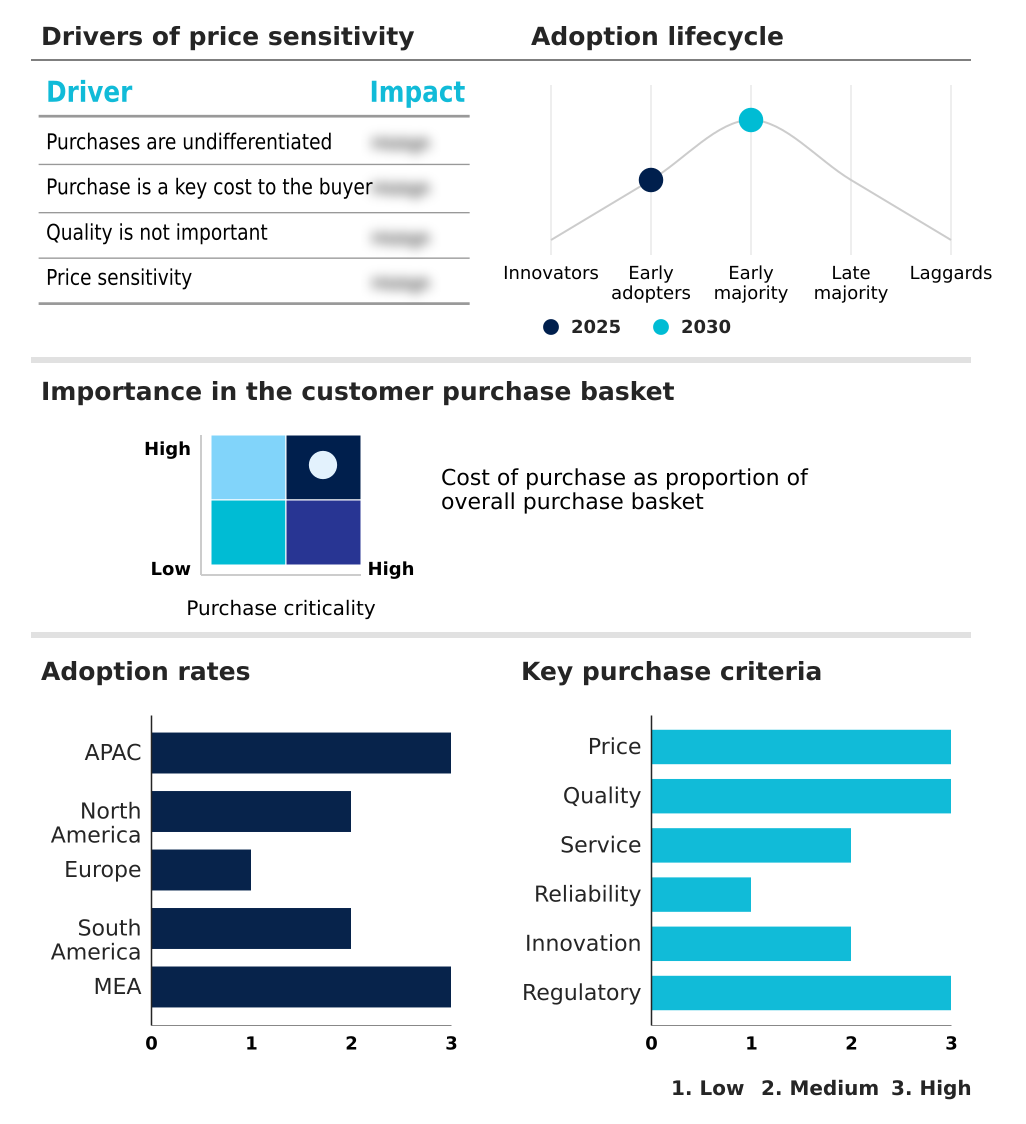
Customer Landscape of Air Purifier Industry
Competitive Landscape
Companies are implementing various strategies, such as strategic alliances, air purifier market forecast, partnerships, mergers and acquisitions, geographical expansion, and product/service launches, to enhance their presence in the industry.
3M Co. - The company offers air purification systems for residential, commercial, and industrial settings, focusing on high-efficiency particulate air filtration to improve indoor air quality.
The industry research and growth report includes detailed analyses of the competitive landscape of the market and information about key companies, including:
- 3M Co.
- AllerAir Industries Inc.
- Americair Corp.
- Austin Air
- Blue Star Ltd.
- Breville Group Ltd.
- Camfil AB
- Daikin Industries Ltd.
- Dyson Group Co.
- Eureka Forbes Ltd.
- Hamilton Beach Brands Holding Co.
- Havells India Ltd.
- Honeywell International Inc.
- IQAir AG
- Koninklijke Philips NV
- LG Electronics Inc.
- Midea Group Co. Ltd.
- Panasonic Holdings Corp.
- Samsung Electronics Co. Ltd.
- Whirlpool Corp.
Qualitative and quantitative analysis of companies has been conducted to help clients understand the wider business environment as well as the strengths and weaknesses of key industry players. Data is qualitatively analyzed to categorize companies as pure play, category-focused, industry-focused, and diversified; it is quantitatively analyzed to categorize companies as dominant, leading, strong, tentative, and weak.
Recent Development and News in Air purifier market
- In November 2024, Dyson introduced the Purifier Hot plus Cool Gen1, a multi-functional device combining air purification with heating and cooling to enhance indoor comfort and health.
- In January 2025, Levoit unveiled a pet-specific portable air purifier at CES 2025, featuring motion sensing and targeted odor capture for on-the-go use in compact spaces.
- In February 2025, Camfil launched the Opakfil ES plus, a V-Bank filter designed for sustainable HVAC integration with an emphasis on longer lifespan and reduced environmental impact in commercial settings.
- In April 2025, Ideal Living advanced its AirDoctor line with a focus on toxin-free purification to meet emerging regulatory demands for safer indoor air quality.
Dive into Technavio’s robust research methodology, blending expert interviews, extensive data synthesis, and validated models for unparalleled Air Purifier Market insights. See full methodology.
| Market Scope | |
|---|---|
| Page number | 303 |
| Base year | 2025 |
| Historic period | 2020-2024 |
| Forecast period | 2026-2030 |
| Growth momentum & CAGR | Accelerate at a CAGR of 8.4% |
| Market growth 2026-2030 | USD 8060.2 million |
| Market structure | Fragmented |
| YoY growth 2025-2026(%) | 7.7% |
| Key countries | China, Japan, India, South Korea, Australia, Indonesia, US, Canada, Mexico, Germany, UK, France, Italy, Spain, The Netherlands, Brazil, Argentina, Colombia, UAE, Saudi Arabia, South Africa, Egypt and Nigeria |
| Competitive landscape | Leading Companies, Market Positioning of Companies, Competitive Strategies, and Industry Risks |
Research Analyst Overview
- The air purifier market is evolving from a product-centric model to an integrated service ecosystem, driven by advancements in filtration technology and connectivity. Core technologies like HEPA filtration and activated carbon filtration are now table stakes; differentiation lies in the application of submicron particle capture, advanced airflow engineering, and multi-stage filtration systems.
- The integration of a particulate matter sensor for real-time air quality sensing is standard in mid-to-premium models, enabling smart air quality monitoring. A key trend shaping boardroom strategy is sustainability, where the adoption of systems with washable pre-filters and eco-friendly filter materials directly impacts operational budgets and corporate responsibility goals.
- For instance, choosing energy-efficient models with a longer filter lifespan can reduce a building's related operational expenditure by up to 20% annually. This shift pressures manufacturers to innovate beyond simple toxin-free purification, focusing on the total cost of ownership and environmental impact, incorporating technologies like V-Bank filter design and molecular filtration to meet both performance and sustainability benchmarks.
What are the Key Data Covered in this Air Purifier Market Research and Growth Report?
-
What is the expected growth of the Air Purifier Market between 2026 and 2030?
-
USD 8.06 billion, at a CAGR of 8.4%
-
-
What segmentation does the market report cover?
-
The report is segmented by Application (Commercial, Residential, and Industrial), Technology (HEPA, Electrostatic precipitators, Ionizers and ozone generators, and Others), Distribution Channel (Offline channel, and Online channel) and Geography (APAC, North America, Europe, South America, Middle East and Africa)
-
-
Which regions are analyzed in the report?
-
APAC, North America, Europe, South America and Middle East and Africa
-
-
What are the key growth drivers and market challenges?
-
Increasing awareness of indoor air quality and health concerns, High initial costs and recurring maintenance expenses
-
-
Who are the major players in the Air Purifier Market?
-
3M Co., AllerAir Industries Inc., Americair Corp., Austin Air, Blue Star Ltd., Breville Group Ltd., Camfil AB, Daikin Industries Ltd., Dyson Group Co., Eureka Forbes Ltd., Hamilton Beach Brands Holding Co., Havells India Ltd., Honeywell International Inc., IQAir AG, Koninklijke Philips NV, LG Electronics Inc., Midea Group Co. Ltd., Panasonic Holdings Corp., Samsung Electronics Co. Ltd. and Whirlpool Corp.
-
Market Research Insights
- The market is characterized by a dynamic interplay of innovation and evolving consumer expectations. Adoption of smart home air purifiers is rising, with app-controlled devices offering convenience and real-time data, which improves user engagement by over 25% compared to non-connected models.
- While residential air quality remains a primary focus, the demand for commercial air purification solutions is growing, with businesses investing in systems that enhance indoor air quality (IAQ) and demonstrate a commitment to employee health. This investment often yields a positive return, with some companies reporting a 10-15% reduction in employee absenteeism due to fewer respiratory issues.
- The emphasis on allergen removal systems and wildfire smoke filtration continues to drive sales in specific regions, while the desire for low-noise air purifiers shapes product development across the board.
We can help! Our analysts can customize this air purifier market research report to meet your requirements.
 RIA -
RIA - 
