Airport Kiosk Market Analysis North America, Europe, APAC, Middle East and Africa, South America - US, China, UK, Germany, United Arab Emirates - Size and Forecast 2024-2028

Airport Kiosk Market Analysis North America, Europe, APAC, Middle East and Africa, South America - US, China, UK, Germany, United Arab Emirates - Size and Forecast 2024-2028

Published: Jul 2024 180 Pages SKU: IRTNTR72329

Market Overview at a Glance

$1.63 B
Market Opportunity
10.87%
CAGR
9.53
YoY growth 2023-2024(%)

Airport Kiosk Market Size 2024-2028

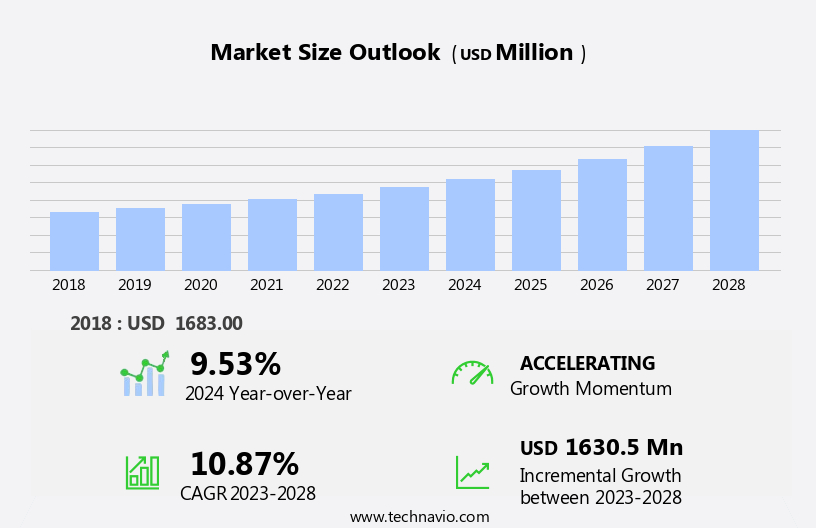
The airport kiosk market size is forecast to increase by USD 1.63 billion, at a CAGR of 10.87% between 2023 and 2028.

  • The market is experiencing significant growth, driven by the increasing passenger travel numbers worldwide. This trend is fueled by the convenience and efficiency offered by self-service kiosks, which cater to various airport operations such as check-in, baggage drop, and boarding pass issuance. Furthermore, the digitization of airport operations is a key trend shaping the market, as airports seek to enhance the passenger experience and streamline processes. However, challenges persist in the form of insufficient infrastructure and connectivity issues, which hinder the widespread adoption of airport kiosks, particularly in developing regions. To capitalize on market opportunities, companies must focus on addressing these challenges by investing in advanced technologies and collaborating with airport authorities to improve infrastructure.
  • Additionally, offering customizable and user-friendly solutions tailored to specific airport needs can help differentiate offerings and secure market share. Overall, the market presents a promising landscape for innovation and growth, with potential for significant impact on airport operations and passenger experience.

What will be the Size of the Airport Kiosk Market during the forecast period?

Airport Kiosk Market Size

Explore in-depth regional segment analysis with market size data - historical 2018-2022 and forecasts 2024-2028 - in the full report.  
Request Free Sample

The market continues to evolve, with dynamic market dynamics shaping its applications across various sectors. Real-time data and historical transaction volume are crucial performance metrics for these systems, which are integrated into passenger information systems. Modular design and software updates ensure compliance with evolving industry standards, while cloud-based solutions offer flexibility and scalability. Kiosks are equipped with predictive analytics, enabling proactive maintenance scheduling and network connectivity for remote monitoring. Self-service kiosks streamline check-in processes, offering customization options and user-friendly interfaces. RFID readers and thermal printers facilitate baggage tagging and boarding pass printing. Integration of loyalty programs, digital signage, and third-party APIs enhances the user experience.

Flight information displays and queue management systems provide real-time updates, while data visualization tools offer valuable insights. Data Security measures, such as data encryption and camera systems, ensure customer trust. Airport kiosk hardware and software are subject to ongoing upgrades and licensing agreements, with warranty support and user experience being key considerations. Compliance with regulatory standards and accessibility features are essential for inclusive design. Biometric authentication and mobile ticketing integration offer added convenience, while reporting tools and customer support ensure operational efficiency.

How is this Airport Kiosk Industry segmented?

The airport kiosk industry research report provides comprehensive data (region-wise segment analysis), with forecasts and estimates in "USD million" for the period 2024-2028, as well as historical data from 2018-2022 for the following segments.

  • Technology
    • Hardware
    • Software
    • Services
  • Type
    • Check-in Kiosk
    • Automated passport control
    • Common-use self service
    • Bag drop
    • Others
  • Geography
    • North America
      • US
    • Europe
      • Germany
      • UK
    • APAC
      • China
    • Rest of World (ROW)

By Technology Insights

The hardware segment is estimated to witness significant growth during the forecast period.

The self-service market is experiencing growth due to the increasing preference for contactless solutions and the surge in passenger traffic. These kiosks, comprised of both hardware and software components, facilitate various functions such as check-in, baggage tagging, and boarding pass printing. The hardware, including the kiosk unit, touchscreen display, and external devices, is designed to be visually appealing, durable, scalable, and low maintenance. Software features encompass real-time data processing, predictive analytics, and passenger information systems, ensuring a seamless user experience. Compliance with regulatory standards, data security, and accessibility are essential considerations. The market also offers cloud-based solutions, enabling remote monitoring, software updates, and network connectivity.

Other features include loyalty program integration, customization options, and queue management systems. The industry's evolution is driven by the integration of advanced technologies like biometric authentication, RFID readers, and thermal printers. Additionally, the adoption of modular designs, performance metrics, and reporting tools supports efficient maintenance scheduling and hardware upgrades.

Airport Kiosk Market Size

Request Free Sample

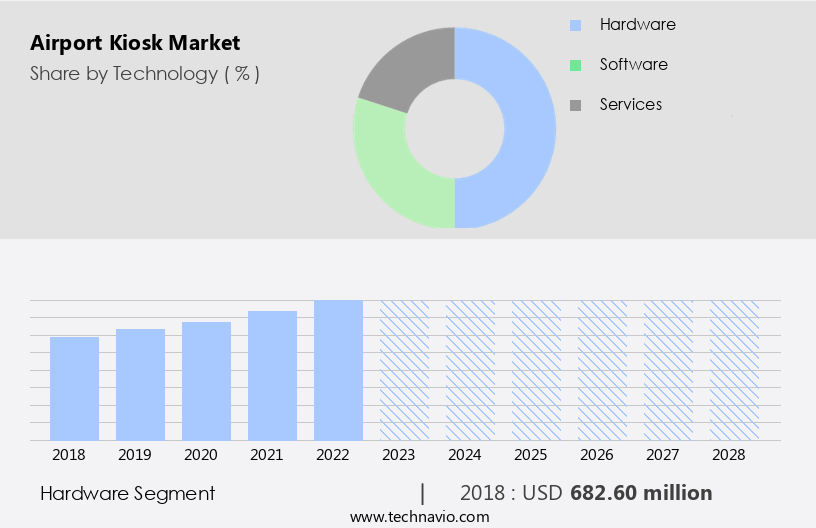
The Hardware segment was valued at USD 682.60 billion in 2018 and showed a gradual increase during the forecast period.

Regional Analysis

North America is estimated to contribute 48% to the growth of the global market during the forecast period. Technavio's analysts have elaborately explained the regional trends and drivers that shape the market during the forecast period.

Airport Kiosk Market Share by Geography

 Request Free Sample

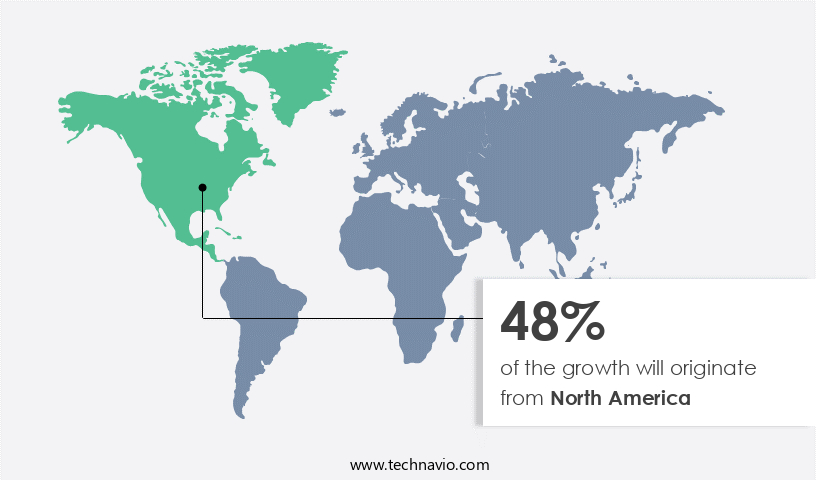
In North America, the market holds a substantial share due to early technology adoption and a strong preference for personalized services. Airports in the region utilize kiosks for marketing campaigns, enhancing consumer engagement, and branding initiatives. However, the market faced challenges in 2020 and H1 2021 as various sectors, including travel and tourism, financial services, healthcare, and others, partially suspended their operations due to the COVID-19 pandemic. Remote monitoring and historical data analysis enable airport kiosks to optimize performance and maintenance scheduling. On-premise solutions and cloud-based alternatives cater to diverse client needs. Passenger information systems and real-time data facilitate seamless travel experiences.

Barcode scanners, RFID readers, and biometric authentication ensure efficiency and security. Software licensing and hardware upgrades keep the kiosks updated with the latest features. Network connectivity and system integration ensure seamless data exchange between different airport systems. Customization options and user interface designs cater to passenger preferences. Loyalty program integration, reporting tools, and customer support enhance the user experience. Compliance standards ensure data security and privacy. Predictive analytics and queue management systems optimize operations and reduce wait times. Airport kiosks offer various functionalities, such as baggage tagging, flight information display, mobile ticketing integration, boarding pass printing, and self-service check-in.

Interactive maps, digital signage, and advertising integration provide wayfinding assistance and revenue opportunities. Power supply and user experience considerations ensure reliable and efficient kiosk performance. Kiosk hardware and software solutions work together to offer a comprehensive airport experience. Help desks and touchscreen displays facilitate user assistance. Thermal printers and reporting tools provide essential information to passengers. Data encryption and camera systems ensure data security and safety. Service level agreements and warranty support ensure reliable kiosk performance and maintenance. Performance metrics and regulatory compliance enable continuous improvement and adherence to industry standards. Accessibility features cater to diverse passenger needs.

Market Dynamics

Our researchers analyzed the data with 2023 as the base year, along with the key drivers, trends, and challenges. A holistic analysis of drivers will help companies refine their marketing strategies to gain a competitive advantage.

What are the key market drivers leading to the rise in the adoption of Airport Kiosk Industry?

  • The significant growth in passenger travel is the primary factor fueling market expansion. 
  • Airport kiosks have become an essential component of modern air travel, enabling faster and more efficient passenger processing at immigration checkpoints. Over 40 airports in the US, including Hartsfield-Jackson Atlanta International Airport, Los Angeles International Airport (LAX), Chicago O'Hare International Airport (ORD), and Dallas/Fort Worth International Airport (DFW), have already implemented these systems. The market for airport kiosks is expanding due to the integration of advanced biometric technology, which significantly reduces passenger wait times and enhances customs and border control procedures. Airport kiosks offer real-time data processing, remote monitoring, and maintenance scheduling capabilities, ensuring seamless operations. These systems utilize on-premise solutions and passenger information systems, which can be integrated with loyalty programs to enhance the customer experience.
  • Barcode scanners and data visualization tools enable quick and accurate data collection and analysis, while software licensing and hardware upgrades ensure the systems remain up-to-date. Network connectivity and kiosk design are crucial factors in the success of airport kiosks. These systems must be designed to be immersive, harmonious, and user-friendly, emphasizing ease of use and customer satisfaction. With the increasing demand for automated immigration procedures, airport kiosks are poised for strong growth in the future.

What are the market trends shaping the Airport Kiosk Industry?

  • The digitization of operations is an essential trend in today's market. Professionals are increasingly embracing digital solutions to streamline and optimize their business processes.
  • Airport kiosks have become an integral part of modern air travel, streamlining various operations and enhancing the passenger experience. These self-service units offer performance metrics that ensure efficiency and accuracy in tasks such as check-in, boarding pass printing, baggage tagging, and flight information display. Their modular design allows for software updates and compliance with industry standards, ensuring the technology remains current and secure. Cloud-based solutions enable real-time data access and predictive analytics, providing valuable insights for airport management. System integration with digital signage and RFID readers further enhances functionality, creating a seamless and immersive user experience.
  • Customization options cater to individual traveler needs, while user-friendly interfaces simplify complex processes. Warranty support ensures uninterrupted service, making airport kiosks a valuable investment for airports aiming to optimize operations and improve safety.

What challenges does the Airport Kiosk Industry face during its growth?

  • The absence of adequate infrastructure and connectivity poses a significant challenge to the industry's growth trajectory. 
  • Airport kiosks have become an essential component of modern travel experiences, offering convenience and efficiency to passengers. These self-service information terminals require thermal printers, reporting tools, and customer support to ensure seamless operation. Payment processing is also a crucial feature, enabling contactless transactions and enhancing the user experience. Airport kiosk hardware integrates third-party APIs for enhanced functionality, such as data security, queue management systems, data analytics, and interactive maps. Advertising integration is another essential aspect, providing opportunities for revenue generation. Kiosk software and help desks facilitate troubleshooting and maintenance, ensuring optimal performance. A touchscreen display offers an immersive and harmonious user experience, emphasizing ease of use and intuitive design.
  • However, the deployment of airport kiosks is contingent upon a reliable and high-speed internet connection. Developed countries with advanced communication network infrastructure, such as the US, the UK, and Germany, are suitable locations for these devices. In contrast, several developing and underdeveloped countries, including India, Malaysia, and Brazil, face challenges in providing basic internet connectivity. The absence of a well-developed communication network infrastructure may hinder the feasibility of deploying airport kiosks in these locations until further notice.

Exclusive Customer Landscape

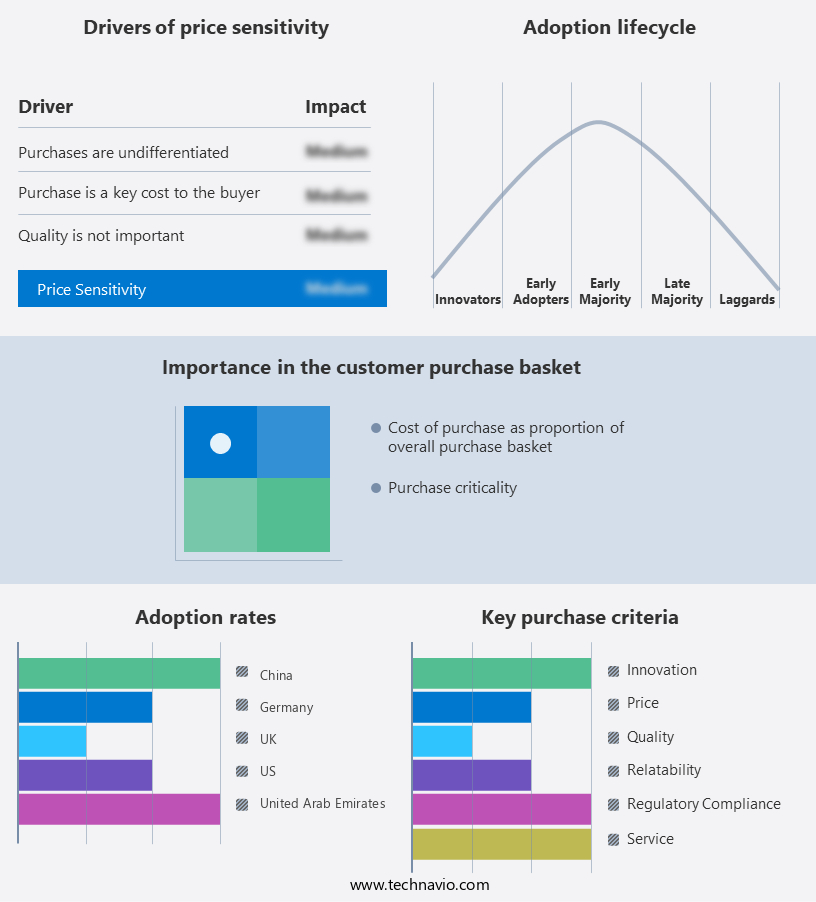
The airport kiosk market forecasting report includes the adoption lifecycle of the market, covering from the innovator's stage to the laggard's stage. It focuses on adoption rates in different regions based on penetration. Furthermore, the airport kiosk market report also includes key purchase criteria and drivers of price sensitivity to help companies evaluate and develop their market growth analysis strategies.

Airport Kiosk Market Share by Geography

 Customer Landscape

Key Companies & Market Insights

Companies are implementing various strategies, such as strategic alliances, airport kiosk market forecast, partnerships, mergers and acquisitions, geographical expansion, and product/service launches, to enhance their presence in the industry.

Advantech Co. Ltd. - The company provides a range of self-service kiosks for airports, including the UTC 100 series, an all-in-one solution, and the UTK6000 and UTK7000 series, which are multipurpose and self-service kiosks, respectively.

The industry research and growth report includes detailed analyses of the competitive landscape of the market and information about key companies, including:

  • Advantech Co. Ltd.
  • Amadeus IT Group SA
  • Bollore SE
  • Cognizant Technology Solutions Corp.
  • DERMALOG Identification Systems GmbH
  • Elenium Automation Pty Ltd.
  • Embross
  • ICTS Europe S.A
  • Marcus Pedersen ApS
  • Materna Information and Communications SE
  • NCR Voyix Corp.
  • Parabit Systems Inc.
  • Phoenix Microsystems
  • Posiflex Technology Inc.
  • Quavis
  • RTX Corp.
  • secunet Security Networks AG
  • SITA
  • Vancouver Airport Authority
  • Zamar AG

Qualitative and quantitative analysis of companies has been conducted to help clients understand the wider business environment as well as the strengths and weaknesses of key industry players. Data is qualitatively analyzed to categorize companies as pure play, category-focused, industry-focused, and diversified; it is quantitatively analyzed to categorize companies as dominant, leading, strong, tentative, and weak.

Recent Development and News in Airport Kiosk Market

  • In January 2024, SITA, a leading technology provider for the air transport industry, launched its new self-service bag drop solution at Helsinki Airport in Finland. This innovation enables passengers to drop off their bags autonomously using a kiosk, reducing queue times and enhancing the passenger experience (SITA Press Release, 2024).
  • In March 2024, Collins Aerospace, a Raytheon Technologies business, announced a strategic partnership with Swissport to integrate Collins' self-service kiosks into Swissport's airport ground handling operations. This collaboration aims to streamline check-in processes and improve operational efficiency (Collins Aerospace Press Release, 2024).
  • In May 2024, Rockwell Collins, now part of Collins Aerospace, secured a USD 10 million contract from the U.S. Customs and Border Protection (CBP) to provide self-service kiosks for international travelers at various U.S. Airports. These kiosks will facilitate faster border processing and improve the overall travel experience (U.S. Customs and Border Protection Press Release, 2024).
  • In April 2025, IDEMIA, a global leader in identity and security, completed the acquisition of MorphoTrak, a biometric technology provider. This strategic move allows IDEMIA to expand its biometric kiosk offerings and strengthen its position in the airport security market (IDEMIA Press Release, 2025).

Research Analyst Overview

  • In the dynamic market, effective risk management and project management are crucial for successful deployments. Security protocols and operating systems require rigorous testing methodologies and system architecture planning. Lifecycle management, including deployment methodology and database management, ensures smooth transitions and minimal disruptions. Contract negotiation and company selection involve careful consideration of supply chain management, quality assurance, and inventory management. Remote diagnostics and training materials enable efficient troubleshooting and staff preparation. Input methods and output devices require firmware updates and API documentation for optimal performance. Preventive and corrective maintenance strategies necessitate software patches and network protocol adherence. Cost analysis and hardware diagnostics are essential for maintaining asset management and effective deployment strategies.
  • Maintenance contracts and technical support offer ongoing assistance, while preventive measures like change management and failure analysis minimize potential issues. Programming languages and peripheral devices must be compatible with the chosen airport kiosk system. Firmware updates and API documentation facilitate seamless integration. Company selection and contract negotiation play a significant role in ensuring reliable customer support portals and effective programming language support. In summary, the market demands a comprehensive approach to project management, risk mitigation, and ongoing support. Operating systems, testing methodologies, and security protocols are essential components, while company selection, cost analysis, and training materials are crucial for successful implementation and maintenance.

Dive into Technavio's robust research methodology, blending expert interviews, extensive data synthesis, and validated models for unparalleled Airport Kiosk Market insights. See full methodology.

Market Scope

Report Coverage

Details

Page number

180

Base year

2023

Historic period

2018-2022

Forecast period

2024-2028

Growth momentum & CAGR

Accelerate at a CAGR of 10.87%

Market growth 2024-2028

USD 1630.5 million

Market structure

Fragmented

YoY growth 2023-2024(%)

9.53

Key countries

US, China, UK, Germany, and United Arab Emirates

Competitive landscape

Leading Companies, Market Positioning of Companies, Competitive Strategies, and Industry Risks

Request Free Sample

What are the Key Data Covered in this Airport Kiosk Market Research and Growth Report?

  • CAGR of the Airport Kiosk industry during the forecast period
  • Detailed information on factors that will drive the growth and forecasting between 2024 and 2028
  • Precise estimation of the size of the market and its contribution of the industry in focus to the parent market
  • Accurate predictions about upcoming growth and trends and changes in consumer behaviour
  • Growth of the market across North America, Europe, APAC, Middle East and Africa, and South America
  • Thorough analysis of the market's competitive landscape and detailed information about companies
  • Comprehensive analysis of factors that will challenge the airport kiosk market growth of industry companies

We can help! Our analysts can customize this airport kiosk market research report to meet your requirements.

Get in touch

1 Executive Summary

  • 1.1 Market overview
    • Executive Summary - Chart on Market Overview
    • Executive Summary - Data Table on Market Overview
    • Executive Summary - Chart on Global Market Characteristics
    • Executive Summary - Chart on Market by Geography
    • Executive Summary - Chart on Market Segmentation by Technology
    • Executive Summary - Chart on Market Segmentation by Type
    • Executive Summary - Chart on Incremental Growth
    • Executive Summary - Data Table on Incremental Growth
    • Executive Summary - Chart on Company Market Positioning

2 Market Landscape

  • 2.1 Market ecosystem
    • Parent Market
    • Data Table on - Parent Market
  • 2.2 Market characteristics
    • Market characteristics analysis
  • 2.3 Value chain analysis
    • Value Chain Analysis

3 Market Sizing

  • 3.1 Market definition
    • Offerings of companies included in the market definition
  • 3.2 Market segment analysis
    • Market segments
  • 3.3 Market size 2023
    • 3.4 Market outlook: Forecast for 2023-2028
      • Chart on Global - Market size and forecast 2023-2028 ($ million)
      • Data Table on Global - Market size and forecast 2023-2028 ($ million)
      • Chart on Global Market: Year-over-year growth 2023-2028 (%)
      • Data Table on Global Market: Year-over-year growth 2023-2028 (%)

    4 Historic Market Size

    • 4.1 Global Airport Kiosk Market 2018 - 2022
      • Historic Market Size - Data Table on Global Airport Kiosk Market 2018 - 2022 ($ million)
    • 4.2 Technology segment analysis 2018 - 2022
      • Historic Market Size - Technology Segment 2018 - 2022 ($ million)
    • 4.3 Type segment analysis 2018 - 2022
      • Historic Market Size - Type Segment 2018 - 2022 ($ million)
    • 4.4 Geography segment analysis 2018 - 2022
      • Historic Market Size - Geography Segment 2018 - 2022 ($ million)
    • 4.5 Country segment analysis 2018 - 2022
      • Historic Market Size - Country Segment 2018 - 2022 ($ million)

    5 Five Forces Analysis

    • 5.1 Five forces summary
      • Five forces analysis - Comparison between 2023 and 2028
    • 5.2 Bargaining power of buyers
      • Bargaining power of buyers - Impact of key factors 2023 and 2028
    • 5.3 Bargaining power of suppliers
      • Bargaining power of suppliers - Impact of key factors in 2023 and 2028
    • 5.4 Threat of new entrants
      • Threat of new entrants - Impact of key factors in 2023 and 2028
    • 5.5 Threat of substitutes
      • Threat of substitutes - Impact of key factors in 2023 and 2028
    • 5.6 Threat of rivalry
      • Threat of rivalry - Impact of key factors in 2023 and 2028
    • 5.7 Market condition
      • Chart on Market condition - Five forces 2023 and 2028

    6 Market Segmentation by Technology

    • 6.1 Market segments
      • Chart on Technology - Market share 2023-2028 (%)
      • Data Table on Technology - Market share 2023-2028 (%)
    • 6.2 Comparison by Technology
      • Chart on Comparison by Technology
      • Data Table on Comparison by Technology
    • 6.3 Hardware - Market size and forecast 2023-2028
      • Chart on Hardware - Market size and forecast 2023-2028 ($ million)
      • Data Table on Hardware - Market size and forecast 2023-2028 ($ million)
      • Chart on Hardware - Year-over-year growth 2023-2028 (%)
      • Data Table on Hardware - Year-over-year growth 2023-2028 (%)
    • 6.4 Software - Market size and forecast 2023-2028
      • Chart on Software - Market size and forecast 2023-2028 ($ million)
      • Data Table on Software - Market size and forecast 2023-2028 ($ million)
      • Chart on Software - Year-over-year growth 2023-2028 (%)
      • Data Table on Software - Year-over-year growth 2023-2028 (%)
    • 6.5 Services - Market size and forecast 2023-2028
      • Chart on Services - Market size and forecast 2023-2028 ($ million)
      • Data Table on Services - Market size and forecast 2023-2028 ($ million)
      • Chart on Services - Year-over-year growth 2023-2028 (%)
      • Data Table on Services - Year-over-year growth 2023-2028 (%)
    • 6.6 Market opportunity by Technology
      • Market opportunity by Technology ($ million)
      • Data Table on Market opportunity by Technology ($ million)

    7 Market Segmentation by Type

    • 7.1 Market segments
      • Chart on Type - Market share 2023-2028 (%)
      • Data Table on Type - Market share 2023-2028 (%)
    • 7.2 Comparison by Type
      • Chart on Comparison by Type
      • Data Table on Comparison by Type
    • 7.3 Check-in Kiosk - Market size and forecast 2023-2028
      • Chart on Check-in Kiosk - Market size and forecast 2023-2028 ($ million)
      • Data Table on Check-in Kiosk - Market size and forecast 2023-2028 ($ million)
      • Chart on Check-in Kiosk - Year-over-year growth 2023-2028 (%)
      • Data Table on Check-in Kiosk - Year-over-year growth 2023-2028 (%)
    • 7.4 Automated passport control - Market size and forecast 2023-2028
      • Chart on Automated passport control - Market size and forecast 2023-2028 ($ million)
      • Data Table on Automated passport control - Market size and forecast 2023-2028 ($ million)
      • Chart on Automated passport control - Year-over-year growth 2023-2028 (%)
      • Data Table on Automated passport control - Year-over-year growth 2023-2028 (%)
    • 7.5 Common-use self service - Market size and forecast 2023-2028
      • Chart on Common-use self service - Market size and forecast 2023-2028 ($ million)
      • Data Table on Common-use self service - Market size and forecast 2023-2028 ($ million)
      • Chart on Common-use self service - Year-over-year growth 2023-2028 (%)
      • Data Table on Common-use self service - Year-over-year growth 2023-2028 (%)
    • 7.6 Bag drop - Market size and forecast 2023-2028
      • Chart on Bag drop - Market size and forecast 2023-2028 ($ million)
      • Data Table on Bag drop - Market size and forecast 2023-2028 ($ million)
      • Chart on Bag drop - Year-over-year growth 2023-2028 (%)
      • Data Table on Bag drop - Year-over-year growth 2023-2028 (%)
    • 7.7 Others - Market size and forecast 2023-2028
      • Chart on Others - Market size and forecast 2023-2028 ($ million)
      • Data Table on Others - Market size and forecast 2023-2028 ($ million)
      • Chart on Others - Year-over-year growth 2023-2028 (%)
      • Data Table on Others - Year-over-year growth 2023-2028 (%)
    • 7.8 Market opportunity by Type
      • Market opportunity by Type ($ million)
      • Data Table on Market opportunity by Type ($ million)

    8 Customer Landscape

    • 8.1 Customer landscape overview
      • Analysis of price sensitivity, lifecycle, customer purchase basket, adoption rates, and purchase criteria

    9 Geographic Landscape

    • 9.1 Geographic segmentation
      • Chart on Market share by geography 2023-2028 (%)
      • Data Table on Market share by geography 2023-2028 (%)
    • 9.2 Geographic comparison
      • Chart on Geographic comparison
      • Data Table on Geographic comparison
    • 9.3 North America - Market size and forecast 2023-2028
      • Chart on North America - Market size and forecast 2023-2028 ($ million)
      • Data Table on North America - Market size and forecast 2023-2028 ($ million)
      • Chart on North America - Year-over-year growth 2023-2028 (%)
      • Data Table on North America - Year-over-year growth 2023-2028 (%)
    • 9.4 Europe - Market size and forecast 2023-2028
      • Chart on Europe - Market size and forecast 2023-2028 ($ million)
      • Data Table on Europe - Market size and forecast 2023-2028 ($ million)
      • Chart on Europe - Year-over-year growth 2023-2028 (%)
      • Data Table on Europe - Year-over-year growth 2023-2028 (%)
    • 9.5 APAC - Market size and forecast 2023-2028
      • Chart on APAC - Market size and forecast 2023-2028 ($ million)
      • Data Table on APAC - Market size and forecast 2023-2028 ($ million)
      • Chart on APAC - Year-over-year growth 2023-2028 (%)
      • Data Table on APAC - Year-over-year growth 2023-2028 (%)
    • 9.6 Middle East and Africa - Market size and forecast 2023-2028
      • Chart on Middle East and Africa - Market size and forecast 2023-2028 ($ million)
      • Data Table on Middle East and Africa - Market size and forecast 2023-2028 ($ million)
      • Chart on Middle East and Africa - Year-over-year growth 2023-2028 (%)
      • Data Table on Middle East and Africa - Year-over-year growth 2023-2028 (%)
    • 9.7 South America - Market size and forecast 2023-2028
      • Chart on South America - Market size and forecast 2023-2028 ($ million)
      • Data Table on South America - Market size and forecast 2023-2028 ($ million)
      • Chart on South America - Year-over-year growth 2023-2028 (%)
      • Data Table on South America - Year-over-year growth 2023-2028 (%)
    • 9.8 US - Market size and forecast 2023-2028
      • Chart on US - Market size and forecast 2023-2028 ($ million)
      • Data Table on US - Market size and forecast 2023-2028 ($ million)
      • Chart on US - Year-over-year growth 2023-2028 (%)
      • Data Table on US - Year-over-year growth 2023-2028 (%)
    • 9.9 China - Market size and forecast 2023-2028
      • Chart on China - Market size and forecast 2023-2028 ($ million)
      • Data Table on China - Market size and forecast 2023-2028 ($ million)
      • Chart on China - Year-over-year growth 2023-2028 (%)
      • Data Table on China - Year-over-year growth 2023-2028 (%)
    • 9.10 UK - Market size and forecast 2023-2028
      • Chart on UK - Market size and forecast 2023-2028 ($ million)
      • Data Table on UK - Market size and forecast 2023-2028 ($ million)
      • Chart on UK - Year-over-year growth 2023-2028 (%)
      • Data Table on UK - Year-over-year growth 2023-2028 (%)
    • 9.11 Germany - Market size and forecast 2023-2028
      • Chart on Germany - Market size and forecast 2023-2028 ($ million)
      • Data Table on Germany - Market size and forecast 2023-2028 ($ million)
      • Chart on Germany - Year-over-year growth 2023-2028 (%)
      • Data Table on Germany - Year-over-year growth 2023-2028 (%)
    • 9.12 United Arab Emirates - Market size and forecast 2023-2028
      • Chart on United Arab Emirates - Market size and forecast 2023-2028 ($ million)
      • Data Table on United Arab Emirates - Market size and forecast 2023-2028 ($ million)
      • Chart on United Arab Emirates - Year-over-year growth 2023-2028 (%)
      • Data Table on United Arab Emirates - Year-over-year growth 2023-2028 (%)
    • 9.13 Market opportunity by geography
      • Market opportunity by geography ($ million)
      • Data Tables on Market opportunity by geography ($ million)

    10 Drivers, Challenges, and Opportunity/Restraints

    • 10.1 Market drivers
      • 10.2 Market challenges
        • 10.3 Impact of drivers and challenges
          • Impact of drivers and challenges in 2023 and 2028
        • 10.4 Market opportunities/restraints

          11 Competitive Landscape

          • 11.1 Overview
            • 11.2 Competitive Landscape
              • Overview on criticality of inputs and factors of differentiation
            • 11.3 Landscape disruption
              • Overview on factors of disruption
            • 11.4 Industry risks
              • Impact of key risks on business

            12 Competitive Analysis

            • 12.1 Companies profiled
              • Companies covered
            • 12.2 Market positioning of companies
              • Matrix on companies position and classification
            • 12.3 Advantech Co. Ltd.
              • Advantech Co. Ltd. - Overview
              • Advantech Co. Ltd. - Business segments
              • Advantech Co. Ltd. - Key news
              • Advantech Co. Ltd. - Key offerings
              • Advantech Co. Ltd. - Segment focus
            • 12.4 Amadeus IT Group SA
              • Amadeus IT Group SA - Overview
              • Amadeus IT Group SA - Business segments
              • Amadeus IT Group SA - Key offerings
              • Amadeus IT Group SA - Segment focus
            • 12.5 Bollore SE
              • Bollore SE - Overview
              • Bollore SE - Business segments
              • Bollore SE - Key offerings
              • Bollore SE - Segment focus
            • 12.6 Cognizant Technology Solutions Corp.
              • Cognizant Technology Solutions Corp. - Overview
              • Cognizant Technology Solutions Corp. - Business segments
              • Cognizant Technology Solutions Corp. - Key news
              • Cognizant Technology Solutions Corp. - Key offerings
              • Cognizant Technology Solutions Corp. - Segment focus
            • 12.7 DERMALOG Identification Systems GmbH
              • DERMALOG Identification Systems GmbH - Overview
              • DERMALOG Identification Systems GmbH - Product / Service
              • DERMALOG Identification Systems GmbH - Key offerings
            • 12.8 Elenium Automation Pty Ltd.
              • Elenium Automation Pty Ltd. - Overview
              • Elenium Automation Pty Ltd. - Product / Service
              • Elenium Automation Pty Ltd. - Key news
              • Elenium Automation Pty Ltd. - Key offerings
            • 12.9 Embross
              • Embross - Overview
              • Embross - Product / Service
              • Embross - Key offerings
            • 12.10 Marcus Pedersen ApS
              • Marcus Pedersen ApS - Overview
              • Marcus Pedersen ApS - Product / Service
              • Marcus Pedersen ApS - Key offerings
            • 12.11 Materna Information and Communications SE
              • Materna Information and Communications SE - Overview
              • Materna Information and Communications SE - Product / Service
              • Materna Information and Communications SE - Key news
              • Materna Information and Communications SE - Key offerings
            • 12.12 NCR Voyix Corp.
              • NCR Voyix Corp. - Overview
              • NCR Voyix Corp. - Business segments
              • NCR Voyix Corp. - Key news
              • NCR Voyix Corp. - Key offerings
              • NCR Voyix Corp. - Segment focus
            • 12.13 Parabit Systems Inc.
              • Parabit Systems Inc. - Overview
              • Parabit Systems Inc. - Product / Service
              • Parabit Systems Inc. - Key offerings
            • 12.14 Posiflex Technology Inc.
              • Posiflex Technology Inc. - Overview
              • Posiflex Technology Inc. - Business segments
              • Posiflex Technology Inc. - Key offerings
              • Posiflex Technology Inc. - Segment focus
            • 12.15 Quavis
              • Quavis - Overview
              • Quavis - Product / Service
              • Quavis - Key offerings
            • 12.16 RTX Corp.
              • RTX Corp. - Overview
              • RTX Corp. - Business segments
              • RTX Corp. - Key news
              • RTX Corp. - Key offerings
              • RTX Corp. - Segment focus
            • 12.17 secunet Security Networks AG
              • secunet Security Networks AG - Overview
              • secunet Security Networks AG - Business segments
              • secunet Security Networks AG - Key offerings
              • secunet Security Networks AG - Segment focus

            13 Appendix

            • 13.1 Scope of the report
              • 13.2 Inclusions and exclusions checklist
                • Inclusions checklist
                • Exclusions checklist
              • 13.3 Currency conversion rates for US$
                • Currency conversion rates for US$
              • 13.4 Research methodology
                • Research methodology
              • 13.5 Data procurement
                • Information sources
              • 13.6 Data validation
                • Data validation
              • 13.7 Validation techniques employed for market sizing
                • Validation techniques employed for market sizing
              • 13.8 Data synthesis
                • Data synthesis
              • 13.9 360 degree market analysis
                • 360 degree market analysis
              • 13.10 List of abbreviations
                • List of abbreviations

              Research Methodology

              Technavio presents a detailed picture of the market by way of study, synthesis, and summation of data from multiple sources. The analysts have presented the various facets of the market with a particular focus on identifying the key industry influencers. The data thus presented is comprehensive, reliable, and the result of extensive research, both primary and secondary.

              INFORMATION SOURCES

              Primary sources

              • Manufacturers and suppliers
              • Channel partners
              • Industry experts
              • Strategic decision makers

              Secondary sources

              • Industry journals and periodicals
              • Government data
              • Financial reports of key industry players
              • Historical data
              • Press releases

              DATA ANALYSIS

              Data Synthesis

              • Collation of data
              • Estimation of key figures
              • Analysis of derived insights

              Data Validation

              • Triangulation with data models
              • Reference against proprietary databases
              • Corroboration with industry experts

              REPORT WRITING

              Qualitative

              • Market drivers
              • Market challenges
              • Market trends
              • Five forces analysis

              Quantitative

              • Market size and forecast
              • Market segmentation
              • Geographical insights
              • Competitive landscape

              Interested in this report?

              Get your sample now to see our research methodology and insights!

              Download Now

              Frequently Asked Questions

              Airport Kiosk market growth will increase by $ 1630.5 mn during 2024-2028 .

              The Airport Kiosk market is expected to grow at a CAGR of 10.87% during 2024-2028 .

              Airport Kiosk market is segmented by Technology( Hardware, Software, Services) Type( Check-in Kiosk, Automated passport control, Common-use self service, Bag drop, Others)

              Advantech Co. Ltd., Amadeus IT Group SA, Bollore SE, Cognizant Technology Solutions Corp., DERMALOG Identification Systems GmbH, Elenium Automation Pty Ltd., Embross, ICTS Europe S.A, Marcus Pedersen ApS, Materna Information and Communications SE, NCR Voyix Corp., Parabit Systems Inc., Phoenix Microsystems, Posiflex Technology Inc., Quavis, RTX Corp., secunet Security Networks AG, SITA, Vancouver Airport Authority, Zamar AG are a few of the key vendors in the Airport Kiosk market.

              North America will register the highest growth rate of 48% among the other regions. Therefore, the Airport Kiosk market in North America is expected to garner significant business opportunities for the vendors during the forecast period.

              US, China, UK, Germany, United Arab Emirates

              • Passenger travel is increasingWith the increase in international passenger traffic throughout the world is the driving factor this market.
              • there is a need for automated passport control kiosks to speed up the immigration procedure at airports. These systems are currently installed in over 40 airports across the US is the driving factor this market.
              • including major airports such as Hartsfield-Jackson Atlanta International Airport is the driving factor this market.
              • Los Angeles International Airport (LAX) is the driving factor this market.
              • Chicago O Hare International Airport (ORD) is the driving factor this market.
              • and Dallas/Fort Worth International Airport (DFW) is the driving factor this market.
              • among others. In addition is the driving factor this market.
              • airports are implementing advanced biometric-enabled kiosks that will significantly cut passenger wait times and improve customs and border control procedures. Owing to this benefit is the driving factor this market.
              • airports all over the world are installing these technological kiosks is the driving factor this market.
              • resulting in the segment strong expansion in the future. is the driving factor this market.

              The Airport Kiosk market vendors should focus on grabbing business opportunities from the Hardware segment as it accounted for the largest market share in the base year.