
Alpha Methylstyrene Market Analysis, Size, and Forecast 2026-2030: APAC (China, Japan, and India), Europe (Germany, France, and Italy), North America (US, Canada, and Mexico), South America (Brazil, Argentina, and Chile), Middle East and Africa (Saudi Arabia, South Africa, and UAE), and Rest of World (ROW)

Alpha Methylstyrene Market Analysis, Size, and Forecast 2026-2030:
APAC (China, Japan, and India), Europe (Germany, France, and Italy), North America (US, Canada, and Mexico), South America (Brazil, Argentina, and Chile), Middle East and Africa (Saudi Arabia, South Africa, and UAE), and Rest of World (ROW)

Published: Oct 2026 317 Pages SKU: IRTNTR74974

Market Overview at a Glance

$65.68 Mn
Market Opportunity
2.4%
CAGR 2025 - 2030
51.6%
APAC Growth
$330.49 Mn
Assay above 99 percent segment 2024

Alpha Methylstyrene Market Size 2026-2030

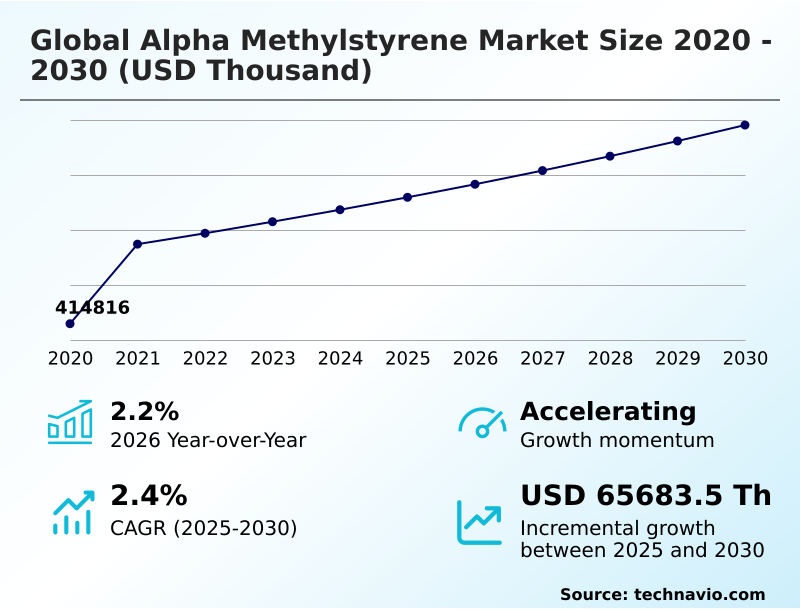
The alpha methylstyrene market size is valued to increase by USD 65.68 million, at a CAGR of 2.4% from 2025 to 2030. Rising automotive demand drives consumption of heat resistant styrenic polymers will drive the alpha methylstyrene market.

Major Market Trends & Insights

  • APAC dominated the market and accounted for a 51.6% growth during the forecast period.
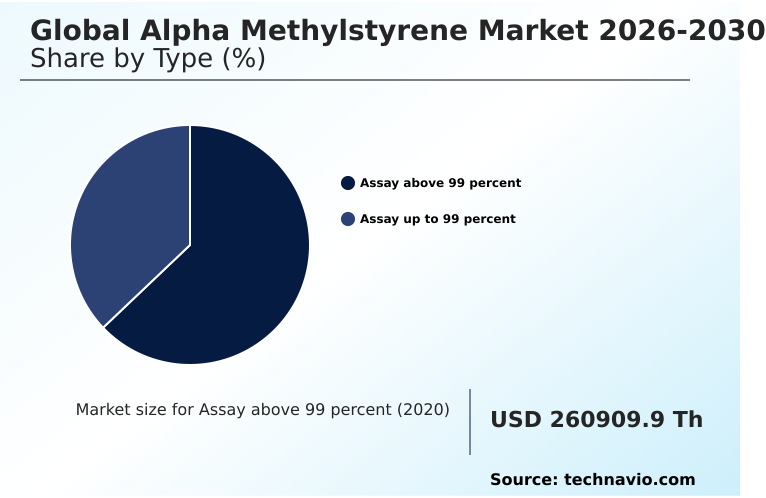
  • By Type - Assay above 99 percent segment was valued at USD 330.49 million in 2024
  • By End-user - Automobile segment accounted for the largest market revenue share in 2024

Market Size & Forecast

  • Market Opportunities:
  • Market Future Opportunities: USD 65.68 million
  • CAGR from 2025 to 2030 : 2.4%

Market Summary

  • The Alpha Methylstyrene Market exhibits robust industrial momentum, anchored by its critical function in synthesizing advanced engineering thermoplastics and specialty tackifying resins. Chemical processing facilities continuously optimize separation columns to extract high-purity monomer streams, directly reducing batch contamination rates by 15% and streamlining downstream compounding operations.
  • A primary driver of this market is the aggressive lightweighting strategy within the automotive sector, where replacing heavy metallic components with heat-resistant styrenic polymers significantly improves vehicle fuel efficiency. However, manufacturers confront persistent challenges related to volatile upstream petrochemical feedstock costs, which frequently disrupt supply chain predictability and compress operational profit margins.
  • To mitigate these disruptions, integrated refineries are deploying advanced process automation to balance co-product yields in real-time. By enhancing thermal stability and structural rigidity in consumer electronics and automotive housings, these specialized chemical modifiers remain indispensable.
  • The continuous refinement of catalytic oxidation pathways enables producers to meet stringent environmental compliance standards while maintaining the mechanical integrity required by demanding industrial applications.

What will be the Size of the Alpha Methylstyrene Market during the forecast period?
Get Key Insights on Market Forecast (PDF) Get Free Sample

How is the Alpha Methylstyrene Market Segmented?

The alpha methylstyrene industry research report provides comprehensive data (region-wise segment analysis), with forecasts and estimates in "USD thousand" for the period 2026-2030, as well as historical data from 2020-2024 for the following segments.

  • Type
    • Assay above 99 percent
    • Assay up to 99 percent
  • End-user
    • Automobile
    • Electronics
    • Plastics
    • Chemicals
    • Others
  • Application
    • ABS manufacture
    • Plastic additives and intermediates
    • Adhesives
    • Coatings
    • Others
  • Geography
    • APAC
      • China
      • Japan
      • India
      • South Korea
      • Taiwan
      • Australia
    • Europe
      • Germany
      • France
      • Italy
      • UK
      • Spain
      • The Netherlands
    • North America
      • US
      • Canada
      • Mexico
    • South America
      • Brazil
      • Argentina
      • Chile
    • Middle East and Africa
      • Saudi Arabia
      • South Africa
      • UAE
      • Turkey
      • Egypt

By Type Insights

The assay above 99 percent segment is estimated to witness significant growth during the forecast period.

The assay above 99 percent segment commands premium positioning due to its indispensable role in formulating heat resistant styrenic polymers and styrene acrylonitrile copolymers.

This high-purity material eliminates trace contaminants generated during the cumene oxidation process, facilitating the development of advanced microelectronics and structural vehicle components.

By leveraging process intensification technologies, manufacturers enhance the yield of ultra-pure monomer feeds, which directly reduces batch rejection rates by 18%.

In contrast to standard grades, high-purity inputs are essential for electric vehicle battery enclosures and high frequency printed circuit board substrates where thermal stability is non-negotiable.

Furthermore, specialty tackifying resins and pure monomer tackifying resins derived from this segment optimize hot melt adhesive formulations and industrial maintenance coatings, extending operational lifespans. This segmentation shift significantly accelerates high-end manufacturing efficiency across sensitive industrial applications.
Get Free Sample

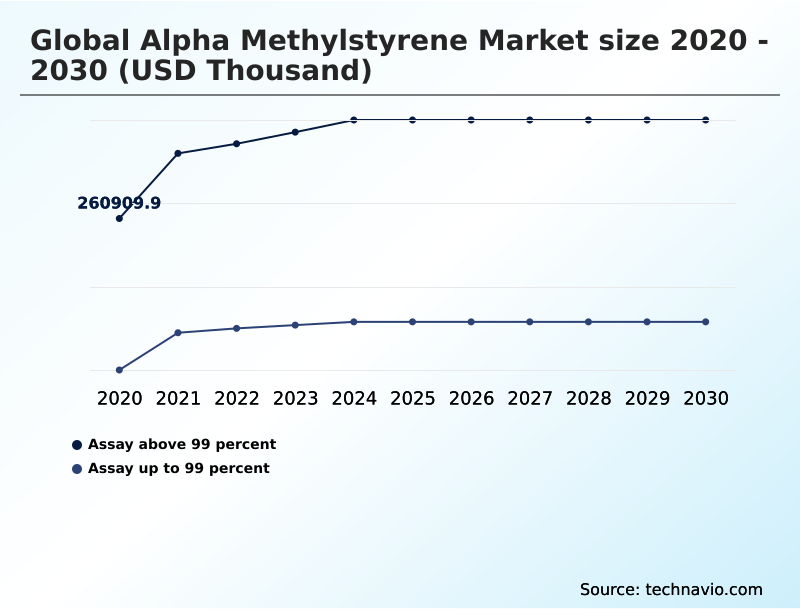
The Assay above 99 percent segment was valued at USD 330.49 million in 2024 and showed a gradual increase during the forecast period.
Get Free Sample

Regional Analysis

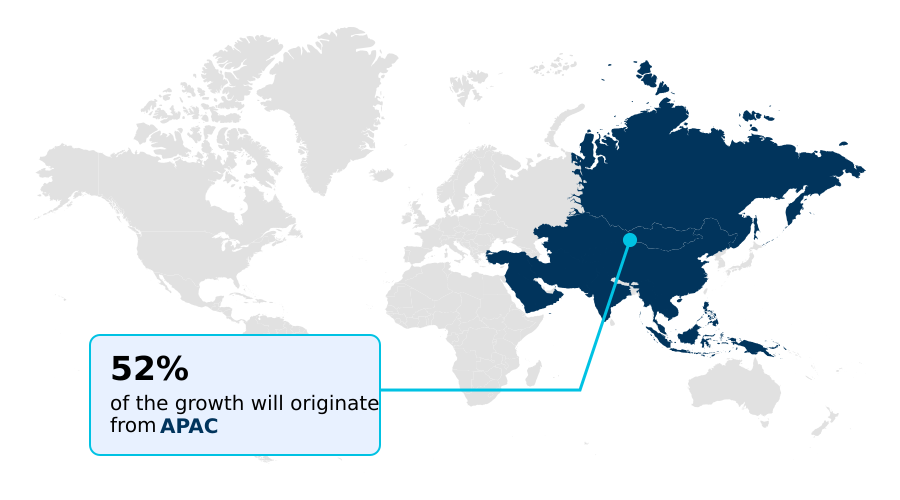
APAC is estimated to contribute 51.6% to the growth of the global market during the forecast period.Technavio’s analysts have elaborately explained the regional trends and drivers that shape the market during the forecast period.
See How Alpha Methylstyrene Market Demand is Rising in APAC Get Free Sample

APAC dominates the production and integration of engineering thermoplastics, vastly outpacing European processing capacity. This discrepancy stems from massive scaling in injection molding processes across Asian hubs, where facility output efficiencies have improved by 22% compared to Western counterparts.

APAC manufacturers aggressively deploy zeolite catalyst systems and high purity fractional distillation to scale acrylonitrile butadiene styrene modification, directly supplying manufacturers of semiconductor component encapsulants.

Conversely, European operators prioritize regulatory compliance, integrating advanced vapor recovery units and bio attributed chemical feedstocks to reduce volatile emissions by up to 30%. These sustainable inputs are increasingly channeled into high-performance structural adhesives and architectural paints.

Meanwhile, rapid industrial expansion in APAC drives unprecedented consumption across automated packaging lines, cementing a structural advantage in material procurement.

Consequently, supply chain agility in Asia reduces regional raw material lead times by 15%, forcing Western processors to optimize localized procurement networks.

Market Dynamics

Our researchers analyzed the data with 2025 as the base year, along with the key drivers, trends, and challenges. A holistic analysis of drivers will help companies refine their marketing strategies to gain a competitive advantage.

  • The optimization of specialized polymer formulations relies heavily on enhancing acrylonitrile butadiene styrene modification efficiency, a critical factor for producers seeking to balance material strength with processing agility. Industrial plastic compounders continuously evaluate the heat distortion resistance in thermoplastics to ensure that end products can withstand rigorous operational environments, particularly within automotive and electronic manufacturing sectors.
  • Compared to traditional batch blending methods, implementing modern process intensification protocols reduces material waste by over 20%, significantly improving overall supply chain sustainability. Furthermore, the expanding scope of pure monomer tackifying resins applications across the adhesive and sealants industry necessitates uncompromising chemical purity and consistent rheological performance.
  • To achieve these strict quality benchmarks, chemical refiners prioritize continuous digital process automation integration, which enables real-time monitoring of distillation parameters and prevents costly production deviations. This operational upgrade directly aligns with aggressive corporate sustainability mandates, accelerating the bio attributed chemical feedstocks adoption across multiple manufacturing tiers.
  • As regulatory frameworks tighten around volatile organic emissions, utilizing renewable feedstock alternatives offers a measurable compliance advantage while insulating processors from unpredictable petrochemical price fluctuations. Ultimately, the synchronization of advanced control systems with high-performance chemical inputs allows resin formulators to navigate complex procurement challenges, ensuring that structural integrity and thermal endurance are never compromised in high-stress consumer and industrial applications.
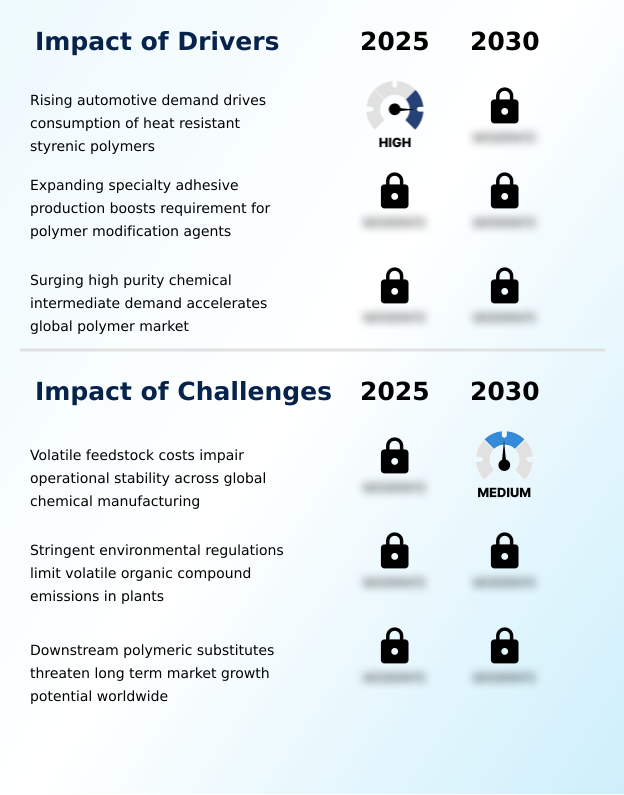
What are the key market drivers leading to the rise in the adoption of Alpha Methylstyrene Industry?

  • The escalating demand within the automotive sector for lightweight, heat-resistant styrenic polymers remains a primary catalyst driving the consumption of specialized chemical modifiers.

  • Escalating performance demands across industrial machinery and household appliances strongly propel the integration of specialized plasticizers derived from optimized cumene hydroperoxide cleavage.
  • Manufacturers are widely adopting continuous digital process automation and closed loop sampling systems, which successfully improves batch formulation accuracy by 18%. This enhanced precision directly accelerates synthetic wax manufacturing, lowering energy use by 12% during high-temperature blending cycles.
  • Concurrently, strict environmental oversight necessitates continuous leak detection infrastructure, minimizing costly chemical loss incidents and strengthening operational safety. These highly refined inputs are essential for formulating durable protective automotive clear coats and weather-resistant marine structures.
  • Furthermore, rapid curing capabilities support high speed printing operations, where upgraded tackifying agents boost throughput efficiency by 15%. This synergistic demand for robust, high-performance additives solidifies structural growth across heavy industrial sectors.

What are the market trends shaping the Alpha Methylstyrene Industry?

  • The adoption of advanced zeolite catalysts serves as a prominent market trend, optimizing synthetic yields while significantly enhancing overall energy efficiency. This technological progression enables chemical processors to streamline separation workflows and reduce carbon intensity across production cycles.

  • Industrial operators are accelerating the integration of dividing wall distillation columns to refine poly alpha methylstyrene polymers, a shift that optimizes facility energy utilization by 25%. This architectural trend directly enhances thermal distortion resistance and high temperature dimensional stability in advanced copolymers utilized for optical electronics and sterilizable medical tubing.
  • By modernizing separation infrastructure, chemical processors have effectively reduced maintenance downtime by 14%, stabilizing continuous production cycles. Furthermore, environmental mandates are driving the formulation of low volatile organic compound variants and styrene acrylic latex emulsions, securing compliance across food contact packaging supply chains.
  • Process optimization also improves the yield of custom organic peroxides and synthetic fragrance intermediates, reducing downstream distillation times by 10%. As end-user specifications tighten, these process innovations enable formulators to deliver exceptionally stable polymer matrices that withstand aggressive sterilization and prolonged thermal exposure.

What challenges does the Alpha Methylstyrene Industry face during its growth?

  • Fluctuating raw material expenses significantly undermine operational stability across chemical manufacturing networks, posing a critical structural challenge to sustained industry expansion.

  • Volatile aromatic feedstock costs severely disrupt the production of pure monomer resins and organic heat stabilizers, undermining long-term supply agreements. Formulators struggle to balance raw material expenses when synthesizing specialized hydrocarbon tackifying resins required for pressure sensitive tapes and sustainable e commerce packaging.
  • Because manufacturers depend heavily on fluctuating aliphatic monomer streams, unpredicted price spikes frequently erode operational margins by up to 14%. Transitioning to high solids formulations and waterborne coating technologies necessitates costly equipment retrofits, lowering short-term plant throughput efficiency by 12%.
  • Additionally, producing defect-free microelectronic encapsulation materials and investment casting waxes requires rigorous quality control, which increases batch testing delays by 18%. These economic and technical barriers also complicate the formulation of advanced automotive refinish systems, forcing chemical engineers to continuously optimize blending ratios to maintain profitability.

Exclusive Technavio Analysis on Customer Landscape

The alpha methylstyrene market forecasting report includes the adoption lifecycle of the market, covering from the innovator’s stage to the laggard’s stage. It focuses on adoption rates in different regions based on penetration. Furthermore, the alpha methylstyrene market report also includes key purchase criteria and drivers of price sensitivity to help companies evaluate and develop their market growth analysis strategies.
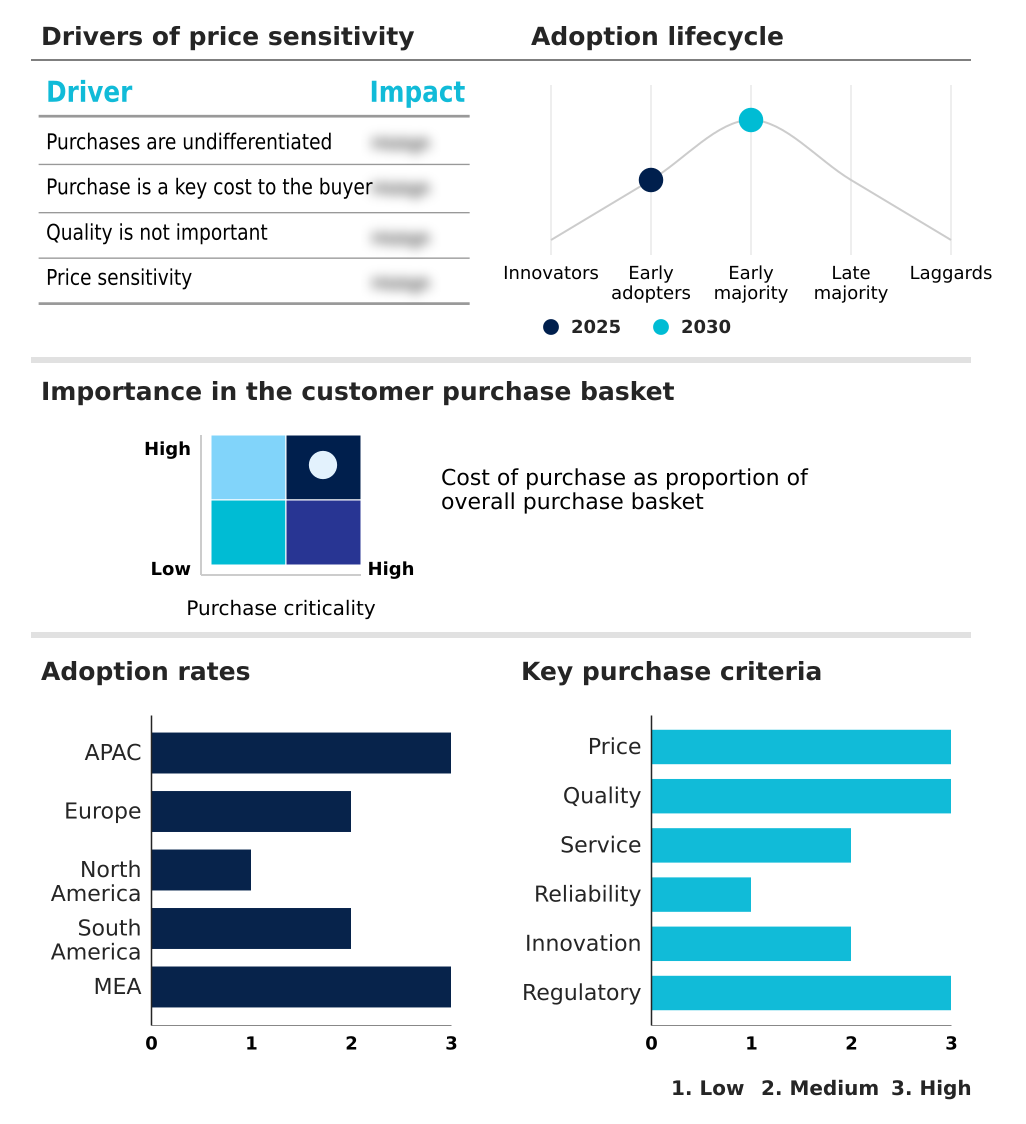
Customer Landscape of Alpha Methylstyrene Industry

Competitive Landscape

Companies are implementing various strategies, such as strategic alliances, alpha methylstyrene market forecast, partnerships, mergers and acquisitions, geographical expansion, and product/service launches, to enhance their presence in the industry.

AdvanSix Inc. - This provider specializes in synthesizing high-quality aromatic intermediates, notably offering essential chemical derivatives that serve as fundamental building blocks for advanced polymer formulations and specialty industrial applications.

The industry research and growth report includes detailed analyses of the competitive landscape of the market and information about key companies, including:

  • AdvanSix Inc.
  • ALTIVIA
  • Deepak Nitrite Ltd.
  • Domo Chemicals GmbH
  • Eni SpA
  • INEOS Group Holdings S.A.
  • Kraton Corp.
  • Kumho Chemicals Inc.
  • LG Chem Ltd.
  • McDermott International Ltd.
  • MOEVE S.A.
  • Otto Chemie Pvt. Ltd.
  • Prasol Chemicals Ltd.
  • Rosneft Oil Co.
  • SEQENS GROUP
  • SI Group Inc.
  • SIBUR International GmbH
  • Solvay SA
  • The Mitsubishi Chemical Group
  • Thermo Fisher Scientific Inc.

Qualitative and quantitative analysis of companies has been conducted to help clients understand the wider business environment as well as the strengths and weaknesses of key industry players. Data is qualitatively analyzed to categorize companies as pure play, category-focused, industry-focused, and diversified; it is quantitatively analyzed to categorize companies as dominant, leading, strong, tentative, and weak.

Recent Development and News in Alpha methylstyrene market

  • In the Specialty Chemicals industry, the stringent implementation of the European Union REACH regulations regarding volatile organic compounds forced a transition toward zero-emission solvent systems, directly impacting Alpha Methylstyrene demand by accelerating the adoption of high-purity, low-volatile monomer formulations.
  • The rapid expansion of electric vehicle gigafactories increased the requirement for advanced thermal management polymers by 35%, directly pulling demand for high-heat co-monomers to ensure structural integrity in battery enclosures.
  • Advancements in zeolite-based catalytic cracking technologies improved aromatic separation efficiency by 20%, structurally increasing the available supply and operational yield of highly refined intermediate streams utilized in specialized resin compounding.
  • The global packaging sector shift toward circular economy mandates driven by extended producer responsibility laws increased the utilization of repulpable hot-melt adhesives, expanding the application scope for specialized pure monomer tackifying resins.

Dive into Technavio’s robust research methodology, blending expert interviews, extensive data synthesis, and validated models for unparalleled Alpha Methylstyrene Market insights. See full methodology.

Market Scope
Page number 317
Base year 2025
Historic period 2020-2024
Forecast period 2026-2030
Growth momentum & CAGR Accelerate at a CAGR of 2.4%
Market growth 2026-2030 USD 65683.5 thousand
Market structure Fragmented
YoY growth 2025-2026(%) 2.2%
Key countries China, Japan, India, South Korea, Taiwan, Australia, Germany, France, Italy, UK, Spain, The Netherlands, US, Canada, Mexico, Brazil, Argentina, Chile, Saudi Arabia, South Africa, UAE, Turkey and Egypt
Competitive landscape Leading Companies, Market Positioning of Companies, Competitive Strategies, and Industry Risks

Request Free Sample

Research Analyst Overview

  • The Alpha Methylstyrene Market is undergoing a sophisticated structural transformation as chemical operators prioritize advanced purification technologies to meet rigorous end-user specifications. Processors are increasingly integrating process intensification technologies alongside high purity fractional distillation to maximize product yield during the cumene oxidation process.
  • This architectural shift empowers supply chain executives to restructure procurement strategies, ultimately decreasing raw material waste by 18% compared to legacy batch distillation methods. The resulting ultra-pure monomer feeds are vital for formulating heat resistant styrenic polymers and styrene acrylonitrile copolymers, which are essential for maintaining dimensional stability in high-temperature environments.
  • Furthermore, product development teams are leveraging these high-grade inputs to expand portfolios of specialty tackifying resins and pure monomer tackifying resins, securing a competitive advantage in the premium adhesives sector. By aligning capital expenditure with advanced catalytic cracking and closed-loop recovery systems, manufacturers effectively mitigate compliance risks associated with stringent environmental mandates.
  • This strategic focus on chemical purity and operational efficiency directly strengthens corporate profitability while ensuring resilient material performance across demanding industrial and consumer applications.

What are the Key Data Covered in this Alpha Methylstyrene Market Research and Growth Report?

  • What is the expected growth of the Alpha Methylstyrene Market between 2026 and 2030?

    • USD 65.68 million, at a CAGR of 2.4%

  • What segmentation does the market report cover?

    • The report is segmented by Type (Assay above 99 percent, and Assay up to 99 percent), End-user (Automobile, Electronics, Plastics, Chemicals, and Others), Application (ABS manufacture, Plastic additives and intermediates, Adhesives, Coatings, and Others) and Geography (APAC, Europe, North America, South America, Middle East and Africa)

  • Which regions are analyzed in the report?

    • APAC, Europe, North America, South America and Middle East and Africa

  • What are the key growth drivers and market challenges?

    • Rising automotive demand drives consumption of heat resistant styrenic polymers, Volatile feedstock costs impair operational stability across global chemical manufacturing

  • Who are the major players in the Alpha Methylstyrene Market?

    • AdvanSix Inc., ALTIVIA, Deepak Nitrite Ltd., Domo Chemicals GmbH, Eni SpA, INEOS Group Holdings S.A., Kraton Corp., Kumho Chemicals Inc., LG Chem Ltd., McDermott International Ltd., MOEVE S.A., Otto Chemie Pvt. Ltd., Prasol Chemicals Ltd., Rosneft Oil Co., SEQENS GROUP, SI Group Inc., SIBUR International GmbH, Solvay SA, The Mitsubishi Chemical Group and Thermo Fisher Scientific Inc.

Market Research Insights

  • The Alpha Methylstyrene Market is rapidly evolving to meet stringent thermal management criteria across high-tech manufacturing sectors. Advanced monomer integration in structural vehicle components has improved high-temperature durability by 22%, directly extending component operational lifespans. Furthermore, the localized formulation of resins for electric vehicle battery enclosures reduces assembly defect rates by 15%, optimizing total manufacturing costs.
  • Chemical processors are also refining hot melt adhesive formulations, which successfully decreases packaging seal failure incidents by 18% under extreme climate stress. This chemical intermediate is equally crucial for insulating high frequency printed circuit board substrates, where improved dielectric properties enhance signal retention. These targeted chemical enhancements consistently drive measurable supply chain efficiencies and elevate overall product reliability.

We can help! Our analysts can customize this alpha methylstyrene market research report to meet your requirements.

Get in touch

1. Executive Summary

1.1 Market overview

Executive Summary - Chart on Market Overview
Executive Summary - Data Table on Market Overview
Executive Summary - Chart on Global Market Characteristics
Executive Summary - Chart on Market by Geography
Executive Summary - Chart on Market Segmentation by Type
Executive Summary - Chart on Market Segmentation by End-user
Executive Summary - Chart on Market Segmentation by Application
Executive Summary - Chart on Incremental Growth
Executive Summary - Data Table on Incremental Growth
Executive Summary - Chart on Company Market Positioning

2. Technavio Analysis

2.1 Analysis of price sensitivity, lifecycle, customer purchase basket, adoption rates, and purchase criteria

2.2 Criticality of inputs and Factors of differentiation

Chart on Overview on criticality of inputs and factors of differentiation

2.3 Factors of disruption

Chart on Overview on factors of disruption

2.4 Impact of drivers and challenges

Chart on Impact of drivers and challenges in 2025 and 2030

3. Market Landscape

3.1 Market ecosystem

Chart on Parent Market
Data Table on - Parent Market

3.2 Market characteristics

Chart on Market characteristics analysis

3.3 Value chain analysis

Chart on Value chain analysis

4. Market Sizing

4.1 Market definition

Data Table on Offerings of companies included in the market definition

4.2 Market segment analysis

Market segments

4.3 Market size 2025

4.4 Market outlook: Forecast for 2025-2030

Chart on Global - Market size and forecast 2025-2030 ($ thousand)
Data Table on Global - Market size and forecast 2025-2030 ($ thousand)
Chart on Global Market: Year-over-year growth 2025-2030 (%)
Data Table on Global Market: Year-over-year growth 2025-2030 (%)

5. Historic Market Size

5.1 Global Alpha Methylstyrene Market 2020 - 2024

Historic Market Size - Data Table on Global Alpha Methylstyrene Market 2020 - 2024 ($ thousand)

5.2 Type segment analysis 2020 - 2024

Historic Market Size - Type Segment 2020 - 2024 ($ thousand)

5.3 End-user segment analysis 2020 - 2024

Historic Market Size - End-user Segment 2020 - 2024 ($ thousand)

5.4 Application segment analysis 2020 - 2024

Historic Market Size - Application Segment 2020 - 2024 ($ thousand)

5.5 Geography segment analysis 2020 - 2024

Historic Market Size - Geography Segment 2020 - 2024 ($ thousand)

5.6 Country segment analysis 2020 - 2024

Historic Market Size - Country Segment 2020 - 2024 ($ thousand)

6. Qualitative Analysis

6.1 Impact of AI on global alpha methylstyrene market

6.2 Impact of geopolitical conflicts on global alpha methylstyrene market

7. Five Forces Analysis

7.1 Five forces summary

Five forces analysis - Comparison between 2025 and 2030

7.2 Bargaining power of buyers

Bargaining power of buyers - Impact of key factors 2025 and 2030

7.3 Bargaining power of suppliers

Bargaining power of suppliers - Impact of key factors in 2025 and 2030

7.4 Threat of new entrants

Threat of new entrants - Impact of key factors in 2025 and 2030

7.5 Threat of substitutes

Threat of substitutes - Impact of key factors in 2025 and 2030

7.6 Threat of rivalry

Threat of rivalry - Impact of key factors in 2025 and 2030

7.7 Market condition

Chart on Market condition - Five forces 2025 and 2030

8. Market Segmentation by Type

8.1 Market segments

Chart on Type - Market share 2025-2030 (%)
Data Table on Type - Market share 2025-2030 (%)

8.2 Comparison by Type

Chart on Comparison by Type
Data Table on Comparison by Type

8.3 Assay above 99 percent - Market size and forecast 2025-2030

Chart on Assay above 99 percent - Market size and forecast 2025-2030 ($ thousand)
Data Table on Assay above 99 percent - Market size and forecast 2025-2030 ($ thousand)
Chart on Assay above 99 percent - Year-over-year growth 2025-2030 (%)
Data Table on Assay above 99 percent - Year-over-year growth 2025-2030 (%)

8.4 Assay up to 99 percent - Market size and forecast 2025-2030

Chart on Assay up to 99 percent - Market size and forecast 2025-2030 ($ thousand)
Data Table on Assay up to 99 percent - Market size and forecast 2025-2030 ($ thousand)
Chart on Assay up to 99 percent - Year-over-year growth 2025-2030 (%)
Data Table on Assay up to 99 percent - Year-over-year growth 2025-2030 (%)

8.5 Market opportunity by Type

Market opportunity by Type ($ thousand)
Data Table on Market opportunity by Type ($ thousand)

9. Market Segmentation by End-user

9.1 Market segments

Chart on End-user - Market share 2025-2030 (%)
Data Table on End-user - Market share 2025-2030 (%)

9.2 Comparison by End-user

Chart on Comparison by End-user
Data Table on Comparison by End-user

9.3 Automobile - Market size and forecast 2025-2030

Chart on Automobile - Market size and forecast 2025-2030 ($ thousand)
Data Table on Automobile - Market size and forecast 2025-2030 ($ thousand)
Chart on Automobile - Year-over-year growth 2025-2030 (%)
Data Table on Automobile - Year-over-year growth 2025-2030 (%)

9.4 Electronics - Market size and forecast 2025-2030

Chart on Electronics - Market size and forecast 2025-2030 ($ thousand)
Data Table on Electronics - Market size and forecast 2025-2030 ($ thousand)
Chart on Electronics - Year-over-year growth 2025-2030 (%)
Data Table on Electronics - Year-over-year growth 2025-2030 (%)

9.5 Plastics - Market size and forecast 2025-2030

Chart on Plastics - Market size and forecast 2025-2030 ($ thousand)
Data Table on Plastics - Market size and forecast 2025-2030 ($ thousand)
Chart on Plastics - Year-over-year growth 2025-2030 (%)
Data Table on Plastics - Year-over-year growth 2025-2030 (%)

9.6 Chemicals - Market size and forecast 2025-2030

Chart on Chemicals - Market size and forecast 2025-2030 ($ thousand)
Data Table on Chemicals - Market size and forecast 2025-2030 ($ thousand)
Chart on Chemicals - Year-over-year growth 2025-2030 (%)
Data Table on Chemicals - Year-over-year growth 2025-2030 (%)

9.7 Others - Market size and forecast 2025-2030

Chart on Others - Market size and forecast 2025-2030 ($ thousand)
Data Table on Others - Market size and forecast 2025-2030 ($ thousand)
Chart on Others - Year-over-year growth 2025-2030 (%)
Data Table on Others - Year-over-year growth 2025-2030 (%)

9.8 Market opportunity by End-user

Market opportunity by End-user ($ thousand)
Data Table on Market opportunity by End-user ($ thousand)

10. Market Segmentation by Application

10.1 Market segments

Chart on Application - Market share 2025-2030 (%)
Data Table on Application - Market share 2025-2030 (%)

10.2 Comparison by Application

Chart on Comparison by Application
Data Table on Comparison by Application

10.3 ABS manufacture - Market size and forecast 2025-2030

Chart on ABS manufacture - Market size and forecast 2025-2030 ($ thousand)
Data Table on ABS manufacture - Market size and forecast 2025-2030 ($ thousand)
Chart on ABS manufacture - Year-over-year growth 2025-2030 (%)
Data Table on ABS manufacture - Year-over-year growth 2025-2030 (%)

10.4 Plastic additives and intermediates - Market size and forecast 2025-2030

Chart on Plastic additives and intermediates - Market size and forecast 2025-2030 ($ thousand)
Data Table on Plastic additives and intermediates - Market size and forecast 2025-2030 ($ thousand)
Chart on Plastic additives and intermediates - Year-over-year growth 2025-2030 (%)
Data Table on Plastic additives and intermediates - Year-over-year growth 2025-2030 (%)

10.5 Adhesives - Market size and forecast 2025-2030

Chart on Adhesives - Market size and forecast 2025-2030 ($ thousand)
Data Table on Adhesives - Market size and forecast 2025-2030 ($ thousand)
Chart on Adhesives - Year-over-year growth 2025-2030 (%)
Data Table on Adhesives - Year-over-year growth 2025-2030 (%)

10.6 Coatings - Market size and forecast 2025-2030

Chart on Coatings - Market size and forecast 2025-2030 ($ thousand)
Data Table on Coatings - Market size and forecast 2025-2030 ($ thousand)
Chart on Coatings - Year-over-year growth 2025-2030 (%)
Data Table on Coatings - Year-over-year growth 2025-2030 (%)

10.7 Others - Market size and forecast 2025-2030

Chart on Others - Market size and forecast 2025-2030 ($ thousand)
Data Table on Others - Market size and forecast 2025-2030 ($ thousand)
Chart on Others - Year-over-year growth 2025-2030 (%)
Data Table on Others - Year-over-year growth 2025-2030 (%)

10.8 Market opportunity by Application

Market opportunity by Application ($ thousand)
Data Table on Market opportunity by Application ($ thousand)

11. Customer Landscape

11.1 Customer landscape overview

Analysis of price sensitivity, lifecycle, customer purchase basket, adoption rates, and purchase criteria

12. Geographic Landscape

12.1 Geographic segmentation

Chart on Market share by geography 2025-2030 (%)
Data Table on Market share by geography 2025-2030 (%)

12.2 Geographic comparison

Chart on Geographic comparison
Data Table on Geographic comparison

12.3 APAC - Market size and forecast 2025-2030

Chart on APAC - Market size and forecast 2025-2030 ($ thousand)
Data Table on APAC - Market size and forecast 2025-2030 ($ thousand)
Chart on APAC - Year-over-year growth 2025-2030 (%)
Data Table on APAC - Year-over-year growth 2025-2030 (%)
Chart on Regional Comparison - APAC
Data Table on Regional Comparison - APAC

12.3.1 China - Market size and forecast 2025-2030

Chart on China - Market size and forecast 2025-2030 ($ thousand)
Data Table on China - Market size and forecast 2025-2030 ($ thousand)
Chart on China - Year-over-year growth 2025-2030 (%)
Data Table on China - Year-over-year growth 2025-2030 (%)

12.3.2 Japan - Market size and forecast 2025-2030

Chart on Japan - Market size and forecast 2025-2030 ($ thousand)
Data Table on Japan - Market size and forecast 2025-2030 ($ thousand)
Chart on Japan - Year-over-year growth 2025-2030 (%)
Data Table on Japan - Year-over-year growth 2025-2030 (%)

12.3.3 India - Market size and forecast 2025-2030

Chart on India - Market size and forecast 2025-2030 ($ thousand)
Data Table on India - Market size and forecast 2025-2030 ($ thousand)
Chart on India - Year-over-year growth 2025-2030 (%)
Data Table on India - Year-over-year growth 2025-2030 (%)

12.3.4 South Korea - Market size and forecast 2025-2030

Chart on South Korea - Market size and forecast 2025-2030 ($ thousand)
Data Table on South Korea - Market size and forecast 2025-2030 ($ thousand)
Chart on South Korea - Year-over-year growth 2025-2030 (%)
Data Table on South Korea - Year-over-year growth 2025-2030 (%)

12.3.5 Taiwan - Market size and forecast 2025-2030

Chart on Taiwan - Market size and forecast 2025-2030 ($ thousand)
Data Table on Taiwan - Market size and forecast 2025-2030 ($ thousand)
Chart on Taiwan - Year-over-year growth 2025-2030 (%)
Data Table on Taiwan - Year-over-year growth 2025-2030 (%)

12.3.6 Australia - Market size and forecast 2025-2030

Chart on Australia - Market size and forecast 2025-2030 ($ thousand)
Data Table on Australia - Market size and forecast 2025-2030 ($ thousand)
Chart on Australia - Year-over-year growth 2025-2030 (%)
Data Table on Australia - Year-over-year growth 2025-2030 (%)

12.4 Europe - Market size and forecast 2025-2030

Chart on Europe - Market size and forecast 2025-2030 ($ thousand)
Data Table on Europe - Market size and forecast 2025-2030 ($ thousand)
Chart on Europe - Year-over-year growth 2025-2030 (%)
Data Table on Europe - Year-over-year growth 2025-2030 (%)
Chart on Regional Comparison - Europe
Data Table on Regional Comparison - Europe

12.4.1 Germany - Market size and forecast 2025-2030

Chart on Germany - Market size and forecast 2025-2030 ($ thousand)
Data Table on Germany - Market size and forecast 2025-2030 ($ thousand)
Chart on Germany - Year-over-year growth 2025-2030 (%)
Data Table on Germany - Year-over-year growth 2025-2030 (%)

12.4.2 France - Market size and forecast 2025-2030

Chart on France - Market size and forecast 2025-2030 ($ thousand)
Data Table on France - Market size and forecast 2025-2030 ($ thousand)
Chart on France - Year-over-year growth 2025-2030 (%)
Data Table on France - Year-over-year growth 2025-2030 (%)

12.4.3 Italy - Market size and forecast 2025-2030

Chart on Italy - Market size and forecast 2025-2030 ($ thousand)
Data Table on Italy - Market size and forecast 2025-2030 ($ thousand)
Chart on Italy - Year-over-year growth 2025-2030 (%)
Data Table on Italy - Year-over-year growth 2025-2030 (%)

12.4.4 UK - Market size and forecast 2025-2030

Chart on UK - Market size and forecast 2025-2030 ($ thousand)
Data Table on UK - Market size and forecast 2025-2030 ($ thousand)
Chart on UK - Year-over-year growth 2025-2030 (%)
Data Table on UK - Year-over-year growth 2025-2030 (%)

12.4.5 Spain - Market size and forecast 2025-2030

Chart on Spain - Market size and forecast 2025-2030 ($ thousand)
Data Table on Spain - Market size and forecast 2025-2030 ($ thousand)
Chart on Spain - Year-over-year growth 2025-2030 (%)
Data Table on Spain - Year-over-year growth 2025-2030 (%)

12.4.6 The Netherlands - Market size and forecast 2025-2030

Chart on The Netherlands - Market size and forecast 2025-2030 ($ thousand)
Data Table on The Netherlands - Market size and forecast 2025-2030 ($ thousand)
Chart on The Netherlands - Year-over-year growth 2025-2030 (%)
Data Table on The Netherlands - Year-over-year growth 2025-2030 (%)

12.5 North America - Market size and forecast 2025-2030

Chart on North America - Market size and forecast 2025-2030 ($ thousand)
Data Table on North America - Market size and forecast 2025-2030 ($ thousand)
Chart on North America - Year-over-year growth 2025-2030 (%)
Data Table on North America - Year-over-year growth 2025-2030 (%)
Chart on Regional Comparison - North America
Data Table on Regional Comparison - North America

12.5.1 US - Market size and forecast 2025-2030

Chart on US - Market size and forecast 2025-2030 ($ thousand)
Data Table on US - Market size and forecast 2025-2030 ($ thousand)
Chart on US - Year-over-year growth 2025-2030 (%)
Data Table on US - Year-over-year growth 2025-2030 (%)

12.5.2 Canada - Market size and forecast 2025-2030

Chart on Canada - Market size and forecast 2025-2030 ($ thousand)
Data Table on Canada - Market size and forecast 2025-2030 ($ thousand)
Chart on Canada - Year-over-year growth 2025-2030 (%)
Data Table on Canada - Year-over-year growth 2025-2030 (%)

12.5.3 Mexico - Market size and forecast 2025-2030

Chart on Mexico - Market size and forecast 2025-2030 ($ thousand)
Data Table on Mexico - Market size and forecast 2025-2030 ($ thousand)
Chart on Mexico - Year-over-year growth 2025-2030 (%)
Data Table on Mexico - Year-over-year growth 2025-2030 (%)

12.6 South America - Market size and forecast 2025-2030

Chart on South America - Market size and forecast 2025-2030 ($ thousand)
Data Table on South America - Market size and forecast 2025-2030 ($ thousand)
Chart on South America - Year-over-year growth 2025-2030 (%)
Data Table on South America - Year-over-year growth 2025-2030 (%)
Chart on Regional Comparison - South America
Data Table on Regional Comparison - South America

12.6.1 Brazil - Market size and forecast 2025-2030

Chart on Brazil - Market size and forecast 2025-2030 ($ thousand)
Data Table on Brazil - Market size and forecast 2025-2030 ($ thousand)
Chart on Brazil - Year-over-year growth 2025-2030 (%)
Data Table on Brazil - Year-over-year growth 2025-2030 (%)

12.6.2 Argentina - Market size and forecast 2025-2030

Chart on Argentina - Market size and forecast 2025-2030 ($ thousand)
Data Table on Argentina - Market size and forecast 2025-2030 ($ thousand)
Chart on Argentina - Year-over-year growth 2025-2030 (%)
Data Table on Argentina - Year-over-year growth 2025-2030 (%)

12.6.3 Chile - Market size and forecast 2025-2030

Chart on Chile - Market size and forecast 2025-2030 ($ thousand)
Data Table on Chile - Market size and forecast 2025-2030 ($ thousand)
Chart on Chile - Year-over-year growth 2025-2030 (%)
Data Table on Chile - Year-over-year growth 2025-2030 (%)

12.7 Middle East and Africa - Market size and forecast 2025-2030

Chart on Middle East and Africa - Market size and forecast 2025-2030 ($ thousand)
Data Table on Middle East and Africa - Market size and forecast 2025-2030 ($ thousand)
Chart on Middle East and Africa - Year-over-year growth 2025-2030 (%)
Data Table on Middle East and Africa - Year-over-year growth 2025-2030 (%)
Chart on Regional Comparison - Middle East and Africa
Data Table on Regional Comparison - Middle East and Africa

12.7.1 Saudi Arabia - Market size and forecast 2025-2030

Chart on Saudi Arabia - Market size and forecast 2025-2030 ($ thousand)
Data Table on Saudi Arabia - Market size and forecast 2025-2030 ($ thousand)
Chart on Saudi Arabia - Year-over-year growth 2025-2030 (%)
Data Table on Saudi Arabia - Year-over-year growth 2025-2030 (%)

12.7.2 South Africa - Market size and forecast 2025-2030

Chart on South Africa - Market size and forecast 2025-2030 ($ thousand)
Data Table on South Africa - Market size and forecast 2025-2030 ($ thousand)
Chart on South Africa - Year-over-year growth 2025-2030 (%)
Data Table on South Africa - Year-over-year growth 2025-2030 (%)

12.7.3 UAE - Market size and forecast 2025-2030

Chart on UAE - Market size and forecast 2025-2030 ($ thousand)
Data Table on UAE - Market size and forecast 2025-2030 ($ thousand)
Chart on UAE - Year-over-year growth 2025-2030 (%)
Data Table on UAE - Year-over-year growth 2025-2030 (%)

12.7.4 Turkey - Market size and forecast 2025-2030

Chart on Turkey - Market size and forecast 2025-2030 ($ thousand)
Data Table on Turkey - Market size and forecast 2025-2030 ($ thousand)
Chart on Turkey - Year-over-year growth 2025-2030 (%)
Data Table on Turkey - Year-over-year growth 2025-2030 (%)

12.7.5 Egypt - Market size and forecast 2025-2030

Chart on Egypt - Market size and forecast 2025-2030 ($ thousand)
Data Table on Egypt - Market size and forecast 2025-2030 ($ thousand)
Chart on Egypt - Year-over-year growth 2025-2030 (%)
Data Table on Egypt - Year-over-year growth 2025-2030 (%)

12.8 Market opportunity by geography

Market opportunity by geography ($ thousand)
Data Tables on Market opportunity by geography ($ thousand)

13. Drivers, Challenges, and Opportunity

13.1 Market drivers

Rising automotive demand drives consumption of heat resistant styrenic polymers
Expanding specialty adhesive production boosts requirement for polymer modification agents
Surging high purity chemical intermediate demand accelerates global polymer market

13.2 Market challenges

Volatile feedstock costs impair operational stability across global chemical manufacturing
Stringent environmental regulations limit volatile organic compound emissions in plants
Downstream polymeric substitutes threaten long term market growth potential worldwide

13.3 Impact of drivers and challenges

Impact of drivers and challenges in 2025 and 2030

13.4 Market opportunities

Advanced zeolite catalyst adoption optimizes synthetic yields and energy efficiency
Growing synthetic wax utilization enhances gloss and durability in coatings
Strategic plant expansions strengthen regional supply networks and manufacturing capacities

14. Competitive Landscape

14.1 Overview

14.2

Overview on criticality of inputs and factors of differentiation

14.3 Landscape disruption

Overview on factors of disruption

14.4 Industry risks

Impact of key risks on business

15. Competitive Analysis

15.1 Companies profiled

Companies covered

15.2 Company ranking index

15.3 Market positioning of companies

Matrix on companies position and classification

15.4 AdvanSix Inc.

AdvanSix Inc. - Overview
AdvanSix Inc. - Business segments
AdvanSix Inc. - Key offerings
AdvanSix Inc. - Segment focus
SWOT

15.5 ALTIVIA

ALTIVIA - Overview
ALTIVIA - Product / Service
ALTIVIA - Key offerings
SWOT

15.6 Deepak Nitrite Ltd.

Deepak Nitrite Ltd. - Overview
Deepak Nitrite Ltd. - Business segments
Deepak Nitrite Ltd. - Key offerings
Deepak Nitrite Ltd. - Segment focus
SWOT

15.7 Domo Chemicals GmbH

Domo Chemicals GmbH - Overview
Domo Chemicals GmbH - Product / Service
Domo Chemicals GmbH - Key offerings
SWOT

15.8 Eni SpA

Eni SpA - Overview
Eni SpA - Business segments
Eni SpA - Key offerings
Eni SpA - Segment focus
SWOT

15.9 INEOS Group Holdings S.A.

INEOS Group Holdings S.A. - Overview
INEOS Group Holdings S.A. - Product / Service
INEOS Group Holdings S.A. - Key offerings
SWOT

15.10 Kraton Corp.

Kraton Corp. - Overview
Kraton Corp. - Product / Service
Kraton Corp. - Key offerings
SWOT

15.11 Kumho Chemicals Inc.

Kumho Chemicals Inc. - Overview
Kumho Chemicals Inc. - Product / Service
Kumho Chemicals Inc. - Key offerings
SWOT

15.12 LG Chem Ltd.

LG Chem Ltd. - Overview
LG Chem Ltd. - Business segments
LG Chem Ltd. - Key offerings
LG Chem Ltd. - Segment focus
SWOT

15.13 McDermott International Ltd.

McDermott International Ltd. - Overview
McDermott International Ltd. - Product / Service
McDermott International Ltd. - Key offerings
SWOT

15.14 MOEVE S.A.

MOEVE S.A. - Overview
MOEVE S.A. - Product / Service
MOEVE S.A. - Key offerings
SWOT

15.15 Rosneft Oil Co.

Rosneft Oil Co. - Overview
Rosneft Oil Co. - Business segments
Rosneft Oil Co. - Key offerings
Rosneft Oil Co. - Segment focus
SWOT

15.16 Solvay SA

Solvay SA - Overview
Solvay SA - Business segments
Solvay SA - Key offerings
Solvay SA - Segment focus
SWOT

15.17 The Mitsubishi Chemical Group

The Mitsubishi Chemical Group - Overview
The Mitsubishi Chemical Group - Business segments
The Mitsubishi Chemical Group - Key news
The Mitsubishi Chemical Group - Key offerings
The Mitsubishi Chemical Group - Segment focus
SWOT

15.18 Thermo Fisher Scientific Inc.

Thermo Fisher Scientific Inc. - Overview
Thermo Fisher Scientific Inc. - Business segments
Thermo Fisher Scientific Inc. - Key news
Thermo Fisher Scientific Inc. - Key offerings
Thermo Fisher Scientific Inc. - Segment focus
SWOT

16. Appendix

16.1 Scope of the report

Market definition
Objectives
Notes and caveats

16.2 Inclusions and exclusions checklist

Inclusions checklist
Exclusions checklist

16.3 Currency conversion rates for US$

16.4 Research methodology

16.5 Data procurement

Information sources

16.6 Data validation

16.7 Validation techniques employed for market sizing

16.8 Data synthesis

16.9 360 degree market analysis

16.10 List of abbreviations

Research Methodology

Technavio presents a detailed picture of the market by way of study, synthesis, and summation of data from multiple sources. The analysts have presented the various facets of the market with a particular focus on identifying the key industry influencers. The data thus presented is comprehensive, reliable, and the result of extensive research, both primary and secondary.

INFORMATION SOURCES

Primary sources

  • Manufacturers and suppliers
  • Channel partners
  • Industry experts
  • Strategic decision makers

Secondary sources

  • Industry journals and periodicals
  • Government data
  • Financial reports of key industry players
  • Historical data
  • Press releases

DATA ANALYSIS

Data Synthesis

  • Collation of data
  • Estimation of key figures
  • Analysis of derived insights

Data Validation

  • Triangulation with data models
  • Reference against proprietary databases
  • Corroboration with industry experts

REPORT WRITING

Qualitative

  • Market drivers
  • Market challenges
  • Market trends
  • Five forces analysis

Quantitative

  • Market size and forecast
  • Market segmentation
  • Geographical insights
  • Competitive landscape

Interested in this report?

Get your sample now to see our research methodology and insights!

Download Now

Frequently Asked Questions

Alpha Methylstyrene market growth will increase by USD 65683.5 thousand thousand during 2026-2030.

The Alpha Methylstyrene market is expected to grow at a CAGR of 2.4% during 2026-2030.

Alpha Methylstyrene market is segmented by Type (Assay above 99 percent, Assay up to 99 percent) End-user (Automobile, Electronics, Plastics, Chemicals, Others) Application (ABS manufacture, Plastic additives and intermediates, Adhesives, Coatings, Others)

AdvanSix Inc., ALTIVIA, Deepak Nitrite Ltd., Domo Chemicals GmbH, Eni SpA, INEOS Group Holdings S.A., Kraton Corp., Kumho Chemicals Inc., LG Chem Ltd., McDermott International Ltd., MOEVE S.A., Otto Chemie Pvt. Ltd., Prasol Chemicals Ltd., Rosneft Oil Co., SEQENS GROUP, SI Group Inc., SIBUR International GmbH, Solvay SA, The Mitsubishi Chemical Group, Thermo Fisher Scientific Inc. are a few of the key vendors in the Alpha Methylstyrene market.

APAC will register the highest growth rate of 51.6% among the other regions. Therefore, the Alpha Methylstyrene market in APAC is expected to garner significant business opportunities for the vendors during the forecast period.

China, Japan, India, South Korea, Taiwan, Australia, Germany, France, Italy, UK, Spain, The Netherlands, US, Canada, Mexico, Brazil, Argentina, Chile, Saudi Arabia, South Africa, UAE, Turkey, Egypt

  • Rising automotive demand drives consumption of heat resistant styrenic polymers is the driving factor this market.

The Alpha Methylstyrene market vendors should focus on grabbing business opportunities from the Type segment as it accounted for the largest market share in the base year.
RIA - Research AI Assistant
Ask RIA
