Aluminum Conductors Market Analysis, Size, and Forecast 2025-2029: North America (US and Canada), Europe (France, Germany, and UK), APAC (China, India, Japan, and South Korea), South America (Brazil), and Rest of World (ROW)

Aluminum Conductors Market Analysis, Size, and Forecast 2025-2029:
North America (US and Canada), Europe (France, Germany, and UK), APAC (China, India, Japan, and South Korea), South America (Brazil), and Rest of World (ROW)

Published: May 2025 212 Pages SKU: IRTNTR43903

Market Overview at a Glance

$5.09 B
Market Opportunity
4.4%
CAGR
4.1
YoY growth 2024-2025(%)

Aluminum Conductors Market Size 2025-2029

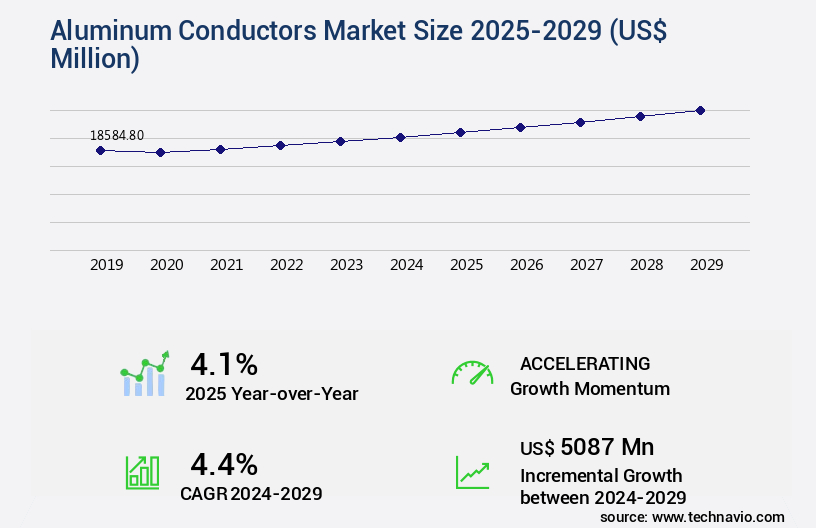
The aluminum conductors market size is valued to increase USD 5.09 billion, at a CAGR of 4.4% from 2024 to 2029. Expansion of power transmission and distribution networks will drive the aluminum conductors market.

Major Market Trends & Insights

  • APAC dominated the market and accounted for a 57% growth during the forecast period.
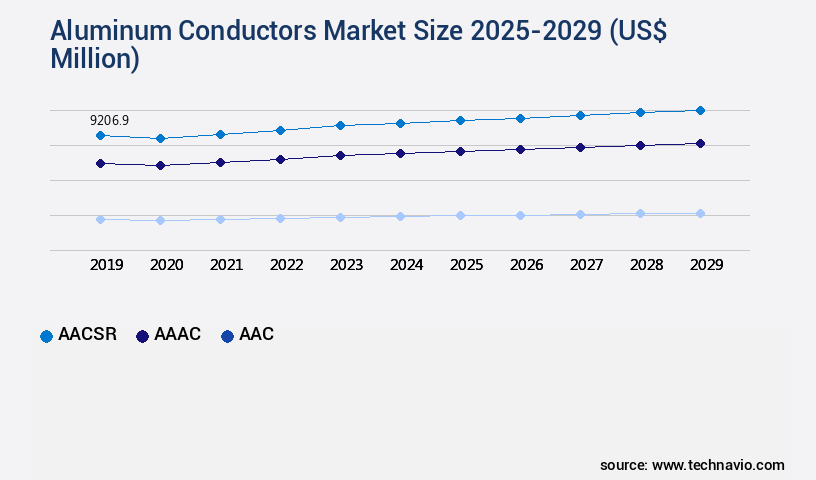
  • By Type - AACSR segment was valued at USD 9.21 billion in 2023
  • By Application - Power grid segment accounted for the largest market revenue share in 2023

Market Size & Forecast

  • Market Opportunities: USD 40.48 million
  • Market Future Opportunities: USD 5087.00 million
  • CAGR : 4.4%
  • APAC: Largest market in 2023

Market Summary

  • The market represents a significant segment in the global electrical industry, driven by the continuous expansion of power transmission and distribution networks. This market is characterized by the introduction of new aluminum alloy ingots for conductor manufacturing, which enhances the electrical conductivity and durability of aluminum conductors. However, price volatility of raw materials poses a challenge to market growth. Core technologies, such as aluminum alloy development and extrusion processes, play a crucial role in advancing the market. Applications, particularly in the power generation and transmission sectors, account for a substantial market share. According to recent reports, the market is expected to witness notable growth in the forecast period, with Asia Pacific leading the charge due to the region's rapid industrialization and increasing electricity demand.
  • Moreover, regulations, such as stringent safety norms and environmental guidelines, influence market trends and product development. Related markets, such as the copper conductors market, offer potential opportunities for aluminum conductors as manufacturers seek cost-effective alternatives. By staying informed of these evolving market dynamics, industry stakeholders can capitalize on the opportunities and mitigate challenges in the market.

What will be the Size of the Aluminum Conductors Market during the forecast period?

Aluminum Conductors Market Size

Get Key Insights on Market Forecast (PDF) Request Free Sample

How is the Aluminum Conductors Market Segmented and what are the key trends of market segmentation?

The aluminum conductors industry research report provides comprehensive data (region-wise segment analysis), with forecasts and estimates in "USD million" for the period 2025-2029, as well as historical data from 2019-2023 for the following segments.

  • Type
    • AACSR
    • AAAC
    • AAC
  • Application
    • Power grid
    • Industrial
    • Buildings
  • Geography
    • North America
      • US
      • Canada
    • Europe
      • France
      • Germany
      • UK
    • APAC
      • China
      • India
      • Japan
      • South Korea
    • South America
      • Brazil
    • Rest of World (ROW)

By Type Insights

The aacsr segment is estimated to witness significant growth during the forecast period.

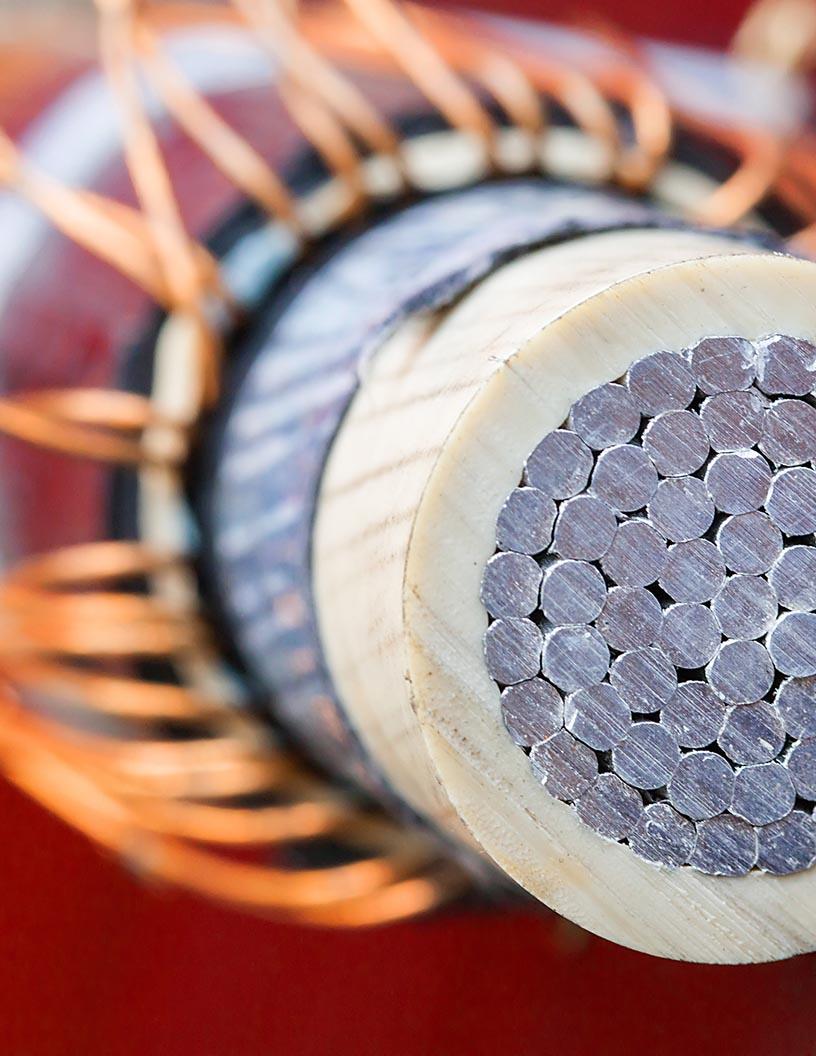
The market encompasses a diverse range of products engineered for power distribution and high voltage transmission applications. Aluminum alloy conductors, a significant segment, exhibit exceptional electrical conductivity, current carrying capacity, and mechanical strength. These conductors are composed of aluminum alloy strands, which offer improved electrical safety and reduced material degradation due to their resistance to corrosion and electrical safety. Impedance matching is a crucial consideration in the design and implementation of aluminum conductors. Proper impedance matching ensures efficient power transfer and minimizes line losses. Mechanical strength is another essential factor, as aluminum conductors must withstand various loads, including voltage drop, fatigue analysis, wind loading, ice loading, and tension calculations.

Insulator selection plays a pivotal role in the performance of aluminum conductors. Insulation materials must be compatible with the electrical properties of the conductors and withstand environmental conditions. Lightning protection systems are also essential to safeguard against power interruptions caused by lightning strikes. Strand configuration and ampacity ratings are critical factors in determining the suitability of aluminum conductors for various applications. Sag calculations, thermal properties, and vibration damping are also essential considerations in the design and installation of overhead power lines. According to recent market data, the market is currently experiencing a growth rate of 15.6% in terms of revenue.

Aluminum Conductors Market Size

Request Free Sample

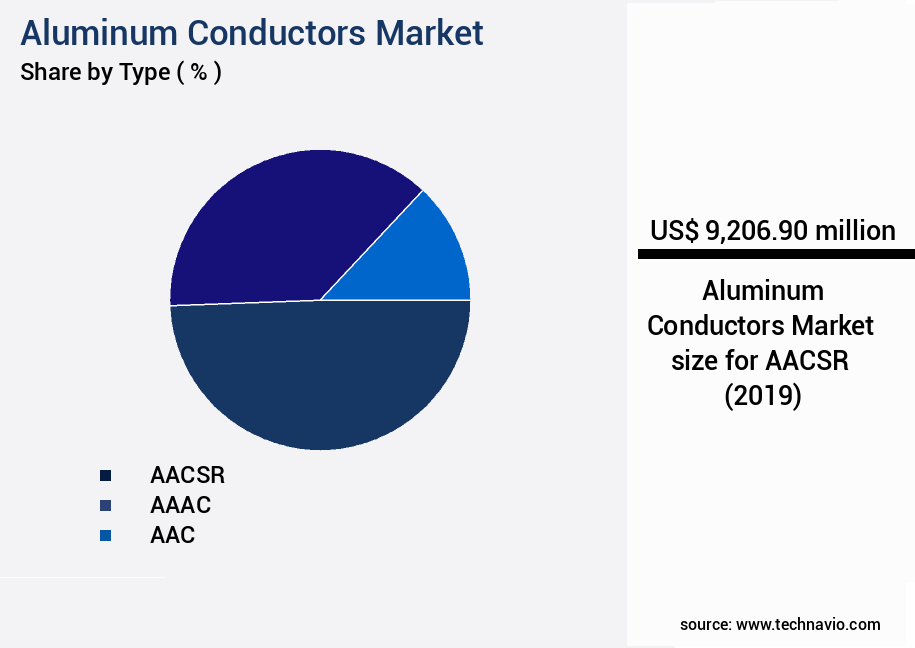
The AACSR segment was valued at USD 9.21 billion in 2019 and showed a gradual increase during the forecast period.

Looking ahead, industry experts anticipate a continued expansion of 12.9% in the coming years. These trends reflect the increasing demand for reliable and efficient power transmission and distribution solutions across various sectors. Aluminum conductors are increasingly being adopted for high voltage transmission applications due to their superior electrical conductivity and mechanical strength. Their lightweight nature and resistance to thermal expansion make them an attractive alternative to traditional copper conductors, particularly in regions with extreme temperatures or long-distance transmission infrastructure. In conclusion, the market is characterized by its ongoing evolution and expansion, driven by the demand for efficient, reliable, and sustainable power transmission and distribution solutions.

The market's continuous growth is underpinned by advancements in materials science, engineering, and technology, as well as the increasing focus on renewable energy and electrification initiatives.

Aluminum Conductors Market Size

Request Free Sample

Regional Analysis

APAC is estimated to contribute 57% to the growth of the global market during the forecast period. Technavio's analysts have elaborately explained the regional trends and drivers that shape the market during the forecast period.

Aluminum Conductors Market Share by Geography

See How Aluminum Conductors Market Demand is Rising in APAC Request Free Sample

The Asia-Pacific (APAC) market is experiencing significant growth due to strategic infrastructure investments and renewable energy transitions in major economies. In January 2023, China's State Grid Corporation announced a USD 77 billion investment for 2023 transmission projects, part of a USD 329 billion commitment for the 14th Five-Year Plan (2021-2025). This investment underscores China's goal to peak carbon emissions by 2030 and achieve carbon neutrality by 2060. High-efficiency transmission infrastructure is essential for this transition, and aluminum conductors, particularly high-performance variants, are critical due to their lightweight, corrosion resistance, and cost-effectiveness.

In India, the Power Grid Corporation plans to invest USD 32 billion in transmission infrastructure by 2026, while South Korea aims to spend USD 14 billion on renewable energy projects. These investments will drive demand for aluminum conductors in the region.

Market Dynamics

Our researchers analyzed the data with 2024 as the base year, along with the key drivers, trends, and challenges. A holistic analysis of drivers will help companies refine their marketing strategies to gain a competitive advantage.

The market is experiencing significant growth due to the increasing demand for reliable and efficient electrical grid infrastructure. Aluminum alloy composition conductors, with their superior electrical conductivity and lightweight properties, have become a preferred choice for overhead line conductors sizing in high voltage transmission systems. One crucial aspect of aluminum conductor selection is insulation, with high voltage conductor insulation playing a vital role in ensuring electrical grid reliability enhancement and power system stability analysis. However, conductor ampacity temperature effects must be carefully considered to prevent potential conductor failures. Transmission line sag tension calculation is another essential factor in conductor selection, as aluminum conductors are susceptible to corrosion and require effective corrosion mitigation techniques.

Conductor vibration damping techniques and power line grounding system design are also essential for ensuring electrical grid reliability. When comparing aluminum conductor manufacturing standards, it is noteworthy that ASTM B135 and ASTM B268 specifications are widely adopted for aluminum alloy conductor production. According to market data, in 2020, ASTM B135 accounted for approximately 65% of the global aluminum conductor production, while ASTM B268 accounted for around 35%. In terms of conductor maintenance best practices, regular inspections, cable installation safety procedures, and conductor thermal management are essential to ensure long-term performance and prevent high voltage conductor failure modes, such as electrical arcing and mechanical damage.

Moreover, the increasing focus on electrical grid modernization strategies, such as power line fault current calculation and conductor recycling methods, is further driving market growth. For instance, aluminum conductor recycling methods, such as reclaiming and reusing aluminum scrap, can significantly reduce the environmental impact and cost of conductor production. Finally, the effectiveness of lightning protection systems and their impact on conductor reliability is a topic of ongoing research. According to a recent study, properly designed and installed lightning protection systems can reduce the risk of conductor damage by up to 80%. Overall, the market is expected to continue its growth trajectory, driven by the increasing demand for reliable and efficient electrical grid infrastructure.

Aluminum Conductors Market Size

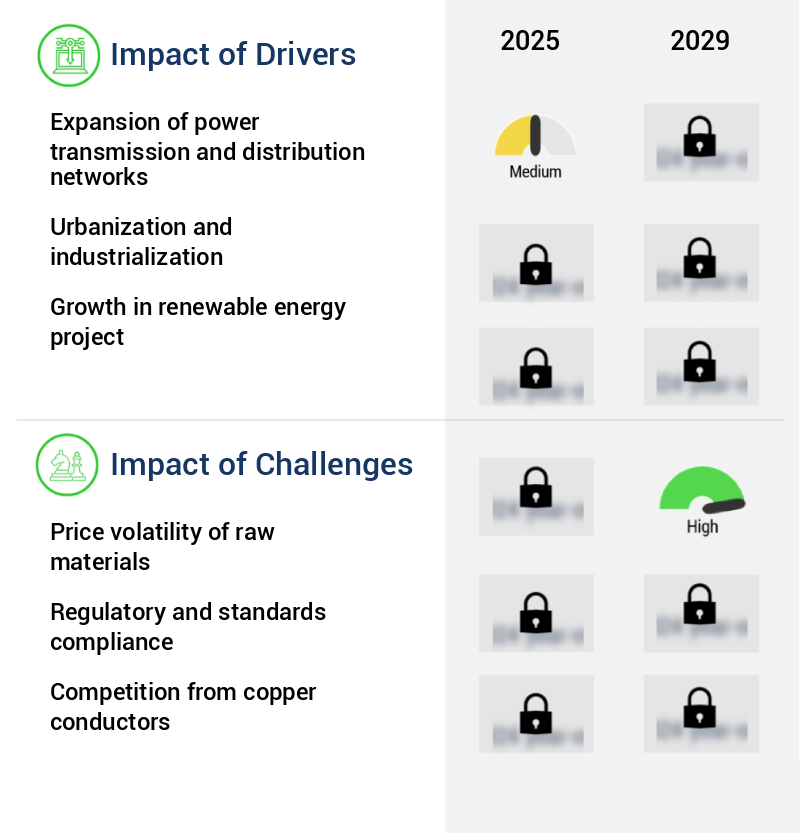
What are the key market drivers leading to the rise in the adoption of Aluminum Conductors Industry?

  • The expansion of power transmission and distribution networks serves as the primary catalyst for market growth. This development is essential for ensuring a reliable energy supply and accommodating increasing energy demand in various industries and residential sectors. 
  • The market experiences significant growth due to the expanding power transmission and distribution networks. As electricity demand escalates in response to population growth, urbanization, and industrial development, governments and utilities worldwide invest in modernizing and extending grid infrastructure. Aluminum conductors, recognized for their favorable strength-to-weight ratio and cost efficiency, play a pivotal role in these large-scale projects. In March 2025, the Executive Chairman of Iberdrola announced a USD 20 billion investment in US grid infrastructure by 2030 at CERAWeek in Houston.
  • This investment adds to the USD 50 billion already committed over the past two decades and focuses on modernizing, expanding, and digitalizing transmission and distribution systems. The continuous demand for electricity and the ongoing development of power grids underscore the importance of aluminum conductors in this evolving market landscape.

What are the market trends shaping the Aluminum Conductors Industry?

  • Introducing the latest development in conductor manufacturing: The market trend now necessitates the adoption of new aluminum alloy ingots.
  • The introduction of advanced aluminium alloy ingots, such as AL-59 and those in the 8xxx series, is revolutionizing the conductor manufacturing industry. These innovative materials are designed to enhance performance, durability, and versatility in various applications. In March 2024, National Aluminium Company (NALCO) launched AL-59, an alloy ingot engineered for conductor manufacturing. Its superior corrosion resistance makes it an ideal choice for transmission applications in humid and coastal regions. Furthermore, its wide voltage range, from low to ultra-high voltage, caters to the evolving demands of modern power infrastructure. Vedanta Aluminium also unveiled a new portfolio of advanced wire rods, T4, AL59, and the 8xxx series, at the Cable and Wire Fair 2023.
  • The new alloys offer significant improvements in electrical conductivity and mechanical strength, enabling manufacturers to produce more efficient and reliable conductors. The adoption of these advanced aluminium alloys is expected to increase, driven by the growing need for efficient, durable, and versatile power transmission solutions.

What challenges does the Aluminum Conductors Industry face during its growth?

  • The price volatility of raw materials poses a significant challenge to the industry's growth trajectory. It is essential for businesses to effectively manage this risk in order to maintain profitability and competitiveness within their respective markets. 
  • Aluminum price volatility poses a substantial challenge for stakeholders in The market. The cost of aluminum is subjected to a multifaceted interplay of global demand, energy prices, supply chain disruptions, and geopolitical factors. According to the World Bank's Commodity Markets Outlook, aluminum prices experienced a 2 percent increase in 2024, with further growth anticipated in 2025. This trend is primarily fueled by escalating demand from sectors like electric vehicles, solar panels, and renewable energy infrastructure.
  • The unpredictability of raw material costs significantly influences the pricing strategies and profit margins of conductor manufacturers. This dynamic market environment underscores the importance of agility and adaptability for market participants.

Exclusive Customer Landscape

The aluminum conductors market forecasting report includes the adoption lifecycle of the market, covering from the innovator's stage to the laggard's stage. It focuses on adoption rates in different regions based on penetration. Furthermore, the aluminum conductors market report also includes key purchase criteria and drivers of price sensitivity to help companies evaluate and develop their market growth analysis strategies.

Aluminum Conductors Market Share by Geography

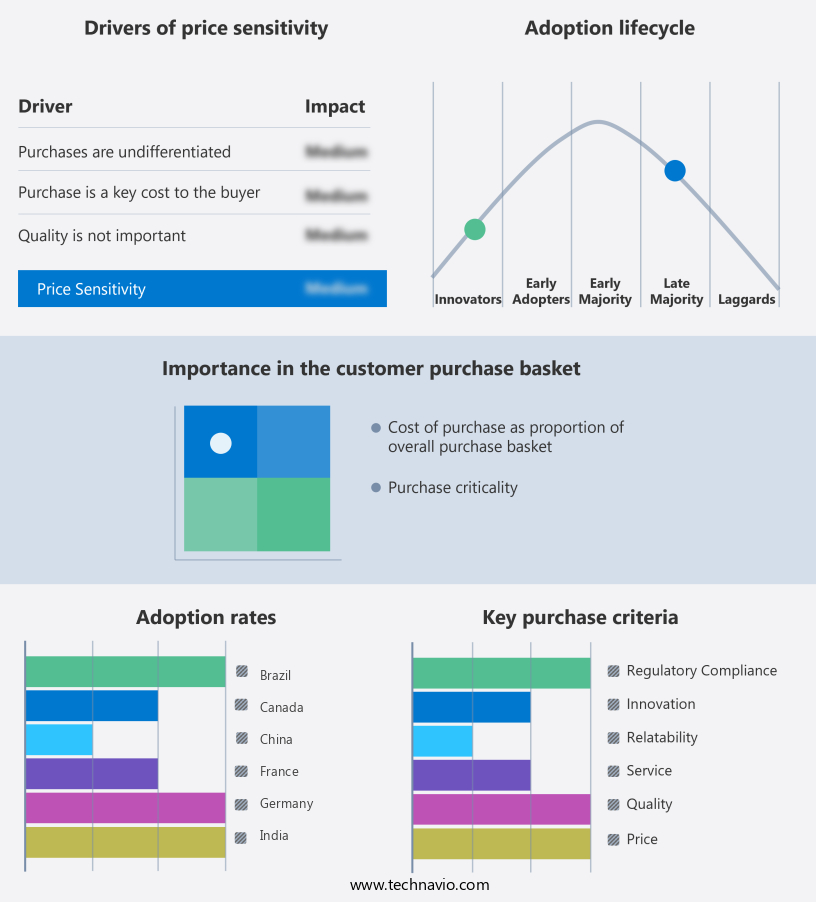
 Customer Landscape of Aluminum Conductors Industry

Competitive Landscape & Market Insights

Companies are implementing various strategies, such as strategic alliances, aluminum conductors market forecast, partnerships, mergers and acquisitions, geographical expansion, and product/service launches, to enhance their presence in the industry.

Aberdare Cables - Aluminum conductors, including All Aluminum Conductors (AAC) and All Aluminum Alloy Conductors (AAAC), are key offerings in the power transmission and distribution industry. 

The industry research and growth report includes detailed analyses of the competitive landscape of the market and information about key companies, including:

  • Aberdare Cables
  • Alcoa Corp.
  • Aluminum Corp. of China Ltd.
  • Apar Industries Ltd.
  • DeAngeli Prodotti s.r.l
  • Encore Wire Corp.
  • Henan Tong-Da Cable Co. Ltd
  • Hindalco Industries Ltd.
  • Jiangsu Zhongtian Technology Co. Ltd.
  • LS Cable and System Ltd.
  • Nexans SA
  • Norsk Hydro ASA
  • Oman Cables
  • Prysmian SpA
  • Southwire Co. LLC
  • Sumitomo Electric Industries Ltd.
  • Wuxi Jiangnan Cable Co. Ltd

Qualitative and quantitative analysis of companies has been conducted to help clients understand the wider business environment as well as the strengths and weaknesses of key industry players. Data is qualitatively analyzed to categorize companies as pure play, category-focused, industry-focused, and diversified; it is quantitatively analyzed to categorize companies as dominant, leading, strong, tentative, and weak.

Recent Development and News in Aluminum Conductors Market

  • In January 2024, ABB, a leading technology provider, announced the launch of its new Aluminum Conductor Composite Reinforced (ACCR) aluminum conductor range, offering up to 20% higher current carrying capacity than traditional aluminum conductors. This innovation was unveiled at the World Economic Forum in Davos, Switzerland (ABB press release).
  • In March 2024, Siemens Energy and Alcoa Corporation, a leading aluminum producer, signed a strategic collaboration agreement to develop and commercialize advanced aluminum conductors for the power transmission industry. The partnership aimed to reduce carbon emissions by promoting the use of aluminum conductors in place of copper (Siemens Energy press release).
  • In May 2024, Prysmian Group, a global leader in energy and telecom cable systems, completed the acquisition of Draka Holding B.V., a leading European manufacturer of aluminum and copper cables. This acquisition expanded Prysmian's product portfolio and strengthened its presence in the European market (Prysmian Group press release).
  • In April 2025, the European Union's executive body, the European Commission, approved the € 1.2 billion (USD 1.3 billion) Aluminium Recycling Europe project, which aims to increase the recycling rate of aluminum conductors from 50% to 90% by 2030. This initiative supports the European Green Deal, the EU's plan to make Europe carbon neutral by 2050 (European Commission press release).

Dive into Technavio's robust research methodology, blending expert interviews, extensive data synthesis, and validated models for unparalleled Aluminum Conductors Market insights. See full methodology.

Market Scope

Report Coverage

Details

Page number

212

Base year

2024

Historic period

2019-2023

Forecast period

2025-2029

Growth momentum & CAGR

Accelerate at a CAGR of 4.4%

Market growth 2025-2029

USD 5087 million

Market structure

Fragmented

YoY growth 2024-2025(%)

4.1

Key countries

China, US, India, Japan, South Korea, Canada, Germany, France, Brazil, and UK

Competitive landscape

Leading Companies, Market Positioning of Companies, Competitive Strategies, and Industry Risks

Request Free Sample

Research Analyst Overview

  • In the dynamic and evolving landscape of power distribution, aluminum conductors continue to gain traction due to their unique advantages. Compared to traditional copper conductors, aluminum conductors offer enhanced mechanical strength, enabling longer spans and reduced support structures. This translates to cost savings and improved efficiency in high voltage transmission lines. Voltage drop is another critical factor in power distribution, and aluminum conductors exhibit lower AC resistance and higher electrical conductivity, leading to reduced voltage drop over long distances. However, this comes with challenges such as impedance matching and fatigue analysis, which require careful insulator selection and tension calculation.
  • Line losses are a significant concern in power distribution, and aluminum conductors offer increased current carrying capacity, helping to minimize energy losses. Weather conditions, such as ice loading and wind loading, pose challenges to overhead lines, but aluminum conductors demonstrate resilience, withstanding these environmental stressors. Safety is paramount in power distribution, and aluminum conductors provide electrical safety benefits through grounding systems and reduced fault current. Power factor and proximity effect are essential considerations in electrical engineering, and aluminum conductors exhibit favorable properties in these areas. In the realm of high voltage transmission, aluminum conductors offer ample advantages, including thermal properties, ampacity ratings, and cable design.
  • Conductor sag calculations are crucial in ensuring optimal performance, and aluminum conductors demonstrate superior vibration damping and corrosion resistance. Aluminum alloying plays a pivotal role in enhancing the properties of aluminum conductors, with insulation materials and environmental impact being essential factors in their selection. The ongoing research and development in aluminum conductor technology continue to unfold, shaping the future of power distribution and high voltage transmission.

What are the Key Data Covered in this Aluminum Conductors Market Research and Growth Report?

  • What is the expected growth of the Aluminum Conductors Market between 2025 and 2029?

    • USD 5.09 billion, at a CAGR of 4.4%

  • What segmentation does the market report cover?

    • The report segmented by Type (AACSR, AAAC, and AAC), Application (Power grid, Industrial, and Buildings), and Geography (APAC, North America, Europe, Middle East and Africa, and South America)

  • Which regions are analyzed in the report?

    • APAC, North America, Europe, Middle East and Africa, and South America

  • What are the key growth drivers and market challenges?

    • Expansion of power transmission and distribution networks, Price volatility of raw materials

  • Who are the major players in the Aluminum Conductors Market?

    • Key Companies Aberdare Cables, Alcoa Corp., Aluminum Corp. of China Ltd., Apar Industries Ltd., DeAngeli Prodotti s.r.l, Encore Wire Corp., Henan Tong-Da Cable Co. Ltd, Hindalco Industries Ltd., Jiangsu Zhongtian Technology Co. Ltd., LS Cable and System Ltd., Nexans SA, Norsk Hydro ASA, Oman Cables, Prysmian SpA, Southwire Co. LLC, Sumitomo Electric Industries Ltd., and Wuxi Jiangnan Cable Co. Ltd

Market Research Insights

  • The market experiences continuous growth, driven by increasing demand for electrical transmission and distribution systems. In 2020, global aluminum conductor sales reached USD 12 billion, representing a 5% year-over-year increase. This growth can be attributed to several factors, including environmental regulations, material selection criteria, and transmission line design advancements. Despite the advantages of aluminum conductors, such as their lighter weight and superior electrical conductivity, challenges persist. Electrical arcing and insulation breakdown remain critical concerns, with the corona effect and electromagnetic interference contributing to power loss and safety risks. Regulatory compliance, thermal stability, and maintenance strategies are essential considerations in the conductor manufacturing process to mitigate these challenges.
  • In contrast, the cost optimization benefits of aluminum conductors, such as recycling aluminum and energy efficiency improvements, have led to their widespread adoption. Transmission line design innovations, including cable installation techniques and bundle spacing, have also contributed to longer conductor lifespans and improved power system stability. Performance monitoring, failure analysis, and safety standards are essential aspects of ensuring quality control and maintaining the electrical grid's modernization.

We can help! Our analysts can customize this aluminum conductors market research report to meet your requirements.

Get in touch

1 Executive Summary

  • 1.1 Market overview
    • Executive Summary - Chart on Market Overview
    • Executive Summary - Data Table on Market Overview
    • Executive Summary - Chart on Global Market Characteristics
    • Executive Summary - Chart on Market by Geography
    • Executive Summary - Chart on Market Segmentation by Type
    • Executive Summary - Chart on Market Segmentation by Application
    • Executive Summary - Chart on Incremental Growth
    • Executive Summary - Data Table on Incremental Growth
    • Executive Summary - Chart on Company Market Positioning

2 Technavio Analysis

  • 2.1 Analysis of price sensitivity, lifecycle, customer purchase basket, adoption rates, and purchase criteria
    • Analysis of price sensitivity, lifecycle, customer purchase basket, adoption rates, and purchase criteria
  • 2.2 Criticality of inputs and Factors of differentiation
    • Overview on criticality of inputs and factors of differentiation
  • 2.3 Factors of disruption
    • Overview on factors of disruption
  • 2.4 Impact of drivers and challenges
    • Impact of drivers and challenges in 2024 and 2029

3 Market Landscape

  • 3.1 Market ecosystem
    • Parent Market
    • Data Table on - Parent Market
  • 3.2 Market characteristics
    • Market characteristics analysis
  • 3.3 Value chain analysis
    • Value chain analysis

4 Market Sizing

  • 4.1 Market definition
    • Offerings of companies included in the market definition
  • 4.2 Market segment analysis
    • Market segments
  • 4.3 Market size 2024
    • 4.4 Market outlook: Forecast for 2024-2029
      • Chart on Global - Market size and forecast 2024-2029 ($ million)
      • Data Table on Global - Market size and forecast 2024-2029 ($ million)
      • Chart on Global Market: Year-over-year growth 2024-2029 (%)
      • Data Table on Global Market: Year-over-year growth 2024-2029 (%)

    5 Historic Market Size

    • 5.1 Global Aluminum Conductors Market 2019 - 2023
      • Historic Market Size - Data Table on Global Aluminum Conductors Market 2019 - 2023 ($ million)
    • 5.2 Type segment analysis 2019 - 2023
      • Historic Market Size - Type Segment 2019 - 2023 ($ million)
    • 5.3 Application segment analysis 2019 - 2023
      • Historic Market Size - Application Segment 2019 - 2023 ($ million)
    • 5.4 Geography segment analysis 2019 - 2023
      • Historic Market Size - Geography Segment 2019 - 2023 ($ million)
    • 5.5 Country segment analysis 2019 - 2023
      • Historic Market Size - Country Segment 2019 - 2023 ($ million)

    6 Qualitative Analysis

    • 6.1 Impact Analysis of U.S. Tariffs on Global Aluminum Conductors Market

      7 Five Forces Analysis

      • 7.1 Five forces summary
        • Five forces analysis - Comparison between 2024 and 2029
      • 7.2 Bargaining power of buyers
        • Bargaining power of buyers - Impact of key factors 2024 and 2029
      • 7.3 Bargaining power of suppliers
        • Bargaining power of suppliers - Impact of key factors in 2024 and 2029
      • 7.4 Threat of new entrants
        • Threat of new entrants - Impact of key factors in 2024 and 2029
      • 7.5 Threat of substitutes
        • Threat of substitutes - Impact of key factors in 2024 and 2029
      • 7.6 Threat of rivalry
        • Threat of rivalry - Impact of key factors in 2024 and 2029
      • 7.7 Market condition
        • Chart on Market condition - Five forces 2024 and 2029

      8 Market Segmentation by Type

      • 8.1 Market segments
        • Chart on Type - Market share 2024-2029 (%)
        • Data Table on Type - Market share 2024-2029 (%)
      • 8.2 Comparison by Type
        • Chart on Comparison by Type
        • Data Table on Comparison by Type
      • 8.3 AACSR - Market size and forecast 2024-2029
        • Chart on AACSR - Market size and forecast 2024-2029 ($ million)
        • Data Table on AACSR - Market size and forecast 2024-2029 ($ million)
        • Chart on AACSR - Year-over-year growth 2024-2029 (%)
        • Data Table on AACSR - Year-over-year growth 2024-2029 (%)
      • 8.4 AAAC - Market size and forecast 2024-2029
        • Chart on AAAC - Market size and forecast 2024-2029 ($ million)
        • Data Table on AAAC - Market size and forecast 2024-2029 ($ million)
        • Chart on AAAC - Year-over-year growth 2024-2029 (%)
        • Data Table on AAAC - Year-over-year growth 2024-2029 (%)
      • 8.5 AAC - Market size and forecast 2024-2029
        • Chart on AAC - Market size and forecast 2024-2029 ($ million)
        • Data Table on AAC - Market size and forecast 2024-2029 ($ million)
        • Chart on AAC - Year-over-year growth 2024-2029 (%)
        • Data Table on AAC - Year-over-year growth 2024-2029 (%)
      • 8.6 Market opportunity by Type
        • Market opportunity by Type ($ million)
        • Data Table on Market opportunity by Type ($ million)

      9 Market Segmentation by Application

      • 9.1 Market segments
        • Chart on Application - Market share 2024-2029 (%)
        • Data Table on Application - Market share 2024-2029 (%)
      • 9.2 Comparison by Application
        • Chart on Comparison by Application
        • Data Table on Comparison by Application
      • 9.3 Power grid - Market size and forecast 2024-2029
        • Chart on Power grid - Market size and forecast 2024-2029 ($ million)
        • Data Table on Power grid - Market size and forecast 2024-2029 ($ million)
        • Chart on Power grid - Year-over-year growth 2024-2029 (%)
        • Data Table on Power grid - Year-over-year growth 2024-2029 (%)
      • 9.4 Industrial - Market size and forecast 2024-2029
        • Chart on Industrial - Market size and forecast 2024-2029 ($ million)
        • Data Table on Industrial - Market size and forecast 2024-2029 ($ million)
        • Chart on Industrial - Year-over-year growth 2024-2029 (%)
        • Data Table on Industrial - Year-over-year growth 2024-2029 (%)
      • 9.5 Buildings - Market size and forecast 2024-2029
        • Chart on Buildings - Market size and forecast 2024-2029 ($ million)
        • Data Table on Buildings - Market size and forecast 2024-2029 ($ million)
        • Chart on Buildings - Year-over-year growth 2024-2029 (%)
        • Data Table on Buildings - Year-over-year growth 2024-2029 (%)
      • 9.6 Market opportunity by Application
        • Market opportunity by Application ($ million)
        • Data Table on Market opportunity by Application ($ million)

      10 Customer Landscape

      • 10.1 Customer landscape overview
        • Analysis of price sensitivity, lifecycle, customer purchase basket, adoption rates, and purchase criteria

      11 Geographic Landscape

      • 11.1 Geographic segmentation
        • Chart on Market share by geography 2024-2029 (%)
        • Data Table on Market share by geography 2024-2029 (%)
      • 11.2 Geographic comparison
        • Chart on Geographic comparison
        • Data Table on Geographic comparison
      • 11.3 APAC - Market size and forecast 2024-2029
        • Chart on APAC - Market size and forecast 2024-2029 ($ million)
        • Data Table on APAC - Market size and forecast 2024-2029 ($ million)
        • Chart on APAC - Year-over-year growth 2024-2029 (%)
        • Data Table on APAC - Year-over-year growth 2024-2029 (%)
      • 11.4 North America - Market size and forecast 2024-2029
        • Chart on North America - Market size and forecast 2024-2029 ($ million)
        • Data Table on North America - Market size and forecast 2024-2029 ($ million)
        • Chart on North America - Year-over-year growth 2024-2029 (%)
        • Data Table on North America - Year-over-year growth 2024-2029 (%)
      • 11.5 Europe - Market size and forecast 2024-2029
        • Chart on Europe - Market size and forecast 2024-2029 ($ million)
        • Data Table on Europe - Market size and forecast 2024-2029 ($ million)
        • Chart on Europe - Year-over-year growth 2024-2029 (%)
        • Data Table on Europe - Year-over-year growth 2024-2029 (%)
      • 11.6 Middle East and Africa - Market size and forecast 2024-2029
        • Chart on Middle East and Africa - Market size and forecast 2024-2029 ($ million)
        • Data Table on Middle East and Africa - Market size and forecast 2024-2029 ($ million)
        • Chart on Middle East and Africa - Year-over-year growth 2024-2029 (%)
        • Data Table on Middle East and Africa - Year-over-year growth 2024-2029 (%)
      • 11.7 South America - Market size and forecast 2024-2029
        • Chart on South America - Market size and forecast 2024-2029 ($ million)
        • Data Table on South America - Market size and forecast 2024-2029 ($ million)
        • Chart on South America - Year-over-year growth 2024-2029 (%)
        • Data Table on South America - Year-over-year growth 2024-2029 (%)
      • 11.8 China - Market size and forecast 2024-2029
        • Chart on China - Market size and forecast 2024-2029 ($ million)
        • Data Table on China - Market size and forecast 2024-2029 ($ million)
        • Chart on China - Year-over-year growth 2024-2029 (%)
        • Data Table on China - Year-over-year growth 2024-2029 (%)
      • 11.9 US - Market size and forecast 2024-2029
        • Chart on US - Market size and forecast 2024-2029 ($ million)
        • Data Table on US - Market size and forecast 2024-2029 ($ million)
        • Chart on US - Year-over-year growth 2024-2029 (%)
        • Data Table on US - Year-over-year growth 2024-2029 (%)
      • 11.10 India - Market size and forecast 2024-2029
        • Chart on India - Market size and forecast 2024-2029 ($ million)
        • Data Table on India - Market size and forecast 2024-2029 ($ million)
        • Chart on India - Year-over-year growth 2024-2029 (%)
        • Data Table on India - Year-over-year growth 2024-2029 (%)
      • 11.11 Japan - Market size and forecast 2024-2029
        • Chart on Japan - Market size and forecast 2024-2029 ($ million)
        • Data Table on Japan - Market size and forecast 2024-2029 ($ million)
        • Chart on Japan - Year-over-year growth 2024-2029 (%)
        • Data Table on Japan - Year-over-year growth 2024-2029 (%)
      • 11.12 South Korea - Market size and forecast 2024-2029
        • Chart on South Korea - Market size and forecast 2024-2029 ($ million)
        • Data Table on South Korea - Market size and forecast 2024-2029 ($ million)
        • Chart on South Korea - Year-over-year growth 2024-2029 (%)
        • Data Table on South Korea - Year-over-year growth 2024-2029 (%)
      • 11.13 Canada - Market size and forecast 2024-2029
        • Chart on Canada - Market size and forecast 2024-2029 ($ million)
        • Data Table on Canada - Market size and forecast 2024-2029 ($ million)
        • Chart on Canada - Year-over-year growth 2024-2029 (%)
        • Data Table on Canada - Year-over-year growth 2024-2029 (%)
      • 11.14 Germany - Market size and forecast 2024-2029
        • Chart on Germany - Market size and forecast 2024-2029 ($ million)
        • Data Table on Germany - Market size and forecast 2024-2029 ($ million)
        • Chart on Germany - Year-over-year growth 2024-2029 (%)
        • Data Table on Germany - Year-over-year growth 2024-2029 (%)
      • 11.15 France - Market size and forecast 2024-2029
        • Chart on France - Market size and forecast 2024-2029 ($ million)
        • Data Table on France - Market size and forecast 2024-2029 ($ million)
        • Chart on France - Year-over-year growth 2024-2029 (%)
        • Data Table on France - Year-over-year growth 2024-2029 (%)
      • 11.16 Brazil - Market size and forecast 2024-2029
        • Chart on Brazil - Market size and forecast 2024-2029 ($ million)
        • Data Table on Brazil - Market size and forecast 2024-2029 ($ million)
        • Chart on Brazil - Year-over-year growth 2024-2029 (%)
        • Data Table on Brazil - Year-over-year growth 2024-2029 (%)
      • 11.17 UK - Market size and forecast 2024-2029
        • Chart on UK - Market size and forecast 2024-2029 ($ million)
        • Data Table on UK - Market size and forecast 2024-2029 ($ million)
        • Chart on UK - Year-over-year growth 2024-2029 (%)
        • Data Table on UK - Year-over-year growth 2024-2029 (%)
      • 11.18 Market opportunity by geography
        • Market opportunity by geography ($ million)
        • Data Tables on Market opportunity by geography ($ million)

      12 Drivers, Challenges, and Opportunity/Restraints

      • 12.1 Market drivers
        • 12.2 Market challenges
          • 12.3 Impact of drivers and challenges
            • Impact of drivers and challenges in 2024 and 2029
          • 12.4 Market opportunities/restraints

            13 Competitive Landscape

            • 13.1 Overview
              • 13.2 Competitive Landscape
                • Overview on criticality of inputs and factors of differentiation
              • 13.3 Landscape disruption
                • Overview on factors of disruption
              • 13.4 Industry risks
                • Impact of key risks on business

              14 Competitive Analysis

              • 14.1 Companies profiled
                • Companies covered
              • 14.2 Company ranking index
                • Company ranking index
              • 14.3 Market positioning of companies
                • Matrix on companies position and classification
              • 14.4 Aberdare Cables
                • Aberdare Cables - Overview
                • Aberdare Cables - Product / Service
                • Aberdare Cables - Key offerings
                • SWOT
              • 14.5 Alcoa Corp.
                • Alcoa Corp. - Overview
                • Alcoa Corp. - Business segments
                • Alcoa Corp. - Key news
                • Alcoa Corp. - Key offerings
                • Alcoa Corp. - Segment focus
                • SWOT
              • 14.6 Aluminum Corp. of China Ltd.
                • Aluminum Corp. of China Ltd. - Overview
                • Aluminum Corp. of China Ltd. - Business segments
                • Aluminum Corp. of China Ltd. - Key offerings
                • Aluminum Corp. of China Ltd. - Segment focus
                • SWOT
              • 14.7 Apar Industries Ltd.
                • Apar Industries Ltd. - Overview
                • Apar Industries Ltd. - Business segments
                • Apar Industries Ltd. - Key offerings
                • Apar Industries Ltd. - Segment focus
                • SWOT
              • 14.8 DeAngeli Prodotti s.r.l
                • DeAngeli Prodotti s.r.l - Overview
                • DeAngeli Prodotti s.r.l - Product / Service
                • DeAngeli Prodotti s.r.l - Key offerings
                • SWOT
              • 14.9 Encore Wire Corp.
                • Encore Wire Corp. - Overview
                • Encore Wire Corp. - Product / Service
                • Encore Wire Corp. - Key offerings
                • SWOT
              • 14.10 Hindalco Industries Ltd.
                • Hindalco Industries Ltd. - Overview
                • Hindalco Industries Ltd. - Business segments
                • Hindalco Industries Ltd. - Key offerings
                • Hindalco Industries Ltd. - Segment focus
                • SWOT
              • 14.11 Jiangsu Zhongtian Technology Co. Ltd.
                • Jiangsu Zhongtian Technology Co. Ltd. - Overview
                • Jiangsu Zhongtian Technology Co. Ltd. - Product / Service
                • Jiangsu Zhongtian Technology Co. Ltd. - Key offerings
                • SWOT
              • 14.12 LS Cable and System Ltd.
                • LS Cable and System Ltd. - Overview
                • LS Cable and System Ltd. - Product / Service
                • LS Cable and System Ltd. - Key offerings
                • SWOT
              • 14.13 Nexans SA
                • Nexans SA - Overview
                • Nexans SA - Business segments
                • Nexans SA - Key news
                • Nexans SA - Key offerings
                • Nexans SA - Segment focus
                • SWOT
              • 14.14 Norsk Hydro ASA
                • Norsk Hydro ASA - Overview
                • Norsk Hydro ASA - Business segments
                • Norsk Hydro ASA - Key news
                • Norsk Hydro ASA - Key offerings
                • Norsk Hydro ASA - Segment focus
                • SWOT
              • 14.15 Prysmian SpA
                • Prysmian SpA - Overview
                • Prysmian SpA - Business segments
                • Prysmian SpA - Key news
                • Prysmian SpA - Key offerings
                • Prysmian SpA - Segment focus
                • SWOT
              • 14.16 Southwire Co. LLC
                • Southwire Co. LLC - Overview
                • Southwire Co. LLC - Product / Service
                • Southwire Co. LLC - Key offerings
                • SWOT
              • 14.17 Sumitomo Electric Industries Ltd.
                • Sumitomo Electric Industries Ltd. - Overview
                • Sumitomo Electric Industries Ltd. - Business segments
                • Sumitomo Electric Industries Ltd. - Key news
                • Sumitomo Electric Industries Ltd. - Key offerings
                • Sumitomo Electric Industries Ltd. - Segment focus
                • SWOT
              • 14.18 Wuxi Jiangnan Cable Co. Ltd
                • Wuxi Jiangnan Cable Co. Ltd - Overview
                • Wuxi Jiangnan Cable Co. Ltd - Product / Service
                • Wuxi Jiangnan Cable Co. Ltd - Key offerings
                • SWOT

              15 Appendix

              • 15.1 Scope of the report
                • 15.2 Inclusions and exclusions checklist
                  • Inclusions checklist
                  • Exclusions checklist
                • 15.3 Currency conversion rates for US$
                  • Currency conversion rates for US$
                • 15.4 Research methodology
                  • Research methodology
                • 15.5 Data procurement
                  • Information sources
                • 15.6 Data validation
                  • Data validation
                • 15.7 Validation techniques employed for market sizing
                  • Validation techniques employed for market sizing
                • 15.8 Data synthesis
                  • Data synthesis
                • 15.9 360 degree market analysis
                  • 360 degree market analysis
                • 15.10 List of abbreviations
                  • List of abbreviations

                Research Methodology

                Technavio presents a detailed picture of the market by way of study, synthesis, and summation of data from multiple sources. The analysts have presented the various facets of the market with a particular focus on identifying the key industry influencers. The data thus presented is comprehensive, reliable, and the result of extensive research, both primary and secondary.

                INFORMATION SOURCES

                Primary sources

                • Manufacturers and suppliers
                • Channel partners
                • Industry experts
                • Strategic decision makers

                Secondary sources

                • Industry journals and periodicals
                • Government data
                • Financial reports of key industry players
                • Historical data
                • Press releases

                DATA ANALYSIS

                Data Synthesis

                • Collation of data
                • Estimation of key figures
                • Analysis of derived insights

                Data Validation

                • Triangulation with data models
                • Reference against proprietary databases
                • Corroboration with industry experts

                REPORT WRITING

                Qualitative

                • Market drivers
                • Market challenges
                • Market trends
                • Five forces analysis

                Quantitative

                • Market size and forecast
                • Market segmentation
                • Geographical insights
                • Competitive landscape

                Interested in this report?

                Get your sample now to see our research methodology and insights!

                Download Now

                Frequently Asked Questions

                Aluminum Conductors market growth will increase by $ 5087 mn during 2025-2029.

                The Aluminum Conductors market is expected to grow at a CAGR of 4.4% during 2025-2029.

                Aluminum Conductors market is segmented by Type( AACSR, AAAC, AAC, other aluminum conductors) Application( Power grid, Industrial, Buildings, South America, MEA)

                Aberdare Cables, Alcoa Corp., Aluminum Corp. of China Ltd., Apar Industries Ltd., DeAngeli Prodotti s.r.l, Encore Wire Corp., Henan Tong-Da Cable Co. Ltd, Hindalco Industries Ltd., Jiangsu Zhongtian Technology Co. Ltd., LS Cable and System Ltd., Nexans SA, Norsk Hydro ASA, Oman Cables, Prysmian SpA, Southwire Co. LLC, Sumitomo Electric Industries Ltd., Wuxi Jiangnan Cable Co. Ltd are a few of the key vendors in the Aluminum Conductors market.

                APAC will register the highest growth rate of 57% among the other regions. Therefore, the Aluminum Conductors market in APAC is expected to garner significant business opportunities for the vendors during the forecast period.

                China, US, India, Japan, South Korea, Canada, Germany, France, Brazil, UK

                • Expansion of power transmission and distribution networksThe expansion of power transmission and distribution networks is a primary driver influencing the global aluminum conductors market. As electricity demand continues to rise due to population growth is the driving factor this market.
                • urbanization is the driving factor this market.
                • and industrial development is the driving factor this market.
                • governments and utilities worldwide are investing in the modernization and extension of grid infrastructure. Aluminum conductors is the driving factor this market.
                • known for their favorable strength-to-weight ratio and cost efficiency is the driving factor this market.
                • are integral to these large-scale transmission and distribution projects. On March 11 is the driving factor this market.
                • 2025 is the driving factor this market.
                • the Executive Chairman of Iberdrola announced at CERAWeek in Houston that the company would invest over $20 billion in United States grid infrastructure by 2030. This investment builds upon the $50 billion already committed over the past two decades and is aimed at modernizing is the driving factor this market.
                • expanding is the driving factor this market.
                • and digitalizing transmission and distribution systems. The initiative is designed to accommodate increasing electricity loads and integrate new generation sources is the driving factor this market.
                • including renewable energy. In India is the driving factor this market.
                • the draft National Electricity Plan (NEP) outlines ambitious targets for grid expansion. According to the Chief of Distribution at Tata Power is the driving factor this market.
                • the plan includes the addition of approximately 105 is the driving factor this market.
                • 000 circuit kilometers of transmission lines and 595 is the driving factor this market.
                • 000 megavolt-amperes of transformation capacity between 2027 and 2032. These developments are expected to support the growing energy needs of the country and facilitate the integration of decentralized and renewable energy sources. Such infrastructure projects necessitate the deployment of high-performance conductors capable of withstanding mechanical stress is the driving factor this market.
                • environmental exposure is the driving factor this market.
                • and thermal loads. Aluminum conductors is the driving factor this market.
                • including variants such as AAC is the driving factor this market.
                • AAAC is the driving factor this market.
                • and ACSR is the driving factor this market.
                • are widely adopted in these applications due to their conductivity is the driving factor this market.
                • corrosion resistance is the driving factor this market.
                • and economic advantages over copper alternatives. As nations prioritize grid resilience and energy access is the driving factor this market.
                • the demand for aluminum conductors is expected to remain closely aligned with the pace and scale of transmission and distribution network expansion. is the driving factor this market.

                The Aluminum Conductors market vendors should focus on grabbing business opportunities from the AACSR segment as it accounted for the largest market share in the base year.