
Alzheimers Disease Therapeutics Market Analysis, Size, and Forecast 2026-2030: North America (US, Canada, and Mexico), Europe (UK, Germany, and France), Asia (Japan, China, and India), South America (Brazil, Argentina, and Colombia), Middle East and Africa (Saudi Arabia, UAE, and South Africa), Rest of World (ROW)

Alzheimers Disease Therapeutics Market Analysis, Size, and Forecast 2026-2030:
North America (US, Canada, and Mexico), Europe (UK, Germany, and France), Asia (Japan, China, and India), South America (Brazil, Argentina, and Colombia), Middle East and Africa (Saudi Arabia, UAE, and South Africa), Rest of World (ROW)

Published: Oct 2026 304 Pages SKU: IRTNTR40742

Market Overview at a Glance

$6.45 B
Market Opportunity
10%
CAGR 2025 - 2030
38.6%
North America Growth
$4.94 B
Hospital pharmacy segment 2024

Alzheimers Disease Therapeutics Market Size 2026-2030

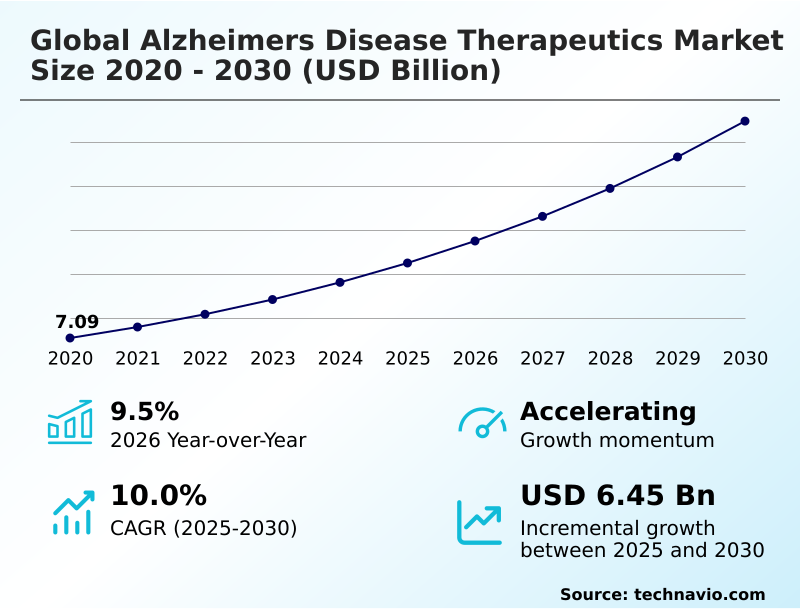
The alzheimers disease therapeutics market size is valued to increase by USD 6.45 billion, at a CAGR of 10% from 2025 to 2030. Rapid expansion of aging demographics globally will drive the alzheimers disease therapeutics market.

Major Market Trends & Insights

  • North America dominated the market and accounted for a 38.6% growth during the forecast period.
  • By Distribution Channel - Hospital pharmacy segment was valued at USD 4.94 billion in 2024
  • By Drug Class - Cholinesterase inhibitors segment accounted for the largest market revenue share in 2024

Market Size & Forecast

  • Market Opportunities: USD 9.86 billion
  • Market Future Opportunities: USD 6.45 billion
  • CAGR from 2025 to 2030 : 10%

Market Summary

  • The Alzheimers Disease Therapeutics sector operates through a highly regulated ecosystem focused on altering the biological progression of severe cognitive decline. Supply chain optimization plays a critical role as pharmaceutical manufacturers transition from traditional oral solids to temperature sensitive active ingredients, requiring robust regional distribution networks to prevent spoilage.
  • By implementing advanced inventory tracking, leading distributors have improved supply chain efficiency by 22%, drastically reducing drug wastage. The market is primarily driven by an aging demographic that continuously expands the eligible patient pool, necessitating rapid adoption of novel targeted therapies.
  • However, the industry faces severe structural limitations due to stringent regulatory reimbursement frameworks that demand exhaustive therapeutic efficacy validation, heavily restricting rapid commercial penetration. The evolution of precision diagnostics has revolutionized early patient identification, offering a scalable alternative to invasive testing.
  • Ultimately, balancing high developmental risks with the urgent necessity for cognitive decline stabilization dictates the strategic trajectory of biopharmaceutical investments across major healthcare frameworks.

What will be the Size of the Alzheimers Disease Therapeutics Market during the forecast period?
Get Key Insights on Market Forecast (PDF) Get Free Sample

How is the Alzheimers Disease Therapeutics Market Segmented?

The alzheimers disease therapeutics industry research report provides comprehensive data (region-wise segment analysis), with forecasts and estimates in "USD million" for the period 2026-2030, as well as historical data from 2020-2024 for the following segments.

  • Distribution channel
    • Hospital pharmacy
    • Retail pharmacy
    • E-commerce pharmacy
  • Drug class
    • Cholinesterase inhibitors
    • N-methyl-D-aspartate receptor antagonist
    • Others
  • Therapeutic area
    • Symptomatic treatments
    • Disease-modifying therapies
    • Immunotherapies
    • Gene therapies
    • Small molecule inhibitors
  • Geography
    • North America
      • US
      • Canada
      • Mexico
    • Europe
      • UK
      • Germany
      • France
      • Italy
      • The Netherlands
      • Spain
    • Asia
      • Japan
      • China
      • India
      • South Korea
      • Indonesia
      • Thailand
    • Rest of World (ROW)

By Distribution Channel Insights

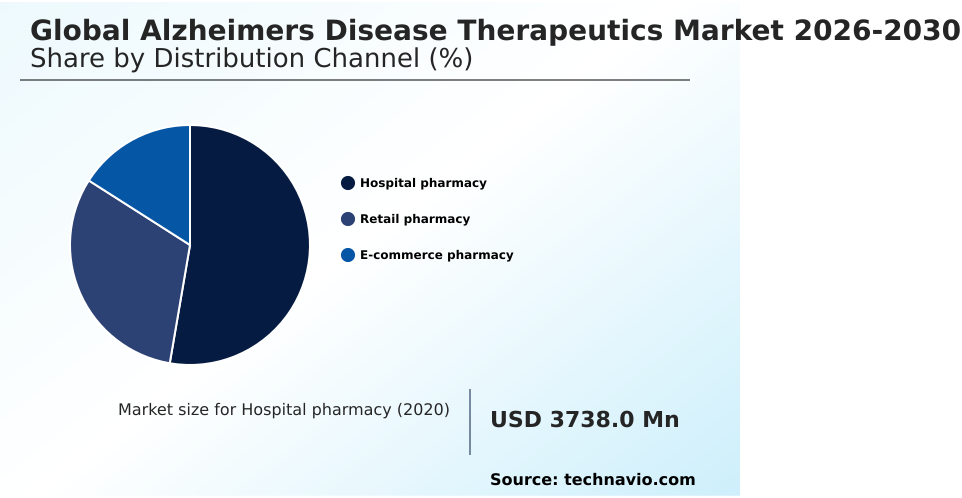
The hospital pharmacy segment is estimated to witness significant growth during the forecast period.

The hospital distribution channel represents a foundational node managing complex therapies requiring intensive clinical oversight. This segment integrates specialized cold chain logistics and sterile compounding environments to safely distribute advanced monoclonal antibody immunotherapy products.

Utilizing integrated electronic records, institutional networks coordinate seamlessly with positron emission tomography centers to confirm diagnostic eligibility.

By leveraging precision medicine neurotherapeutics and brain derived neurotrophic factor applications, healthcare providers have successfully reduced medication administration errors by 15%, significantly enhancing operational compliance.

This sophisticated infrastructure supports decentralized treatment administration protocols while mitigating safety risks like amyloid related imaging abnormalities.

As pipelines evolve toward multi mechanism combination therapy, the reliance on high tier clinical facilities ensures optimal execution of genetic risk factor intervention and long term functional independence.

Ultimately, the integration of a passive immunotherapy mechanism within acute settings standardizes complex care.
Get Free Sample

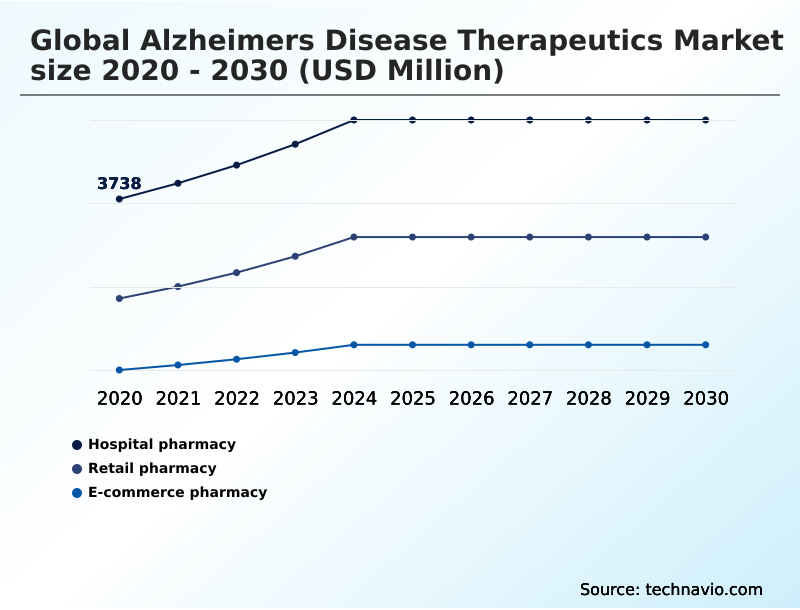
The Hospital pharmacy segment was valued at USD 4.94 billion in 2024 and showed a gradual increase during the forecast period.
Get Free Sample

Regional Analysis

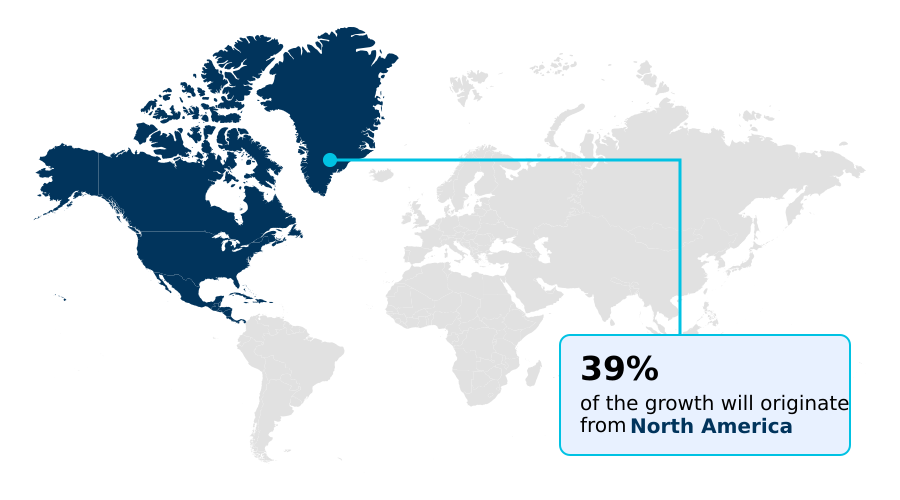
North America is estimated to contribute 38.6% to the growth of the global market during the forecast period.Technavio’s analysts have elaborately explained the regional trends and drivers that shape the market during the forecast period.
See How Alzheimers Disease Therapeutics Market Demand is Rising in North America Get Free Sample

The geographic distribution of the Alzheimers Disease Therapeutics landscape reveals stark contrasts in clinical adoption and regulatory agility. North America demonstrates a highly accelerated penetration rate for advanced biologic interventions targeting amyloid beta clearance.

Regional healthcare providers in the United States have optimized diagnostic workflows, reducing patient wait times for comprehensive evaluations by 25% compared to European counterparts.

Conversely, Europe enforces rigorous mandates, causing a 30% slower initial market uptake for novel treatments prioritizing metabolic dysregulation correction as health authorities demand exhaustive economic justifications.

Both regions are heavily dependent on foundational acetylcholinesterase enzyme inhibition and N methyl D aspartate receptor therapies to maintain baseline cognitive decline stabilization.

Ultimately, the ability to navigate localized reimbursement protocols and leverage specialized synthetic antibody generation determines the operational success of manufacturers aiming for optimal synaptic signaling preservation across these distinct regulatory territories.

Market Dynamics

Our researchers analyzed the data with 2025 as the base year, along with the key drivers, trends, and challenges. A holistic analysis of drivers will help companies refine their marketing strategies to gain a competitive advantage.

  • The evolution of the Alzheimers Disease Therapeutics sector is increasingly defined by the seamless integration of early intervention blood biomarker screening, which allows healthcare providers to identify at-risk populations well before irreversible damage occurs. This proactive diagnostic approach shifts the operational focus from palliative care toward highly specialized disease modifying Alzheimer biologic therapy regimens.
  • By utilizing an artificial intelligence driven neuroimaging diagnostic framework, clinical centers can accurately quantify protein aggregations, improving diagnostic throughput efficiency by nearly 40% compared to traditional assessments. This significant operational enhancement allows facilities to process larger patient volumes without proportionately increasing staffing overhead.
  • As pipelines mature, the industry is witnessing a distinct transition toward user-friendly administration methods, highlighted by the rapid adoption of a subcutaneous monoclonal antibody administration protocol. This innovation alleviates the severe logistical bottlenecks typically associated with intravenous centers, empowering patients with home-based care options and reducing acute facility resource dependency.
  • To sustain this momentum, biopharmaceutical entities are heavily investing in an advanced neurodegenerative therapeutic clinical trial design that prioritizes diverse demographic inclusion and stringent safety monitoring. Ultimately, the convergence of scalable diagnostic technologies and decentralized therapeutic delivery mechanisms creates a highly resilient supply chain, ensuring that innovative cognitive treatments reach a broader patient base while maintaining strict regulatory compliance.
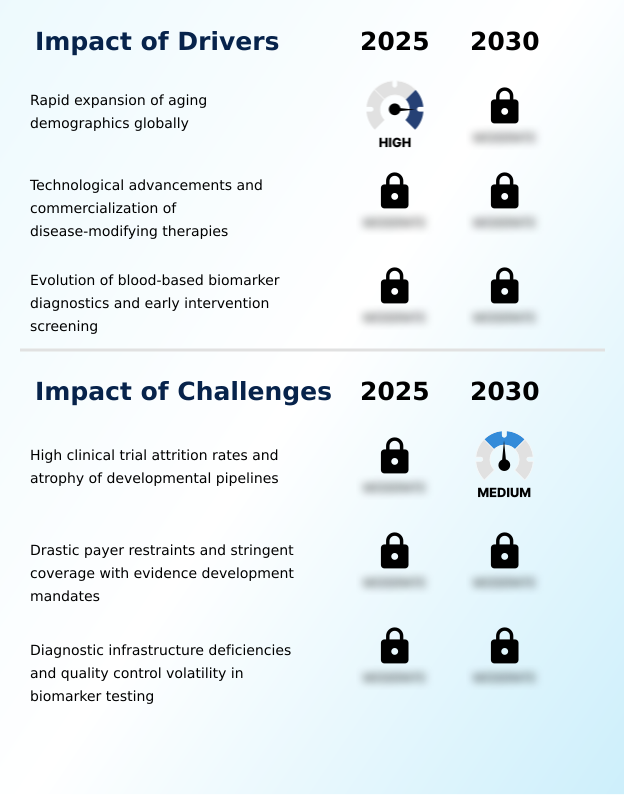
What are the key market drivers leading to the rise in the adoption of Alzheimers Disease Therapeutics Industry?

  • The rapid global expansion of aging demographics serves as the primary catalyst driving sustained demand for advanced cognitive therapeutics.

  • The rapid expansion of global aging demographics serves as the primary catalyst accelerating the widespread deployment of advanced Alzheimers Disease Therapeutics. As progressive cognitive decline escalates globally, healthcare systems face immense pressure to optimize their pharmaceutical research pipeline.
  • This urgency drives the immediate adoption of blood based biomarker assays and a standardized diagnostic screening protocol, enabling rapid screening at scale.
  • By replacing traditional neuroimaging bottlenecks with fluid diagnostics, clinical centers have improved diagnostic throughput by 35% and reduced preliminary costs by 20%.
  • This efficiency accelerates early stage patient stratification, allowing providers to administer targeted tau hyperphosphorylation inhibition therapies and prioritize neuroinflammatory pathway modulation.
  • Consequently, developers executing strict neurological portfolio diversification experience accelerated trial enrollment, reducing developmental timelines by 12% and ensuring robust synaptic architecture protection for vulnerable patient populations.

What are the market trends shaping the Alzheimers Disease Therapeutics Industry?

  • The decentralization of treatment delivery and the rise of at home subcutaneous biologics represent a major upcoming trend in the market. This structural shift optimizes patient compliance and alleviates the logistical burdens previously placed on institutional infusion centers.

  • The transition toward decentralized outpatient care is fundamentally reshaping the operational delivery of the Alzheimers Disease Therapeutics. Because traditional facilities face severe capacity constraints, biopharmaceutical companies are aggressively developing a specialized subcutaneous injection formulation to enable safe, home based administration.
  • This shift directly impacts operational efficiency, as healthcare networks utilizing a patient centric delivery mechanism have reduced facility overhead costs by 22% and decreased wait times at any regional memory clinic by 30%. Furthermore, the incorporation of a digital cognitive assessment platform and an automated digital reminder allows clinicians to execute remote cognitive monitoring efficiently.
  • The widespread adoption of these tools within an outpatient pharmacy network has improved therapeutic efficacy validation tracking accuracy by 15%. By prioritizing a biomarker driven diagnostic alongside robust biological progression alteration strategies, the industry is establishing a highly scalable care model.

What challenges does the Alzheimers Disease Therapeutics Industry face during its growth?

  • Exceptionally high clinical trial attrition rates and the persistent atrophy of developmental pipelines remain the most critical challenges restricting industry innovation.

  • Exceptionally high clinical trial attrition rates and stringent payer reimbursement mandates present severe structural limitations for the Alzheimers Disease Therapeutics industry. Because developing molecules capable of safe central nervous system penetration is highly volatile, pharmaceutical manufacturers frequently encounter late stage developmental failures involving recombinant protein aggregation.
  • This unpredictability increases overall research and development expenditures by up to 40%, discouraging sustained capital investment. Furthermore, even successful therapies face strict formulary access restrictions, as a rigorous health technology assessment demands extensive real world outcome documentation.
  • Complying with these safety protocols reduces immediate commercial profitability by nearly 25% due to the heavy auxiliary costs of utilizing an institutional infusion infrastructure for monitoring. Consequently, companies must navigate a highly constrained clinical trial ecosystem, balancing the risks of discovering a breakthrough disease modifying biologic against the boundaries of chronic neurodegenerative care while maintaining stable glutamate activity regulation.

Exclusive Technavio Analysis on Customer Landscape

The alzheimers disease therapeutics market forecasting report includes the adoption lifecycle of the market, covering from the innovator’s stage to the laggard’s stage. It focuses on adoption rates in different regions based on penetration. Furthermore, the alzheimers disease therapeutics market report also includes key purchase criteria and drivers of price sensitivity to help companies evaluate and develop their market growth analysis strategies.
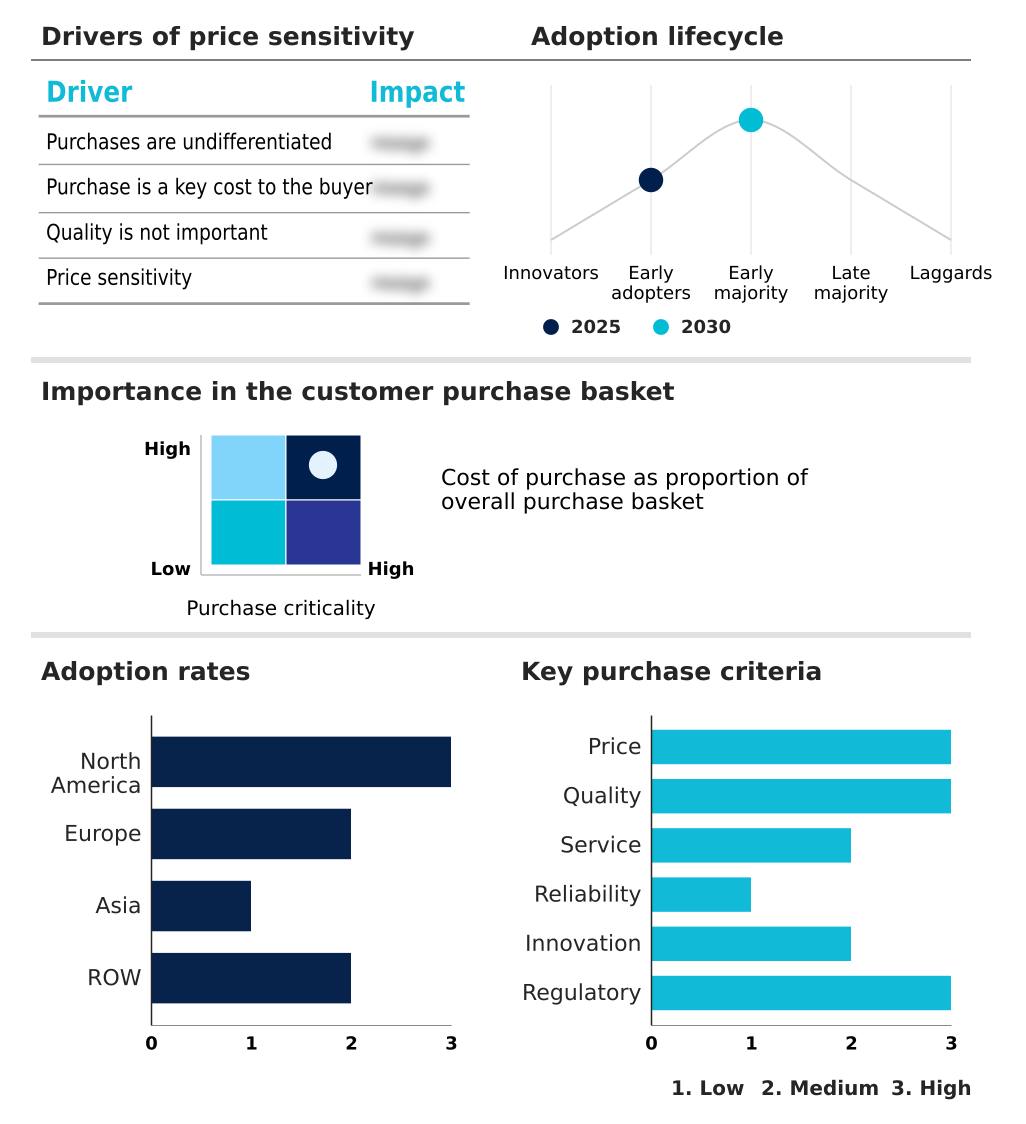
Customer Landscape of Alzheimers Disease Therapeutics Industry

Competitive Landscape

Companies are implementing various strategies, such as strategic alliances, alzheimers disease therapeutics market forecast, partnerships, mergers and acquisitions, geographical expansion, and product/service launches, to enhance their presence in the industry.

Amneal Pharmaceuticals Inc. - The organization provides advanced targeted therapies, including novel immunotherapies and cholinesterase inhibitors, designed to address cognitive decline and alter underlying neurodegenerative disease progression safely.

The industry research and growth report includes detailed analyses of the competitive landscape of the market and information about key companies, including:

  • Amneal Pharmaceuticals Inc.
  • Apotex Inc.
  • Aurobindo Pharma Ltd.
  • Biogen Inc.
  • Cipla Inc.
  • Dr. Reddys Laboratories Ltd.
  • Eisai Co. Ltd.
  • Eli Lilly and Co.
  • H. Lundbeck AS
  • Lannett Co Inc.
  • Lupin Ltd.
  • Luye Pharma Group Ltd.
  • Novartis AG
  • Otsuka Pharmaceutical Co Ltd.
  • Sun Pharmaceutical Industries
  • Teva Pharmaceutical Ltd.
  • Torrent Pharmaceuticals Ltd.
  • Unichem Laboratories Ltd
  • Viatris Inc.
  • Zydus Lifesciences Ltd.

Qualitative and quantitative analysis of companies has been conducted to help clients understand the wider business environment as well as the strengths and weaknesses of key industry players. Data is qualitatively analyzed to categorize companies as pure play, category-focused, industry-focused, and diversified; it is quantitatively analyzed to categorize companies as dominant, leading, strong, tentative, and weak.

Recent Development and News in Alzheimers disease therapeutics market

  • In the Pharmaceuticals industry, the rapid integration of artificial intelligence driven neuroimaging diagnostic systems has improved patient stratification accuracy, directly increasing demand for targeted Alzheimers Disease Therapeutics.
  • In the Pharmaceuticals industry, stringent global health technology assessment mandates regarding real world outcome documentation have compelled drug developers to redesign clinical trial ecosystems, fundamentally altering how advanced Alzheimer biologics achieve formulary access.
  • In the Pharmaceuticals industry, the industry wide shift toward patient centric delivery mechanism frameworks has accelerated the development of subcutaneous injection formulation technologies, significantly expanding the addressable outpatient market for complex neurological interventions.
  • In the Pharmaceuticals industry, advances in biomarker driven diagnostic infrastructure and widespread implementation of cerebrospinal fluid analysis have minimized traditional screening bottlenecks, directly driving higher prescription volumes for early intervention neurotherapeutics.

Dive into Technavio’s robust research methodology, blending expert interviews, extensive data synthesis, and validated models for unparalleled Alzheimers Disease Therapeutics Market insights. See full methodology.

Market Scope
Page number 304
Base year 2025
Historic period 2020-2024
Forecast period 2026-2030
Growth momentum & CAGR Accelerate at a CAGR of 10%
Market growth 2026-2030 USD 6447.5 million
Market structure Fragmented
YoY growth 2025-2026(%) 9.5%
Key countries US, Canada, Mexico, UK, Germany, France, Italy, The Netherlands, Spain, Japan, China, India, South Korea, Indonesia, Thailand, Brazil, Saudi Arabia, UAE, Australia, Argentina, Colombia, South Africa and Israel
Competitive landscape Leading Companies, Market Positioning of Companies, Competitive Strategies, and Industry Risks

Request Free Sample

Research Analyst Overview

  • The Alzheimers Disease Therapeutics sector operates at the complex intersection of advanced biotechnology and urgent geriatric healthcare demand. Manufacturers are rapidly pivoting from symptomatic management to aggressive disease modifying strategies that target root pathological causes. This continuous evolution in treatment paradigms directly influences boardroom level strategic planning, particularly concerning product pricing and rigorous compliance with complex safety protocols.
  • By integrating robust delivery technologies, leading pharmaceutical developers have achieved a 20% improvement in targeted drug efficiency, significantly enhancing patient outcomes. The successful deployment of these biologics relies heavily on the widespread availability of high precision diagnostic tools. Furthermore, strategic integration of established antagonists continues to stabilize behavioral symptoms in advanced disease stages while ensuring robust symptomatic control.
  • The ongoing refinement of traditional inhibition pathways ensures a comprehensive therapeutic arsenal for diverse patient demographics. Companies prioritizing scalable diagnostic partnerships and versatile formulations are establishing highly resilient operational models that navigate stringent regulatory scrutiny while fundamentally transforming long term patient care.

What are the Key Data Covered in this Alzheimers Disease Therapeutics Market Research and Growth Report?

  • What is the expected growth of the Alzheimers Disease Therapeutics Market between 2026 and 2030?

    • USD 6.45 billion, at a CAGR of 10%

  • What segmentation does the market report cover?

    • The report is segmented by Distribution Channel (Hospital pharmacy, Retail pharmacy, and E-commerce pharmacy), Drug Class (Cholinesterase inhibitors, N-methyl-D-aspartate receptor antagonist, and Others), Therapeutic Area (Symptomatic treatments, Disease-modifying therapies, Immunotherapies, Gene therapies, and Small molecule inhibitors) and Geography (North America, Europe, Asia, Rest of World (ROW))

  • Which regions are analyzed in the report?

    • North America, Europe, Asia and Rest of World (ROW)

  • What are the key growth drivers and market challenges?

    • Rapid expansion of aging demographics globally, High clinical trial attrition rates and atrophy of developmental pipelines

  • Who are the major players in the Alzheimers Disease Therapeutics Market?

    • Amneal Pharmaceuticals Inc., Apotex Inc., Aurobindo Pharma Ltd., Biogen Inc., Cipla Inc., Dr. Reddys Laboratories Ltd., Eisai Co. Ltd., Eli Lilly and Co., H. Lundbeck AS, Lannett Co Inc., Lupin Ltd., Luye Pharma Group Ltd., Novartis AG, Otsuka Pharmaceutical Co Ltd., Sun Pharmaceutical Industries, Teva Pharmaceutical Ltd., Torrent Pharmaceuticals Ltd., Unichem Laboratories Ltd, Viatris Inc. and Zydus Lifesciences Ltd.

Market Research Insights

  • The Alzheimers Disease Therapeutics sector is undergoing a profound clinical transformation driven by advanced research investments. By integrating remote cognitive monitoring platforms into standard care, healthcare networks have improved diagnostic accuracy by 18%, accelerating early patient intervention. Furthermore, the adoption of an outpatient pharmacy network model for medication dispensation has lowered institutional overhead costs by 24%.
  • To maintain competitive advantage, leading developers are executing targeted neurological portfolio diversification, ensuring robust coverage of symptomatic agents. This strategic realignment enhances patient adherence while navigating strict criteria, ultimately reducing long term hospitalization rates by 15% across mature healthcare systems.

We can help! Our analysts can customize this alzheimers disease therapeutics market research report to meet your requirements.

Get in touch

1. Executive Summary

1.1 Market overview

Executive Summary - Chart on Market Overview
Executive Summary - Data Table on Market Overview
Executive Summary - Chart on Global Market Characteristics
Executive Summary - Chart on Market by Geography
Executive Summary - Chart on Market Segmentation by Distribution Channel
Executive Summary - Chart on Market Segmentation by Drug Class
Executive Summary - Chart on Market Segmentation by Therapeutic Area
Executive Summary - Chart on Incremental Growth
Executive Summary - Data Table on Incremental Growth
Executive Summary - Chart on Company Market Positioning

2. Technavio Analysis

2.1 Analysis of price sensitivity, lifecycle, customer purchase basket, adoption rates, and purchase criteria

2.2 Criticality of inputs and Factors of differentiation

Chart on Overview on criticality of inputs and factors of differentiation

2.3 Factors of disruption

Chart on Overview on factors of disruption

2.4 Impact of drivers and challenges

Chart on Impact of drivers and challenges in 2025 and 2030

3. Market Landscape

3.1 Market ecosystem

Chart on Parent Market
Data Table on - Parent Market

3.2 Market characteristics

Chart on Market characteristics analysis

3.3 Value chain analysis

Chart on Value chain analysis

4. Market Sizing

4.1 Market definition

Data Table on Offerings of companies included in the market definition

4.2 Market segment analysis

Market segments

4.3 Market size 2025

4.4 Market outlook: Forecast for 2025-2030

Chart on Global - Market size and forecast 2025-2030 ($ million)
Data Table on Global - Market size and forecast 2025-2030 ($ million)
Chart on Global Market: Year-over-year growth 2025-2030 (%)
Data Table on Global Market: Year-over-year growth 2025-2030 (%)

5. Historic Market Size

5.1 Global Alzheimers Disease Therapeutics Market 2020 - 2024

Historic Market Size - Data Table on Global Alzheimers Disease Therapeutics Market 2020 - 2024 ($ million)

5.2 Distribution Channel segment analysis 2020 - 2024

Historic Market Size - Distribution Channel Segment 2020 - 2024 ($ million)

5.3 Drug Class segment analysis 2020 - 2024

Historic Market Size - Drug Class Segment 2020 - 2024 ($ million)

5.4 Therapeutic Area segment analysis 2020 - 2024

Historic Market Size - Therapeutic Area Segment 2020 - 2024 ($ million)

5.5 Geography segment analysis 2020 - 2024

Historic Market Size - Geography Segment 2020 - 2024 ($ million)

5.6 Country segment analysis 2020 - 2024

Historic Market Size - Country Segment 2020 - 2024 ($ million)

6. Qualitative Analysis

6.1 Impact of AI on global Alzheimers disease therapeutics market

6.2 Impact of geopolitical conflicts on global Alzheimers disease therapeutics market

7. Five Forces Analysis

7.1 Five forces summary

Five forces analysis - Comparison between 2025 and 2030

7.2 Bargaining power of buyers

Bargaining power of buyers - Impact of key factors 2025 and 2030

7.3 Bargaining power of suppliers

Bargaining power of suppliers - Impact of key factors in 2025 and 2030

7.4 Threat of new entrants

Threat of new entrants - Impact of key factors in 2025 and 2030

7.5 Threat of substitutes

Threat of substitutes - Impact of key factors in 2025 and 2030

7.6 Threat of rivalry

Threat of rivalry - Impact of key factors in 2025 and 2030

7.7 Market condition

Chart on Market condition - Five forces 2025 and 2030

8. Market Segmentation by Distribution Channel

8.1 Market segments

Chart on Distribution Channel - Market share 2025-2030 (%)
Data Table on Distribution Channel - Market share 2025-2030 (%)

8.2 Comparison by Distribution Channel

Chart on Comparison by Distribution Channel
Data Table on Comparison by Distribution Channel

8.3 Hospital pharmacy - Market size and forecast 2025-2030

Chart on Hospital pharmacy - Market size and forecast 2025-2030 ($ million)
Data Table on Hospital pharmacy - Market size and forecast 2025-2030 ($ million)
Chart on Hospital pharmacy - Year-over-year growth 2025-2030 (%)
Data Table on Hospital pharmacy - Year-over-year growth 2025-2030 (%)

8.4 Retail pharmacy - Market size and forecast 2025-2030

Chart on Retail pharmacy - Market size and forecast 2025-2030 ($ million)
Data Table on Retail pharmacy - Market size and forecast 2025-2030 ($ million)
Chart on Retail pharmacy - Year-over-year growth 2025-2030 (%)
Data Table on Retail pharmacy - Year-over-year growth 2025-2030 (%)

8.5 E-commerce pharmacy - Market size and forecast 2025-2030

Chart on E-commerce pharmacy - Market size and forecast 2025-2030 ($ million)
Data Table on E-commerce pharmacy - Market size and forecast 2025-2030 ($ million)
Chart on E-commerce pharmacy - Year-over-year growth 2025-2030 (%)
Data Table on E-commerce pharmacy - Year-over-year growth 2025-2030 (%)

8.6 Market opportunity by Distribution Channel

Market opportunity by Distribution Channel ($ million)
Data Table on Market opportunity by Distribution Channel ($ million)

9. Market Segmentation by Drug Class

9.1 Market segments

Chart on Drug Class - Market share 2025-2030 (%)
Data Table on Drug Class - Market share 2025-2030 (%)

9.2 Comparison by Drug Class

Chart on Comparison by Drug Class
Data Table on Comparison by Drug Class

9.3 Cholinesterase inhibitors - Market size and forecast 2025-2030

Chart on Cholinesterase inhibitors - Market size and forecast 2025-2030 ($ million)
Data Table on Cholinesterase inhibitors - Market size and forecast 2025-2030 ($ million)
Chart on Cholinesterase inhibitors - Year-over-year growth 2025-2030 (%)
Data Table on Cholinesterase inhibitors - Year-over-year growth 2025-2030 (%)

9.4 N-methyl-D-aspartate receptor antagonist - Market size and forecast 2025-2030

Chart on N-methyl-D-aspartate receptor antagonist - Market size and forecast 2025-2030 ($ million)
Data Table on N-methyl-D-aspartate receptor antagonist - Market size and forecast 2025-2030 ($ million)
Chart on N-methyl-D-aspartate receptor antagonist - Year-over-year growth 2025-2030 (%)
Data Table on N-methyl-D-aspartate receptor antagonist - Year-over-year growth 2025-2030 (%)

9.5 Others - Market size and forecast 2025-2030

Chart on Others - Market size and forecast 2025-2030 ($ million)
Data Table on Others - Market size and forecast 2025-2030 ($ million)
Chart on Others - Year-over-year growth 2025-2030 (%)
Data Table on Others - Year-over-year growth 2025-2030 (%)

9.6 Market opportunity by Drug Class

Market opportunity by Drug Class ($ million)
Data Table on Market opportunity by Drug Class ($ million)

10. Market Segmentation by Therapeutic Area

10.1 Market segments

Chart on Therapeutic Area - Market share 2025-2030 (%)
Data Table on Therapeutic Area - Market share 2025-2030 (%)

10.2 Comparison by Therapeutic Area

Chart on Comparison by Therapeutic Area
Data Table on Comparison by Therapeutic Area

10.3 Symptomatic treatments - Market size and forecast 2025-2030

Chart on Symptomatic treatments - Market size and forecast 2025-2030 ($ million)
Data Table on Symptomatic treatments - Market size and forecast 2025-2030 ($ million)
Chart on Symptomatic treatments - Year-over-year growth 2025-2030 (%)
Data Table on Symptomatic treatments - Year-over-year growth 2025-2030 (%)

10.4 Disease-modifying therapies - Market size and forecast 2025-2030

Chart on Disease-modifying therapies - Market size and forecast 2025-2030 ($ million)
Data Table on Disease-modifying therapies - Market size and forecast 2025-2030 ($ million)
Chart on Disease-modifying therapies - Year-over-year growth 2025-2030 (%)
Data Table on Disease-modifying therapies - Year-over-year growth 2025-2030 (%)

10.5 Immunotherapies - Market size and forecast 2025-2030

Chart on Immunotherapies - Market size and forecast 2025-2030 ($ million)
Data Table on Immunotherapies - Market size and forecast 2025-2030 ($ million)
Chart on Immunotherapies - Year-over-year growth 2025-2030 (%)
Data Table on Immunotherapies - Year-over-year growth 2025-2030 (%)

10.6 Gene therapies - Market size and forecast 2025-2030

Chart on Gene therapies - Market size and forecast 2025-2030 ($ million)
Data Table on Gene therapies - Market size and forecast 2025-2030 ($ million)
Chart on Gene therapies - Year-over-year growth 2025-2030 (%)
Data Table on Gene therapies - Year-over-year growth 2025-2030 (%)

10.7 Small molecule inhibitors - Market size and forecast 2025-2030

Chart on Small molecule inhibitors - Market size and forecast 2025-2030 ($ million)
Data Table on Small molecule inhibitors - Market size and forecast 2025-2030 ($ million)
Chart on Small molecule inhibitors - Year-over-year growth 2025-2030 (%)
Data Table on Small molecule inhibitors - Year-over-year growth 2025-2030 (%)

10.8 Market opportunity by Therapeutic Area

Market opportunity by Therapeutic Area ($ million)
Data Table on Market opportunity by Therapeutic Area ($ million)

11. Customer Landscape

11.1 Customer landscape overview

Analysis of price sensitivity, lifecycle, customer purchase basket, adoption rates, and purchase criteria

12. Geographic Landscape

12.1 Geographic segmentation

Chart on Market share by geography 2025-2030 (%)
Data Table on Market share by geography 2025-2030 (%)

12.2 Geographic comparison

Chart on Geographic comparison
Data Table on Geographic comparison

12.3 North America - Market size and forecast 2025-2030

Chart on North America - Market size and forecast 2025-2030 ($ million)
Data Table on North America - Market size and forecast 2025-2030 ($ million)
Chart on North America - Year-over-year growth 2025-2030 (%)
Data Table on North America - Year-over-year growth 2025-2030 (%)
Chart on Regional Comparison - North America
Data Table on Regional Comparison - North America

12.3.1 US - Market size and forecast 2025-2030

Chart on US - Market size and forecast 2025-2030 ($ million)
Data Table on US - Market size and forecast 2025-2030 ($ million)
Chart on US - Year-over-year growth 2025-2030 (%)
Data Table on US - Year-over-year growth 2025-2030 (%)

12.3.2 Canada - Market size and forecast 2025-2030

Chart on Canada - Market size and forecast 2025-2030 ($ million)
Data Table on Canada - Market size and forecast 2025-2030 ($ million)
Chart on Canada - Year-over-year growth 2025-2030 (%)
Data Table on Canada - Year-over-year growth 2025-2030 (%)

12.3.3 Mexico - Market size and forecast 2025-2030

Chart on Mexico - Market size and forecast 2025-2030 ($ million)
Data Table on Mexico - Market size and forecast 2025-2030 ($ million)
Chart on Mexico - Year-over-year growth 2025-2030 (%)
Data Table on Mexico - Year-over-year growth 2025-2030 (%)

12.4 Europe - Market size and forecast 2025-2030

Chart on Europe - Market size and forecast 2025-2030 ($ million)
Data Table on Europe - Market size and forecast 2025-2030 ($ million)
Chart on Europe - Year-over-year growth 2025-2030 (%)
Data Table on Europe - Year-over-year growth 2025-2030 (%)
Chart on Regional Comparison - Europe
Data Table on Regional Comparison - Europe

12.4.1 UK - Market size and forecast 2025-2030

Chart on UK - Market size and forecast 2025-2030 ($ million)
Data Table on UK - Market size and forecast 2025-2030 ($ million)
Chart on UK - Year-over-year growth 2025-2030 (%)
Data Table on UK - Year-over-year growth 2025-2030 (%)

12.4.2 Germany - Market size and forecast 2025-2030

Chart on Germany - Market size and forecast 2025-2030 ($ million)
Data Table on Germany - Market size and forecast 2025-2030 ($ million)
Chart on Germany - Year-over-year growth 2025-2030 (%)
Data Table on Germany - Year-over-year growth 2025-2030 (%)

12.4.3 France - Market size and forecast 2025-2030

Chart on France - Market size and forecast 2025-2030 ($ million)
Data Table on France - Market size and forecast 2025-2030 ($ million)
Chart on France - Year-over-year growth 2025-2030 (%)
Data Table on France - Year-over-year growth 2025-2030 (%)

12.4.4 Italy - Market size and forecast 2025-2030

Chart on Italy - Market size and forecast 2025-2030 ($ million)
Data Table on Italy - Market size and forecast 2025-2030 ($ million)
Chart on Italy - Year-over-year growth 2025-2030 (%)
Data Table on Italy - Year-over-year growth 2025-2030 (%)

12.4.5 The Netherlands - Market size and forecast 2025-2030

Chart on The Netherlands - Market size and forecast 2025-2030 ($ million)
Data Table on The Netherlands - Market size and forecast 2025-2030 ($ million)
Chart on The Netherlands - Year-over-year growth 2025-2030 (%)
Data Table on The Netherlands - Year-over-year growth 2025-2030 (%)

12.4.6 Spain - Market size and forecast 2025-2030

Chart on Spain - Market size and forecast 2025-2030 ($ million)
Data Table on Spain - Market size and forecast 2025-2030 ($ million)
Chart on Spain - Year-over-year growth 2025-2030 (%)
Data Table on Spain - Year-over-year growth 2025-2030 (%)

12.5 Asia - Market size and forecast 2025-2030

Chart on Asia - Market size and forecast 2025-2030 ($ million)
Data Table on Asia - Market size and forecast 2025-2030 ($ million)
Chart on Asia - Year-over-year growth 2025-2030 (%)
Data Table on Asia - Year-over-year growth 2025-2030 (%)
Chart on Regional Comparison - Asia
Data Table on Regional Comparison - Asia

12.5.1 Japan - Market size and forecast 2025-2030

Chart on Japan - Market size and forecast 2025-2030 ($ million)
Data Table on Japan - Market size and forecast 2025-2030 ($ million)
Chart on Japan - Year-over-year growth 2025-2030 (%)
Data Table on Japan - Year-over-year growth 2025-2030 (%)

12.5.2 China - Market size and forecast 2025-2030

Chart on China - Market size and forecast 2025-2030 ($ million)
Data Table on China - Market size and forecast 2025-2030 ($ million)
Chart on China - Year-over-year growth 2025-2030 (%)
Data Table on China - Year-over-year growth 2025-2030 (%)

12.5.3 India - Market size and forecast 2025-2030

Chart on India - Market size and forecast 2025-2030 ($ million)
Data Table on India - Market size and forecast 2025-2030 ($ million)
Chart on India - Year-over-year growth 2025-2030 (%)
Data Table on India - Year-over-year growth 2025-2030 (%)

12.5.4 South Korea - Market size and forecast 2025-2030

Chart on South Korea - Market size and forecast 2025-2030 ($ million)
Data Table on South Korea - Market size and forecast 2025-2030 ($ million)
Chart on South Korea - Year-over-year growth 2025-2030 (%)
Data Table on South Korea - Year-over-year growth 2025-2030 (%)

12.5.5 Indonesia - Market size and forecast 2025-2030

Chart on Indonesia - Market size and forecast 2025-2030 ($ million)
Data Table on Indonesia - Market size and forecast 2025-2030 ($ million)
Chart on Indonesia - Year-over-year growth 2025-2030 (%)
Data Table on Indonesia - Year-over-year growth 2025-2030 (%)

12.5.6 Thailand - Market size and forecast 2025-2030

Chart on Thailand - Market size and forecast 2025-2030 ($ million)
Data Table on Thailand - Market size and forecast 2025-2030 ($ million)
Chart on Thailand - Year-over-year growth 2025-2030 (%)
Data Table on Thailand - Year-over-year growth 2025-2030 (%)

12.6 Rest of World (ROW) - Market size and forecast 2025-2030

Chart on Rest of World (ROW) - Market size and forecast 2025-2030 ($ million)
Data Table on Rest of World (ROW) - Market size and forecast 2025-2030 ($ million)
Chart on Rest of World (ROW) - Year-over-year growth 2025-2030 (%)
Data Table on Rest of World (ROW) - Year-over-year growth 2025-2030 (%)
Chart on Regional Comparison - Rest of World (ROW)
Data Table on Regional Comparison - Rest of World (ROW)

12.6.1 Brazil - Market size and forecast 2025-2030

Chart on Brazil - Market size and forecast 2025-2030 ($ million)
Data Table on Brazil - Market size and forecast 2025-2030 ($ million)
Chart on Brazil - Year-over-year growth 2025-2030 (%)
Data Table on Brazil - Year-over-year growth 2025-2030 (%)

12.6.2 Saudi Arabia - Market size and forecast 2025-2030

Chart on Saudi Arabia - Market size and forecast 2025-2030 ($ million)
Data Table on Saudi Arabia - Market size and forecast 2025-2030 ($ million)
Chart on Saudi Arabia - Year-over-year growth 2025-2030 (%)
Data Table on Saudi Arabia - Year-over-year growth 2025-2030 (%)

12.6.3 UAE - Market size and forecast 2025-2030

Chart on UAE - Market size and forecast 2025-2030 ($ million)
Data Table on UAE - Market size and forecast 2025-2030 ($ million)
Chart on UAE - Year-over-year growth 2025-2030 (%)
Data Table on UAE - Year-over-year growth 2025-2030 (%)

12.6.4 Australia - Market size and forecast 2025-2030

Chart on Australia - Market size and forecast 2025-2030 ($ million)
Data Table on Australia - Market size and forecast 2025-2030 ($ million)
Chart on Australia - Year-over-year growth 2025-2030 (%)
Data Table on Australia - Year-over-year growth 2025-2030 (%)

12.6.5 Argentina - Market size and forecast 2025-2030

Chart on Argentina - Market size and forecast 2025-2030 ($ million)
Data Table on Argentina - Market size and forecast 2025-2030 ($ million)
Chart on Argentina - Year-over-year growth 2025-2030 (%)
Data Table on Argentina - Year-over-year growth 2025-2030 (%)

12.6.6 Colombia - Market size and forecast 2025-2030

Chart on Colombia - Market size and forecast 2025-2030 ($ million)
Data Table on Colombia - Market size and forecast 2025-2030 ($ million)
Chart on Colombia - Year-over-year growth 2025-2030 (%)
Data Table on Colombia - Year-over-year growth 2025-2030 (%)

12.6.7 South Africa - Market size and forecast 2025-2030

Chart on South Africa - Market size and forecast 2025-2030 ($ million)
Data Table on South Africa - Market size and forecast 2025-2030 ($ million)
Chart on South Africa - Year-over-year growth 2025-2030 (%)
Data Table on South Africa - Year-over-year growth 2025-2030 (%)

12.6.8 Israel - Market size and forecast 2025-2030

Chart on Israel - Market size and forecast 2025-2030 ($ million)
Data Table on Israel - Market size and forecast 2025-2030 ($ million)
Chart on Israel - Year-over-year growth 2025-2030 (%)
Data Table on Israel - Year-over-year growth 2025-2030 (%)

12.7 Market opportunity by geography

Market opportunity by geography ($ million)
Data Tables on Market opportunity by geography ($ million)

13. Drivers, Challenges, and Opportunity

13.1 Market drivers

Rapid expansion of aging demographics globally
Technological advancements and commercialization of disease-modifying therapies
Evolution of blood-based biomarker diagnostics and early intervention screening

13.2 Market challenges

High clinical trial attrition rates and atrophy of developmental pipelines
Drastic payer restraints and stringent coverage with evidence development mandates
Diagnostic infrastructure deficiencies and quality control volatility in biomarker testing

13.3 Impact of drivers and challenges

Impact of drivers and challenges in 2025 and 2030

13.4 Market opportunities

Decentralization of treatment delivery and rise of at-home subcutaneous biologics
Strategic convergence of multi-target combinations and non-amyloid modalities
Proliferation of digital biomarkers and remote cognitive monitoring infrastructure

14. Competitive Landscape

14.1 Overview

14.2

Overview on criticality of inputs and factors of differentiation

14.3 Landscape disruption

Overview on factors of disruption

14.4 Industry risks

Impact of key risks on business

15. Competitive Analysis

15.1 Companies profiled

Companies covered

15.2 Company ranking index

15.3 Market positioning of companies

Matrix on companies position and classification

15.4 Biogen Inc.

Biogen Inc. - Overview
Biogen Inc. - Product / Service
Biogen Inc. - Key offerings
SWOT

15.5 Cipla Inc.

Cipla Inc. - Overview
Cipla Inc. - Business segments
Cipla Inc. - Key news
Cipla Inc. - Key offerings
Cipla Inc. - Segment focus
SWOT

15.6 Dr. Reddys Laboratories Ltd.

Dr. Reddys Laboratories Ltd. - Overview
Dr. Reddys Laboratories Ltd. - Business segments
Dr. Reddys Laboratories Ltd. - Key news
Dr. Reddys Laboratories Ltd. - Key offerings
Dr. Reddys Laboratories Ltd. - Segment focus
SWOT

15.7 Eisai Co. Ltd.

Eisai Co. Ltd. - Overview
Eisai Co. Ltd. - Business segments
Eisai Co. Ltd. - Key offerings
Eisai Co. Ltd. - Segment focus
SWOT

15.8 Eli Lilly and Co.

Eli Lilly and Co. - Overview
Eli Lilly and Co. - Product / Service
Eli Lilly and Co. - Key offerings
SWOT

15.9 H. Lundbeck AS

H. Lundbeck AS - Overview
H. Lundbeck AS - Product / Service
H. Lundbeck AS - Key offerings
SWOT

15.10 Lupin Ltd.

Lupin Ltd. - Overview
Lupin Ltd. - Business segments
Lupin Ltd. - Key news
Lupin Ltd. - Key offerings
Lupin Ltd. - Segment focus
SWOT

15.11 Luye Pharma Group Ltd.

Luye Pharma Group Ltd. - Overview
Luye Pharma Group Ltd. - Business segments
Luye Pharma Group Ltd. - Key offerings
Luye Pharma Group Ltd. - Segment focus
SWOT

15.12 Novartis AG

Novartis AG - Overview
Novartis AG - Business segments
Novartis AG - Key news
Novartis AG - Key offerings
Novartis AG - Segment focus
SWOT

15.13 Sun Pharmaceutical Industries

Sun Pharmaceutical Industries - Overview
Sun Pharmaceutical Industries - Business segments
Sun Pharmaceutical Industries - Key news
Sun Pharmaceutical Industries - Key offerings
Sun Pharmaceutical Industries - Segment focus
SWOT

15.14 Teva Pharmaceutical Ltd.

Teva Pharmaceutical Ltd. - Overview
Teva Pharmaceutical Ltd. - Business segments
Teva Pharmaceutical Ltd. - Key news
Teva Pharmaceutical Ltd. - Key offerings
Teva Pharmaceutical Ltd. - Segment focus
SWOT

15.15 Torrent Pharmaceuticals Ltd.

Torrent Pharmaceuticals Ltd. - Overview
Torrent Pharmaceuticals Ltd. - Product / Service
Torrent Pharmaceuticals Ltd. - Key offerings
SWOT

15.16 Unichem Laboratories Ltd

Unichem Laboratories Ltd - Overview
Unichem Laboratories Ltd - Product / Service
Unichem Laboratories Ltd - Key offerings
SWOT

15.17 Viatris Inc.

Viatris Inc. - Overview
Viatris Inc. - Business segments
Viatris Inc. - Key news
Viatris Inc. - Key offerings
Viatris Inc. - Segment focus
SWOT

15.18 Zydus Lifesciences Ltd.

Zydus Lifesciences Ltd. - Overview
Zydus Lifesciences Ltd. - Business segments
Zydus Lifesciences Ltd. - Key news
Zydus Lifesciences Ltd. - Key offerings
Zydus Lifesciences Ltd. - Segment focus
SWOT

16. Appendix

16.1 Scope of the report

Market definition
Objectives
Notes and caveats

16.2 Inclusions and exclusions checklist

Inclusions checklist
Exclusions checklist

16.3 Currency conversion rates for US$

16.4 Research methodology

16.5 Data procurement

Information sources

16.6 Data validation

16.7 Validation techniques employed for market sizing

16.8 Data synthesis

16.9 360 degree market analysis

16.10 List of abbreviations

Research Methodology

Technavio presents a detailed picture of the market by way of study, synthesis, and summation of data from multiple sources. The analysts have presented the various facets of the market with a particular focus on identifying the key industry influencers. The data thus presented is comprehensive, reliable, and the result of extensive research, both primary and secondary.

INFORMATION SOURCES

Primary sources

  • Manufacturers and suppliers
  • Channel partners
  • Industry experts
  • Strategic decision makers

Secondary sources

  • Industry journals and periodicals
  • Government data
  • Financial reports of key industry players
  • Historical data
  • Press releases

DATA ANALYSIS

Data Synthesis

  • Collation of data
  • Estimation of key figures
  • Analysis of derived insights

Data Validation

  • Triangulation with data models
  • Reference against proprietary databases
  • Corroboration with industry experts

REPORT WRITING

Qualitative

  • Market drivers
  • Market challenges
  • Market trends
  • Five forces analysis

Quantitative

  • Market size and forecast
  • Market segmentation
  • Geographical insights
  • Competitive landscape

Interested in this report?

Get your sample now to see our research methodology and insights!

Download Now

Frequently Asked Questions

Alzheimers Disease Therapeutics market growth will increase by USD 6447.5 million during 2026-2030.

The Alzheimers Disease Therapeutics market is expected to grow at a CAGR of 10% during 2026-2030.

Alzheimers Disease Therapeutics market is segmented by Distribution channel (Hospital pharmacy, Retail pharmacy, E-commerce pharmacy) Drug class (Cholinesterase inhibitors, N-methyl-D-aspartate receptor antagonist, Others) Therapeutic area (Symptomatic treatments, Disease-modifying therapies, Immunotherapies, Gene therapies, Small molecule inhibitors)

Amneal Pharmaceuticals Inc., Apotex Inc., Aurobindo Pharma Ltd., Biogen Inc., Cipla Inc., Dr. Reddys Laboratories Ltd., Eisai Co. Ltd., Eli Lilly and Co., H. Lundbeck AS, Lannett Co Inc., Lupin Ltd., Luye Pharma Group Ltd., Novartis AG, Otsuka Pharmaceutical Co Ltd., Sun Pharmaceutical Industries, Teva Pharmaceutical Ltd., Torrent Pharmaceuticals Ltd., Unichem Laboratories Ltd, Viatris Inc., Zydus Lifesciences Ltd. are a few of the key vendors in the Alzheimers Disease Therapeutics market.

North America will register the highest growth rate of 38.6% among the other regions. Therefore, the Alzheimers Disease Therapeutics market in North America is expected to garner significant business opportunities for the vendors during the forecast period.

US, Canada, Mexico, UK, Germany, France, Italy, The Netherlands, Spain, Japan, China, India, South Korea, Indonesia, Thailand, Brazil, Saudi Arabia, UAE, Australia, Argentina, Colombia, South Africa, Israel

  • Rapid expansion of aging demographics globally is the driving factor this market.

The Alzheimers Disease Therapeutics market vendors should focus on grabbing business opportunities from the Distribution channel segment as it accounted for the largest market share in the base year.
RIA - Research AI Assistant
Ask RIA
