Amphibious Landing Craft Market Analysis, Size, and Forecast 2026-2030: North America (US, Canada, and Mexico), Europe (Germany, UK, and France), APAC (China, Japan, and India), South America (Brazil and Argentina), Middle East and Africa (Saudi Arabia, UAE, and South Africa), and Rest of World (ROW)

Amphibious Landing Craft Market Analysis, Size, and Forecast 2026-2030:
North America (US, Canada, and Mexico), Europe (Germany, UK, and France), APAC (China, Japan, and India), South America (Brazil and Argentina), Middle East and Africa (Saudi Arabia, UAE, and South Africa), and Rest of World (ROW)

Published: Apr 2026 318 Pages SKU: IRTNTR46677

Market Overview at a Glance

$614.4 Mn
Market Opportunity
2.8%
CAGR 2025 - 2030
31.1%
North America Growth
$3.18 B
Military segment 2024

Amphibious Landing Craft Market Size 2026-2030

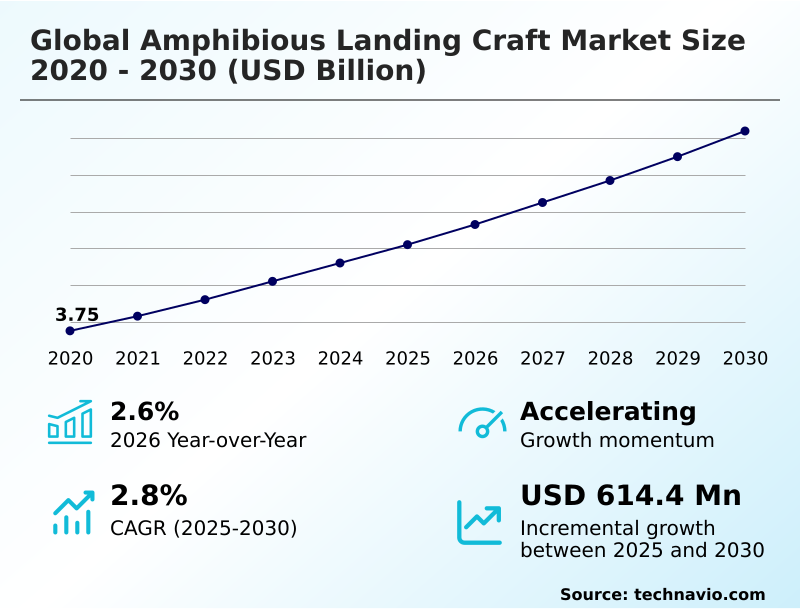
The amphibious landing craft market size is valued to increase by USD 614.4 million, at a CAGR of 2.8% from 2025 to 2030. Accelerating naval fleet modernization programs and aging asset replacement will drive the amphibious landing craft market.

Major Market Trends & Insights

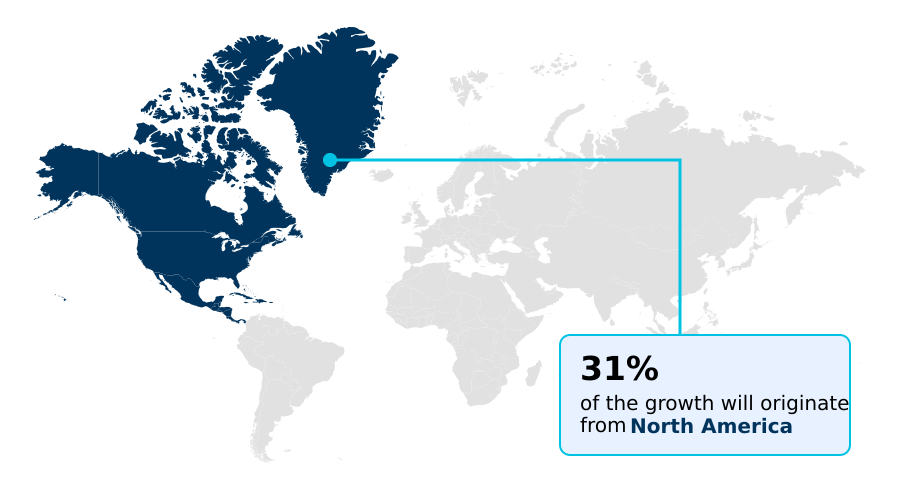
  • North America dominated the market and accounted for a 31.1% growth during the forecast period.
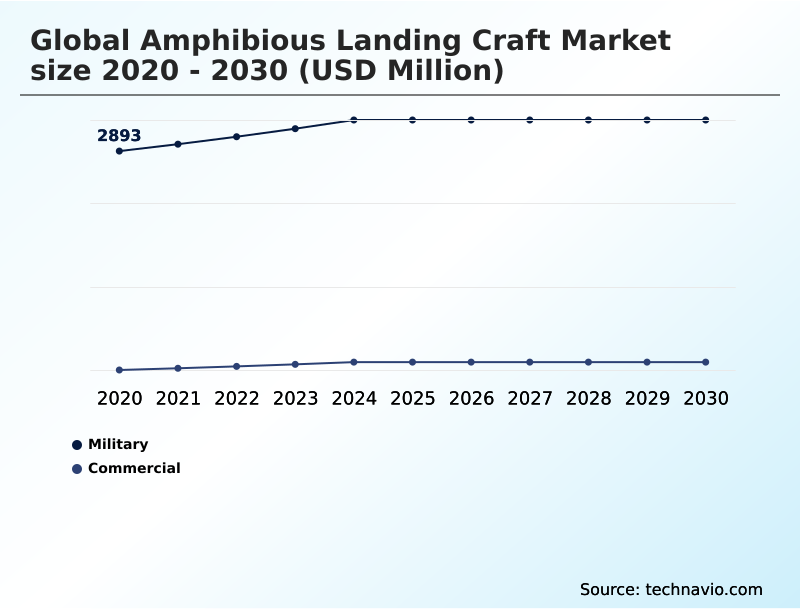
  • By Application - Military segment was valued at USD 3.18 billion in 2024
  • By Type - Amphibious ACVs and APCs segment accounted for the largest market revenue share in 2024

Market Size & Forecast

  • Market Opportunities: USD 1.08 billion
  • Market Future Opportunities: USD 614.4 million
  • CAGR from 2025 to 2030 : 2.8%

Market Summary

  • The amphibious landing craft market is defined by the strategic need to project force and sustain operations in coastal and riverine environments. Central to this is the evolution of platforms designed for expeditionary warfare, enabling the seamless transition of troops and equipment from sea to land.
  • Key drivers include widespread naval fleet modernization and geopolitical tensions, which demand more capable ship-to-shore connector assets. A significant trend involves the integration of autonomous navigation systems to reduce human risk during over-the-horizon assault missions. For instance, a naval task force can utilize unmanned surface vessels for initial reconnaissance and logistics, reducing exposure of crewed platforms by over 40%.
  • This shift toward technologically advanced, multi-role vessels capable of operating in contested littoral warfare scenarios, such as landing craft air cushion (LCAC) and landing craft utility (LCU) types, underscores the market's focus on speed, survivability, and operational flexibility to support distributed maritime operations and maintain a credible defense posture.

What will be the Size of the Amphibious Landing Craft Market during the forecast period?

Get Key Insights on Market Forecast (PDF) Get Free Sample

How is the Amphibious Landing Craft Market Segmented?

The amphibious landing craft industry research report provides comprehensive data (region-wise segment analysis), with forecasts and estimates in "USD million" for the period 2026-2030, as well as historical data from 2020-2024 for the following segments.

  • Application
    • Military
    • Commercial
  • Type
    • Amphibious ACVs and APCs
    • Air cushion vehicle
    • LCU and LCM
  • Usage
    • Amphibious operations
    • Naval operations
    • Maritime security
    • Others
  • End-user
    • Vehicle transportation
    • Infantry transportation
    • Others
  • Geography
    • North America
      • US
      • Canada
      • Mexico
    • Europe
      • Germany
      • UK
      • France
    • APAC
      • China
      • Japan
      • India
    • South America
      • Brazil
      • Argentina
    • Middle East and Africa
      • Saudi Arabia
      • UAE
      • South Africa
    • Rest of World (ROW)

By Application Insights

The military segment is estimated to witness significant growth during the forecast period.

The military segment is the primary force in the amphibious landing craft market, where mission-critical demands for force projection capabilities and maritime power projection drive procurement.

Modernization is focused on enhancing expeditionary warfare assets to support joint amphibious operations and maintain dominance in littoral combat operations. These platforms are essential for ship-to-shore logistics, enabling the deployment of naval infantry units and equipment.

Military applications steer over 75% of procurement decisions, focusing on vessels that ensure access and presence in contested environments.

The integration of advanced combat systems and robust designs for high-threat scenarios underscores the segment's strategic importance in national defense and expeditionary strike group readiness.

Get Free Sample

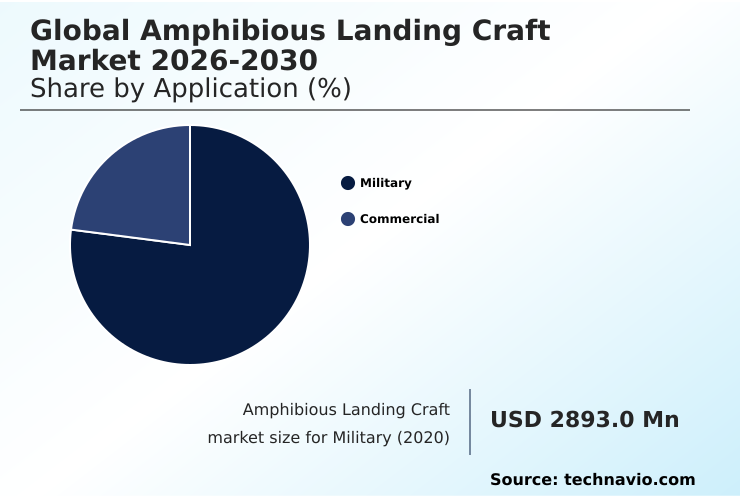
The Military segment was valued at USD 3.18 billion in 2024 and showed a gradual increase during the forecast period.

Get Free Sample

Regional Analysis

North America is estimated to contribute 31.1% to the growth of the global market during the forecast period.Technavio’s analysts have elaborately explained the regional trends and drivers that shape the market during the forecast period.

See How Amphibious Landing Craft Market Demand is Rising in North America Get Free Sample

The geographic landscape of the market is shaped by distinct regional priorities and strategic investments in sea-based logistics. North America leads, accounting for nearly 31% of incremental growth, driven by extensive modernization programs for its expeditionary advanced base operations.

The APAC region follows closely, representing over 23% of the opportunity, fueled by escalating geopolitical tensions that necessitate robust coastal defense strategies. Vessels in this region increasingly feature advanced C4ISR integration to manage complex maritime domains.

In Europe, the focus is on interoperability within allied amphibious task forces, while nations in the Middle East and Africa invest in platforms to secure sea lines of communication and support anti-piracy missions, highlighting a global demand for specialized, high-performance amphibious assets.

Market Dynamics

Our researchers analyzed the data with 2025 as the base year, along with the key drivers, trends, and challenges. A holistic analysis of drivers will help companies refine their marketing strategies to gain a competitive advantage.

  • The development of next-generation platforms is a complex process, with high speed landing craft design being a primary focus for planners. A key debate centers on LCU vs LCM operational differences, weighing heavy-lift capacity against speed and deployability.
  • Modern amphibious vehicle survivability features, such as advanced ballistic protection for landing craft and signature reduction technologies, are non-negotiable in the face of sophisticated anti access area denial countermeasures. The shift towards modular landing craft for HADR is gaining traction, allowing for rapid reconfiguration of non-combat missions.
  • Technologically, hybrid propulsion in landing craft is becoming a standard requirement to enhance range and stealth. Concurrently, the development of autonomous amphibious assault craft and unmanned surface vessel for logistics is accelerating, influenced heavily by strategic frameworks like the US marine corps force design.
  • This initiative re-evaluates everything from LCAC payload and range limitations to the integration of C4ISR systems for amphibious forces. The ultimate goal is to achieve superior high speed transit for expeditionary forces, overcoming sea state limitations for landing craft through innovations like hydrodynamic hull design for efficiency.
  • These platforms must support diverse mission sets, incorporating a modular payload for expeditionary missions and enabling effective beachhead insertion tactics and technology within the broader context of littoral combat ship mission modules and amphibious assault ship capabilities.

What are the key market drivers leading to the rise in the adoption of Amphibious Landing Craft Industry?

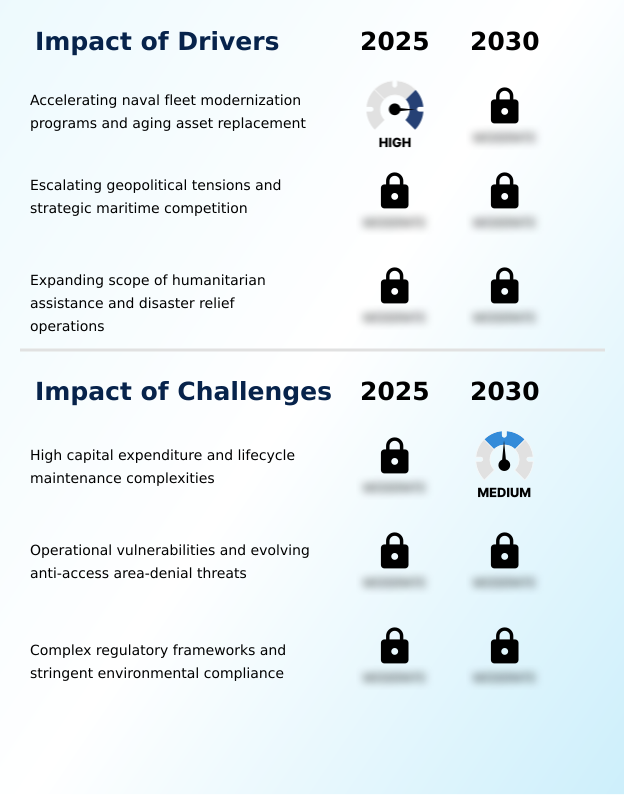
  • Accelerating naval fleet modernization programs and the replacement of aging assets are key drivers of the market.

  • The market is propelled by a convergence of strategic imperatives, including comprehensive naval fleet modernization efforts.
  • As aging assets reach the end of their service life, there is a sustained push for next-generation platforms that enhance maritime power projection and support an amphibious readiness group.
  • Escalating geopolitical tensions, particularly in contested maritime zones, are fueling demand for vessels that can ensure control over vital sea lines of communication, with regional defense spending increasing by an average of 8% in key hotspots.
  • Furthermore, the expanding scope of humanitarian assistance and disaster relief (HADR) operations has broadened the mission profile for these assets. Such missions now account for 15% of annual deployments in some fleets, underscoring the dual-use value of modern amphibious craft.

What are the market trends shaping the Amphibious Landing Craft Industry?

  • Technological advancements, including autonomous and remote-controlled navigation systems, are a significant emerging trend shaping the market.

  • Key trends are reshaping the market, with a strong emphasis on technological superiority and operational flexibility. The development of advanced autonomous navigation systems is critical, with pilot programs demonstrating a 30% reduction in crew workload during complex littoral maneuvers.
  • Another significant shift is the adoption of hybrid-electric propulsion, which enables silent running capabilities for stealthy beachhead insertion and can lower fuel consumption by up to 25%. The demand for modular vessel architectures is also rising, as modular payload bay designs allow for mission reconfiguration in less than 24 hours, compared to weeks for legacy platforms.
  • These innovations in roll-on/roll-off capability and unmanned surface vessel technology are setting new standards for expeditionary fast transport and over-the-beach logistics.

What challenges does the Amphibious Landing Craft Industry face during its growth?

  • High capital expenditure and complex lifecycle maintenance present a key challenge affecting industry growth.

  • The market faces significant challenges, primarily stemming from the high capital expenditure required for modern amphibious platforms. Lifecycle maintenance costs can exceed 60% of a vessel's total ownership cost, straining defense budgets.
  • Operationally, the proliferation of advanced anti-access/area-denial (A2/AD) threats creates a formidable challenge, with modern coastal defense systems capable of creating exclusion zones extending over 200 nautical miles, making ship-to-shore transit increasingly perilous. This A2/AD environment heightens the vulnerability of assets like the landing craft air cushion (LCAC).
  • Additionally, complex regulatory frameworks and stringent environmental compliance standards add layers of cost and time to development, demanding solutions like hybrid propulsion in landing craft and adherence to strict emissions protocols for expeditionary warfare platforms.

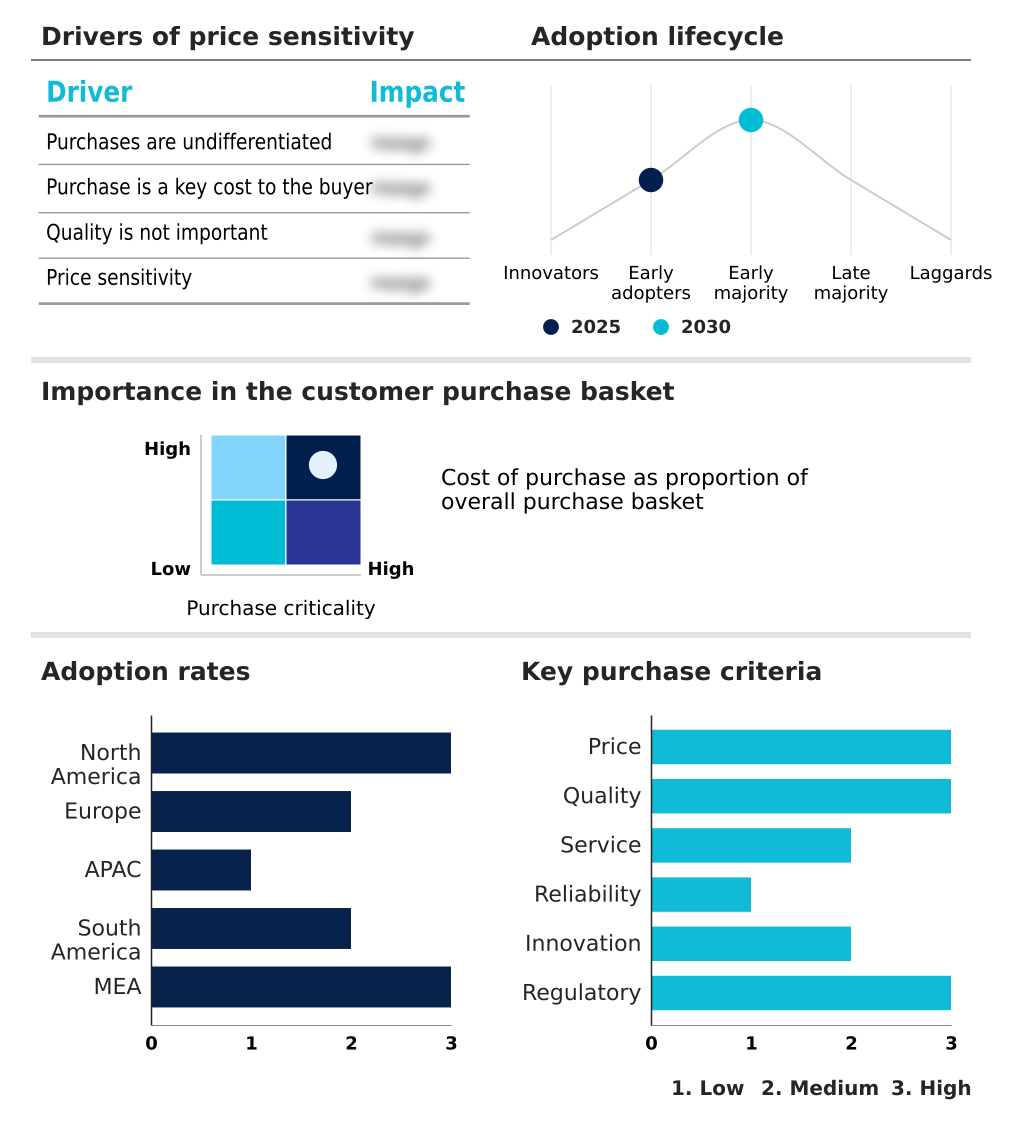
Exclusive Technavio Analysis on Customer Landscape

The amphibious landing craft market forecasting report includes the adoption lifecycle of the market, covering from the innovator’s stage to the laggard’s stage. It focuses on adoption rates in different regions based on penetration. Furthermore, the amphibious landing craft market report also includes key purchase criteria and drivers of price sensitivity to help companies evaluate and develop their market growth analysis strategies.

Customer Landscape of Amphibious Landing Craft Industry

Competitive Landscape

Companies are implementing various strategies, such as strategic alliances, amphibious landing craft market forecast, partnerships, mergers and acquisitions, geographical expansion, and product/service launches, to enhance their presence in the industry.

Abu Dhabi Ship Building PJSC - Key offerings include specialized Landing Craft Utility and Vehicle Personnel variants, delivering robust troop and vehicle transport solutions for modern naval operations.

The industry research and growth report includes detailed analyses of the competitive landscape of the market and information about key companies, including:

  • Abu Dhabi Ship Building PJSC
  • Almaz Shipbuilding Company
  • Austal Ltd.
  • BAE Systems Plc
  • CNIM SA
  • Damen Shipyards Group
  • Fincantieri Spa
  • General Dynamics NASSCO
  • Goa Shipyard Ltd.
  • Griffon Hoverwork Ltd.
  • Huntington Ingalls Industries
  • Iveco Defence Vehicles
  • Marine Alutech Oy Ab
  • Marine Inland Fabricators
  • Mitsubishi Heavy Industries
  • Naval Group
  • Navantia SA
  • ST Engineering Ltd.
  • Strategic Marine S Pte Ltd.
  • Textron Systems

Qualitative and quantitative analysis of companies has been conducted to help clients understand the wider business environment as well as the strengths and weaknesses of key industry players. Data is qualitatively analyzed to categorize companies as pure play, category-focused, industry-focused, and diversified; it is quantitatively analyzed to categorize companies as dominant, leading, strong, tentative, and weak.

Recent Development and News in Amphibious landing craft market

  • In September, 2024, Damen Shipyards Group announced a strategic partnership with a leading automation software firm to develop an advanced autonomous navigation module for its Landing Craft Utility (LCU) series, aiming to reduce crew risk in contested environments.
  • In February, 2025, BMT and Japan Marine United secured a contract from Japan's Acquisition, Technology, and Logistics Agency to design the Caimen, a next-generation high-speed landing craft tailored for complex island chain geographies.
  • In March, 2025, Textron Systems initiated testing for the next-generation Landing Craft Air Cushion (LCAC) 100 with the US Navy, a platform offering increased payload and improved reliability for over-the-horizon missions.
  • In May, 2025, BAE Systems Plc received a follow-on contract from the US Marine Corps for the full-rate production of additional Amphibious Combat Vehicle (ACV) variants, enhancing ship-to-shore mobility and troop protection.

Dive into Technavio’s robust research methodology, blending expert interviews, extensive data synthesis, and validated models for unparalleled Amphibious Landing Craft Market insights. See full methodology.

Market Scope
Page number 318
Base year 2025
Historic period 2020-2024
Forecast period 2026-2030
Growth momentum & CAGR Accelerate at a CAGR of 2.8%
Market growth 2026-2030 USD 614.4 million
Market structure Fragmented
YoY growth 2025-2026(%) 2.6%
Key countries US, Canada, Mexico, Germany, UK, France, Italy, Spain, The Netherlands, China, Japan, India, South Korea, Australia, Indonesia, Brazil, Argentina, Chile, Saudi Arabia, UAE, South Africa, Israel and Turkey
Competitive landscape Leading Companies, Market Positioning of Companies, Competitive Strategies, and Industry Risks

Request Free Sample

Research Analyst Overview

  • The amphibious landing craft market is undergoing a strategic realignment, shifting from monolithic platforms to a more distributed and technologically advanced fleet architecture. This evolution is driven by the need to conduct expeditionary warfare in highly contested A2/AD environments.
  • Key vendors are focused on developing next-generation assets, including the ship-to-shore connector and advanced amphibious combat vehicle (ACV) models, which emphasize speed, survivability, and C4ISR integration. A crucial trend is the incorporation of a modular payload bay, which allows for rapid mission reconfiguration.
  • For instance, platforms with this feature can reduce refit times by up to 30%, a critical factor influencing boardroom decisions on lifecycle costs and operational flexibility. The move towards high-speed transit and over-the-horizon assault capabilities is redefining vessel requirements, with an emphasis on advanced hydrodynamic hull designs and hybrid-electric propulsion.
  • This push for innovation ensures that naval forces can maintain effective littoral warfare capabilities, from beachhead insertion using landing craft air cushion (LCAC) technology to sustained logistics with landing craft utility (LCU) and landing craft mechanized (LCM) platforms. The market is also heavily influenced by the need for enhanced sea state tolerance and robust ballistic protection.

What are the Key Data Covered in this Amphibious Landing Craft Market Research and Growth Report?

  • What is the expected growth of the Amphibious Landing Craft Market between 2026 and 2030?

    • USD 614.4 million, at a CAGR of 2.8%

  • What segmentation does the market report cover?

    • The report is segmented by Application (Military, and Commercial), Type (Amphibious ACVs and APCs, Air cushion vehicle, and LCU and LCM), Usage (Amphibious operations, Naval operations, Maritime security, and Others), End-user (Vehicle transportation, Infantry transportation, and Others) and Geography (North America, Europe, APAC, South America, Middle East and Africa)

  • Which regions are analyzed in the report?

    • North America, Europe, APAC, South America and Middle East and Africa

  • What are the key growth drivers and market challenges?

    • Accelerating naval fleet modernization programs and aging asset replacement, High capital expenditure and lifecycle maintenance complexities

  • Who are the major players in the Amphibious Landing Craft Market?

    • Abu Dhabi Ship Building PJSC, Almaz Shipbuilding Company, Austal Ltd., BAE Systems Plc, CNIM SA, Damen Shipyards Group, Fincantieri Spa, General Dynamics NASSCO, Goa Shipyard Ltd., Griffon Hoverwork Ltd., Huntington Ingalls Industries, Iveco Defence Vehicles, Marine Alutech Oy Ab, Marine Inland Fabricators, Mitsubishi Heavy Industries, Naval Group, Navantia SA, ST Engineering Ltd., Strategic Marine S Pte Ltd. and Textron Systems

Market Research Insights

  • Market dynamics are increasingly influenced by the need for enhanced operational effectiveness in complex maritime security operations. The adoption of platforms with hybrid-electric propulsion is a key factor, with some systems demonstrating a 20% reduction in acoustic signatures, crucial for stealth in coastal surveillance.
  • Furthermore, the integration of autonomous navigation systems can improve mission success rates in contested environments by over 25% compared to manned-only operations, enabling safer ship-to-shore logistics.
  • This focus on technological superiority supports everything from anti-piracy missions to large-scale humanitarian assistance and disaster relief (HADR), reflecting a strategic shift toward versatile assets that bolster force projection capabilities while optimizing performance for rapid deployment forces.

We can help! Our analysts can customize this amphibious landing craft market research report to meet your requirements.

Get in touch

1. Executive Summary

1.1 Market overview

Executive Summary - Chart on Market Overview
Executive Summary - Data Table on Market Overview
Executive Summary - Chart on Global Market Characteristics
Executive Summary - Chart on Market by Geography
Executive Summary - Chart on Market Segmentation by Application
Executive Summary - Chart on Market Segmentation by Type
Executive Summary - Chart on Market Segmentation by Usage
Executive Summary - Chart on Market Segmentation by End-user
Executive Summary - Chart on Incremental Growth
Executive Summary - Data Table on Incremental Growth
Executive Summary - Chart on Company Market Positioning

2. Technavio Analysis

2.1 Analysis of price sensitivity, lifecycle, customer purchase basket, adoption rates, and purchase criteria

2.2 Criticality of inputs and Factors of differentiation

Chart on Overview on criticality of inputs and factors of differentiation

2.3 Factors of disruption

Chart on Overview on factors of disruption

2.4 Impact of drivers and challenges

Chart on Impact of drivers and challenges in 2025 and 2030

3. Market Landscape

3.1 Market ecosystem

Chart on Parent Market
Data Table on - Parent Market

3.2 Market characteristics

Chart on Market characteristics analysis

3.3 Value chain analysis

Chart on Value chain analysis

4. Market Sizing

4.1 Market definition

Data Table on Offerings of companies included in the market definition

4.2 Market segment analysis

Market segments

4.3 Market size 2025

4.4 Market outlook: Forecast for 2025-2030

Chart on Global - Market size and forecast 2025-2030 ($ million)
Data Table on Global - Market size and forecast 2025-2030 ($ million)
Chart on Global Market: Year-over-year growth 2025-2030 (%)
Data Table on Global Market: Year-over-year growth 2025-2030 (%)

5. Historic Market Size

5.1 Global Amphibious Landing Craft Market 2020 - 2024

Historic Market Size - Data Table on Global Amphibious Landing Craft Market 2020 - 2024 ($ million)

5.2 Application segment analysis 2020 - 2024

Historic Market Size - Application Segment 2020 - 2024 ($ million)

5.3 Type segment analysis 2020 - 2024

Historic Market Size - Type Segment 2020 - 2024 ($ million)

5.4 Usage segment analysis 2020 - 2024

Historic Market Size - Usage Segment 2020 - 2024 ($ million)

5.5 End-user segment analysis 2020 - 2024

Historic Market Size - End-user Segment 2020 - 2024 ($ million)

5.6 Geography segment analysis 2020 - 2024

Historic Market Size - Geography Segment 2020 - 2024 ($ million)

5.7 Country segment analysis 2020 - 2024

Historic Market Size - Country Segment 2020 - 2024 ($ million)

6. Qualitative Analysis

6.1 Impact of AI on global amphibious landing craft market

6.2 Impact of geopolitical conflicts on global amphibious landing craft market

7. Five Forces Analysis

7.1 Five forces summary

Five forces analysis - Comparison between 2025 and 2030

7.2 Bargaining power of buyers

Bargaining power of buyers - Impact of key factors 2025 and 2030

7.3 Bargaining power of suppliers

Bargaining power of suppliers - Impact of key factors in 2025 and 2030

7.4 Threat of new entrants

Threat of new entrants - Impact of key factors in 2025 and 2030

7.5 Threat of substitutes

Threat of substitutes - Impact of key factors in 2025 and 2030

7.6 Threat of rivalry

Threat of rivalry - Impact of key factors in 2025 and 2030

7.7 Market condition

Chart on Market condition - Five forces 2025 and 2030

8. Market Segmentation by Application

8.1 Market segments

Chart on Application - Market share 2025-2030 (%)
Data Table on Application - Market share 2025-2030 (%)

8.2 Comparison by Application

Chart on Comparison by Application
Data Table on Comparison by Application

8.3 Military - Market size and forecast 2025-2030

Chart on Military - Market size and forecast 2025-2030 ($ million)
Data Table on Military - Market size and forecast 2025-2030 ($ million)
Chart on Military - Year-over-year growth 2025-2030 (%)
Data Table on Military - Year-over-year growth 2025-2030 (%)

8.4 Commercial - Market size and forecast 2025-2030

Chart on Commercial - Market size and forecast 2025-2030 ($ million)
Data Table on Commercial - Market size and forecast 2025-2030 ($ million)
Chart on Commercial - Year-over-year growth 2025-2030 (%)
Data Table on Commercial - Year-over-year growth 2025-2030 (%)

8.5 Market opportunity by Application

Market opportunity by Application ($ million)
Data Table on Market opportunity by Application ($ million)

9. Market Segmentation by Type

9.1 Market segments

Chart on Type - Market share 2025-2030 (%)
Data Table on Type - Market share 2025-2030 (%)

9.2 Comparison by Type

Chart on Comparison by Type
Data Table on Comparison by Type

9.3 Amphibious ACVs and APCs - Market size and forecast 2025-2030

Chart on Amphibious ACVs and APCs - Market size and forecast 2025-2030 ($ million)
Data Table on Amphibious ACVs and APCs - Market size and forecast 2025-2030 ($ million)
Chart on Amphibious ACVs and APCs - Year-over-year growth 2025-2030 (%)
Data Table on Amphibious ACVs and APCs - Year-over-year growth 2025-2030 (%)

9.4 Air cushion vehicle - Market size and forecast 2025-2030

Chart on Air cushion vehicle - Market size and forecast 2025-2030 ($ million)
Data Table on Air cushion vehicle - Market size and forecast 2025-2030 ($ million)
Chart on Air cushion vehicle - Year-over-year growth 2025-2030 (%)
Data Table on Air cushion vehicle - Year-over-year growth 2025-2030 (%)

9.5 LCU and LCM - Market size and forecast 2025-2030

Chart on LCU and LCM - Market size and forecast 2025-2030 ($ million)
Data Table on LCU and LCM - Market size and forecast 2025-2030 ($ million)
Chart on LCU and LCM - Year-over-year growth 2025-2030 (%)
Data Table on LCU and LCM - Year-over-year growth 2025-2030 (%)

9.6 Market opportunity by Type

Market opportunity by Type ($ million)
Data Table on Market opportunity by Type ($ million)

10. Market Segmentation by Usage

10.1 Market segments

Chart on Usage - Market share 2025-2030 (%)
Data Table on Usage - Market share 2025-2030 (%)

10.2 Comparison by Usage

Chart on Comparison by Usage
Data Table on Comparison by Usage

10.3 Amphibious operations - Market size and forecast 2025-2030

Chart on Amphibious operations - Market size and forecast 2025-2030 ($ million)
Data Table on Amphibious operations - Market size and forecast 2025-2030 ($ million)
Chart on Amphibious operations - Year-over-year growth 2025-2030 (%)
Data Table on Amphibious operations - Year-over-year growth 2025-2030 (%)

10.4 Naval operations - Market size and forecast 2025-2030

Chart on Naval operations - Market size and forecast 2025-2030 ($ million)
Data Table on Naval operations - Market size and forecast 2025-2030 ($ million)
Chart on Naval operations - Year-over-year growth 2025-2030 (%)
Data Table on Naval operations - Year-over-year growth 2025-2030 (%)

10.5 Maritime security - Market size and forecast 2025-2030

Chart on Maritime security - Market size and forecast 2025-2030 ($ million)
Data Table on Maritime security - Market size and forecast 2025-2030 ($ million)
Chart on Maritime security - Year-over-year growth 2025-2030 (%)
Data Table on Maritime security - Year-over-year growth 2025-2030 (%)

10.6 Others - Market size and forecast 2025-2030

Chart on Others - Market size and forecast 2025-2030 ($ million)
Data Table on Others - Market size and forecast 2025-2030 ($ million)
Chart on Others - Year-over-year growth 2025-2030 (%)
Data Table on Others - Year-over-year growth 2025-2030 (%)

10.7 Market opportunity by Usage

Market opportunity by Usage ($ million)
Data Table on Market opportunity by Usage ($ million)

11. Market Segmentation by End-user

11.1 Market segments

Chart on End-user - Market share 2025-2030 (%)
Data Table on End-user - Market share 2025-2030 (%)

11.2 Comparison by End-user

Chart on Comparison by End-user
Data Table on Comparison by End-user

11.3 Vehicle transportation - Market size and forecast 2025-2030

Chart on Vehicle transportation - Market size and forecast 2025-2030 ($ million)
Data Table on Vehicle transportation - Market size and forecast 2025-2030 ($ million)
Chart on Vehicle transportation - Year-over-year growth 2025-2030 (%)
Data Table on Vehicle transportation - Year-over-year growth 2025-2030 (%)

11.4 Infantry transportation - Market size and forecast 2025-2030

Chart on Infantry transportation - Market size and forecast 2025-2030 ($ million)
Data Table on Infantry transportation - Market size and forecast 2025-2030 ($ million)
Chart on Infantry transportation - Year-over-year growth 2025-2030 (%)
Data Table on Infantry transportation - Year-over-year growth 2025-2030 (%)

11.5 Others - Market size and forecast 2025-2030

Chart on Others - Market size and forecast 2025-2030 ($ million)
Data Table on Others - Market size and forecast 2025-2030 ($ million)
Chart on Others - Year-over-year growth 2025-2030 (%)
Data Table on Others - Year-over-year growth 2025-2030 (%)

11.6 Market opportunity by End-user

Market opportunity by End-user ($ million)
Data Table on Market opportunity by End-user ($ million)

12. Customer Landscape

12.1 Customer landscape overview

Analysis of price sensitivity, lifecycle, customer purchase basket, adoption rates, and purchase criteria

13. Geographic Landscape

13.1 Geographic segmentation

Chart on Market share by geography 2025-2030 (%)
Data Table on Market share by geography 2025-2030 (%)

13.2 Geographic comparison

Chart on Geographic comparison
Data Table on Geographic comparison

13.3 North America - Market size and forecast 2025-2030

Chart on North America - Market size and forecast 2025-2030 ($ million)
Data Table on North America - Market size and forecast 2025-2030 ($ million)
Chart on North America - Year-over-year growth 2025-2030 (%)
Data Table on North America - Year-over-year growth 2025-2030 (%)
Chart on Regional Comparison - North America
Data Table on Regional Comparison - North America

13.3.1 US - Market size and forecast 2025-2030

Chart on US - Market size and forecast 2025-2030 ($ million)
Data Table on US - Market size and forecast 2025-2030 ($ million)
Chart on US - Year-over-year growth 2025-2030 (%)
Data Table on US - Year-over-year growth 2025-2030 (%)

13.3.2 Canada - Market size and forecast 2025-2030

Chart on Canada - Market size and forecast 2025-2030 ($ million)
Data Table on Canada - Market size and forecast 2025-2030 ($ million)
Chart on Canada - Year-over-year growth 2025-2030 (%)
Data Table on Canada - Year-over-year growth 2025-2030 (%)

13.3.3 Mexico - Market size and forecast 2025-2030

Chart on Mexico - Market size and forecast 2025-2030 ($ million)
Data Table on Mexico - Market size and forecast 2025-2030 ($ million)
Chart on Mexico - Year-over-year growth 2025-2030 (%)
Data Table on Mexico - Year-over-year growth 2025-2030 (%)

13.4 Europe - Market size and forecast 2025-2030

Chart on Europe - Market size and forecast 2025-2030 ($ million)
Data Table on Europe - Market size and forecast 2025-2030 ($ million)
Chart on Europe - Year-over-year growth 2025-2030 (%)
Data Table on Europe - Year-over-year growth 2025-2030 (%)
Chart on Regional Comparison - Europe
Data Table on Regional Comparison - Europe

13.4.1 Germany - Market size and forecast 2025-2030

Chart on Germany - Market size and forecast 2025-2030 ($ million)
Data Table on Germany - Market size and forecast 2025-2030 ($ million)
Chart on Germany - Year-over-year growth 2025-2030 (%)
Data Table on Germany - Year-over-year growth 2025-2030 (%)

13.4.2 UK - Market size and forecast 2025-2030

Chart on UK - Market size and forecast 2025-2030 ($ million)
Data Table on UK - Market size and forecast 2025-2030 ($ million)
Chart on UK - Year-over-year growth 2025-2030 (%)
Data Table on UK - Year-over-year growth 2025-2030 (%)

13.4.3 France - Market size and forecast 2025-2030

Chart on France - Market size and forecast 2025-2030 ($ million)
Data Table on France - Market size and forecast 2025-2030 ($ million)
Chart on France - Year-over-year growth 2025-2030 (%)
Data Table on France - Year-over-year growth 2025-2030 (%)

13.4.4 Italy - Market size and forecast 2025-2030

Chart on Italy - Market size and forecast 2025-2030 ($ million)
Data Table on Italy - Market size and forecast 2025-2030 ($ million)
Chart on Italy - Year-over-year growth 2025-2030 (%)
Data Table on Italy - Year-over-year growth 2025-2030 (%)

13.4.5 Spain - Market size and forecast 2025-2030

Chart on Spain - Market size and forecast 2025-2030 ($ million)
Data Table on Spain - Market size and forecast 2025-2030 ($ million)
Chart on Spain - Year-over-year growth 2025-2030 (%)
Data Table on Spain - Year-over-year growth 2025-2030 (%)

13.4.6 The Netherlands - Market size and forecast 2025-2030

Chart on The Netherlands - Market size and forecast 2025-2030 ($ million)
Data Table on The Netherlands - Market size and forecast 2025-2030 ($ million)
Chart on The Netherlands - Year-over-year growth 2025-2030 (%)
Data Table on The Netherlands - Year-over-year growth 2025-2030 (%)

13.5 APAC - Market size and forecast 2025-2030

Chart on APAC - Market size and forecast 2025-2030 ($ million)
Data Table on APAC - Market size and forecast 2025-2030 ($ million)
Chart on APAC - Year-over-year growth 2025-2030 (%)
Data Table on APAC - Year-over-year growth 2025-2030 (%)
Chart on Regional Comparison - APAC
Data Table on Regional Comparison - APAC

13.5.1 China - Market size and forecast 2025-2030

Chart on China - Market size and forecast 2025-2030 ($ million)
Data Table on China - Market size and forecast 2025-2030 ($ million)
Chart on China - Year-over-year growth 2025-2030 (%)
Data Table on China - Year-over-year growth 2025-2030 (%)

13.5.2 Japan - Market size and forecast 2025-2030

Chart on Japan - Market size and forecast 2025-2030 ($ million)
Data Table on Japan - Market size and forecast 2025-2030 ($ million)
Chart on Japan - Year-over-year growth 2025-2030 (%)
Data Table on Japan - Year-over-year growth 2025-2030 (%)

13.5.3 India - Market size and forecast 2025-2030

Chart on India - Market size and forecast 2025-2030 ($ million)
Data Table on India - Market size and forecast 2025-2030 ($ million)
Chart on India - Year-over-year growth 2025-2030 (%)
Data Table on India - Year-over-year growth 2025-2030 (%)

13.5.4 South Korea - Market size and forecast 2025-2030

Chart on South Korea - Market size and forecast 2025-2030 ($ million)
Data Table on South Korea - Market size and forecast 2025-2030 ($ million)
Chart on South Korea - Year-over-year growth 2025-2030 (%)
Data Table on South Korea - Year-over-year growth 2025-2030 (%)

13.5.5 Australia - Market size and forecast 2025-2030

Chart on Australia - Market size and forecast 2025-2030 ($ million)
Data Table on Australia - Market size and forecast 2025-2030 ($ million)
Chart on Australia - Year-over-year growth 2025-2030 (%)
Data Table on Australia - Year-over-year growth 2025-2030 (%)

13.5.6 Indonesia - Market size and forecast 2025-2030

Chart on Indonesia - Market size and forecast 2025-2030 ($ million)
Data Table on Indonesia - Market size and forecast 2025-2030 ($ million)
Chart on Indonesia - Year-over-year growth 2025-2030 (%)
Data Table on Indonesia - Year-over-year growth 2025-2030 (%)

13.6 South America - Market size and forecast 2025-2030

Chart on South America - Market size and forecast 2025-2030 ($ million)
Data Table on South America - Market size and forecast 2025-2030 ($ million)
Chart on South America - Year-over-year growth 2025-2030 (%)
Data Table on South America - Year-over-year growth 2025-2030 (%)
Chart on Regional Comparison - South America
Data Table on Regional Comparison - South America

13.6.1 Brazil - Market size and forecast 2025-2030

Chart on Brazil - Market size and forecast 2025-2030 ($ million)
Data Table on Brazil - Market size and forecast 2025-2030 ($ million)
Chart on Brazil - Year-over-year growth 2025-2030 (%)
Data Table on Brazil - Year-over-year growth 2025-2030 (%)

13.6.2 Argentina - Market size and forecast 2025-2030

Chart on Argentina - Market size and forecast 2025-2030 ($ million)
Data Table on Argentina - Market size and forecast 2025-2030 ($ million)
Chart on Argentina - Year-over-year growth 2025-2030 (%)
Data Table on Argentina - Year-over-year growth 2025-2030 (%)

13.6.3 Chile - Market size and forecast 2025-2030

Chart on Chile - Market size and forecast 2025-2030 ($ million)
Data Table on Chile - Market size and forecast 2025-2030 ($ million)
Chart on Chile - Year-over-year growth 2025-2030 (%)
Data Table on Chile - Year-over-year growth 2025-2030 (%)

13.7 Middle East and Africa - Market size and forecast 2025-2030

Chart on Middle East and Africa - Market size and forecast 2025-2030 ($ million)
Data Table on Middle East and Africa - Market size and forecast 2025-2030 ($ million)
Chart on Middle East and Africa - Year-over-year growth 2025-2030 (%)
Data Table on Middle East and Africa - Year-over-year growth 2025-2030 (%)
Chart on Regional Comparison - Middle East and Africa
Data Table on Regional Comparison - Middle East and Africa

13.7.1 Saudi Arabia - Market size and forecast 2025-2030

Chart on Saudi Arabia - Market size and forecast 2025-2030 ($ million)
Data Table on Saudi Arabia - Market size and forecast 2025-2030 ($ million)
Chart on Saudi Arabia - Year-over-year growth 2025-2030 (%)
Data Table on Saudi Arabia - Year-over-year growth 2025-2030 (%)

13.7.2 UAE - Market size and forecast 2025-2030

Chart on UAE - Market size and forecast 2025-2030 ($ million)
Data Table on UAE - Market size and forecast 2025-2030 ($ million)
Chart on UAE - Year-over-year growth 2025-2030 (%)
Data Table on UAE - Year-over-year growth 2025-2030 (%)

13.7.3 South Africa - Market size and forecast 2025-2030

Chart on South Africa - Market size and forecast 2025-2030 ($ million)
Data Table on South Africa - Market size and forecast 2025-2030 ($ million)
Chart on South Africa - Year-over-year growth 2025-2030 (%)
Data Table on South Africa - Year-over-year growth 2025-2030 (%)

13.7.4 Israel - Market size and forecast 2025-2030

Chart on Israel - Market size and forecast 2025-2030 ($ million)
Data Table on Israel - Market size and forecast 2025-2030 ($ million)
Chart on Israel - Year-over-year growth 2025-2030 (%)
Data Table on Israel - Year-over-year growth 2025-2030 (%)

13.7.5 Turkey - Market size and forecast 2025-2030

Chart on Turkey - Market size and forecast 2025-2030 ($ million)
Data Table on Turkey - Market size and forecast 2025-2030 ($ million)
Chart on Turkey - Year-over-year growth 2025-2030 (%)
Data Table on Turkey - Year-over-year growth 2025-2030 (%)

13.8 Market opportunity by geography

Market opportunity by geography ($ million)
Data Tables on Market opportunity by geography ($ million)

14. Drivers, Challenges, and Opportunity

14.1 Market drivers

Accelerating naval fleet modernization programs and aging asset replacement
Escalating geopolitical tensions and strategic maritime competition
Expanding scope of humanitarian assistance and disaster relief operations

14.2 Market challenges

High capital expenditure and lifecycle maintenance complexities
Operational vulnerabilities and evolving anti-access area-denial threats
Complex regulatory frameworks and stringent environmental compliance

14.3 Impact of drivers and challenges

Impact of drivers and challenges in 2025 and 2030

14.4 Market opportunities

Technological advancements in autonomous and remote-controlled navigation systems
Integration of hybrid propulsion and enhanced fuel efficiency solutions
Rising demand for multi-mission and modular vessel architectures

15. Competitive Landscape

15.1 Overview

15.2

Overview on criticality of inputs and factors of differentiation

15.3 Landscape disruption

Overview on factors of disruption

15.4 Industry risks

Impact of key risks on business

16. Competitive Analysis

16.1 Companies profiled

Companies covered

16.2 Company ranking index

16.3 Market positioning of companies

Matrix on companies position and classification

16.4 Abu Dhabi Ship Building PJSC

Abu Dhabi Ship Building PJSC - Overview
Abu Dhabi Ship Building PJSC - Product / Service
Abu Dhabi Ship Building PJSC - Key offerings
SWOT

16.5 Almaz Shipbuilding Company

Almaz Shipbuilding Company - Overview
Almaz Shipbuilding Company - Product / Service
Almaz Shipbuilding Company - Key offerings
SWOT

16.6 Austal Ltd.

Austal Ltd. - Overview
Austal Ltd. - Business segments
Austal Ltd. - Key offerings
Austal Ltd. - Segment focus
SWOT

16.7 BAE Systems Plc

BAE Systems Plc - Overview
BAE Systems Plc - Business segments
BAE Systems Plc - Key offerings
BAE Systems Plc - Segment focus
SWOT

16.8 CNIM SA

CNIM SA - Overview
CNIM SA - Product / Service
CNIM SA - Key offerings
SWOT

16.9 Damen Shipyards Group

Damen Shipyards Group - Overview
Damen Shipyards Group - Product / Service
Damen Shipyards Group - Key offerings
SWOT

16.10 Fincantieri Spa

Fincantieri Spa - Overview
Fincantieri Spa - Business segments
Fincantieri Spa - Key offerings
Fincantieri Spa - Segment focus
SWOT

16.11 Goa Shipyard Ltd.

Goa Shipyard Ltd. - Overview
Goa Shipyard Ltd. - Business segments
Goa Shipyard Ltd. - Key offerings
Goa Shipyard Ltd. - Segment focus
SWOT

16.12 Griffon Hoverwork Ltd.

Griffon Hoverwork Ltd. - Overview
Griffon Hoverwork Ltd. - Product / Service
Griffon Hoverwork Ltd. - Key offerings
SWOT

16.13 Huntington Ingalls Industries

Huntington Ingalls Industries - Overview
Huntington Ingalls Industries - Business segments
Huntington Ingalls Industries - Key offerings
Huntington Ingalls Industries - Segment focus
SWOT

16.14 Iveco Defence Vehicles

Iveco Defence Vehicles - Overview
Iveco Defence Vehicles - Product / Service
Iveco Defence Vehicles - Key offerings
SWOT

16.15 Marine Alutech Oy Ab

Marine Alutech Oy Ab - Overview
Marine Alutech Oy Ab - Product / Service
Marine Alutech Oy Ab - Key offerings
SWOT

16.16 Mitsubishi Heavy Industries

Mitsubishi Heavy Industries - Overview
Mitsubishi Heavy Industries - Business segments
Mitsubishi Heavy Industries - Key offerings
Mitsubishi Heavy Industries - Segment focus
SWOT

16.17 Strategic Marine S Pte Ltd.

Strategic Marine S Pte Ltd. - Overview
Strategic Marine S Pte Ltd. - Product / Service
Strategic Marine S Pte Ltd. - Key offerings
SWOT

16.18 Textron Systems

Textron Systems - Overview
Textron Systems - Product / Service
Textron Systems - Key offerings
SWOT

17. Appendix

17.1 Scope of the report

Market definition
Objectives
Notes and caveats

17.2 Inclusions and exclusions checklist

Inclusions checklist
Exclusions checklist

17.3 Currency conversion rates for US$

17.4 Research methodology

17.5 Data procurement

Information sources

17.6 Data validation

17.7 Validation techniques employed for market sizing

17.8 Data synthesis

17.9 360 degree market analysis

17.10 List of abbreviations

Research Methodology

Technavio presents a detailed picture of the market by way of study, synthesis, and summation of data from multiple sources. The analysts have presented the various facets of the market with a particular focus on identifying the key industry influencers. The data thus presented is comprehensive, reliable, and the result of extensive research, both primary and secondary.

INFORMATION SOURCES

Primary sources

  • Manufacturers and suppliers
  • Channel partners
  • Industry experts
  • Strategic decision makers

Secondary sources

  • Industry journals and periodicals
  • Government data
  • Financial reports of key industry players
  • Historical data
  • Press releases

DATA ANALYSIS

Data Synthesis

  • Collation of data
  • Estimation of key figures
  • Analysis of derived insights

Data Validation

  • Triangulation with data models
  • Reference against proprietary databases
  • Corroboration with industry experts

REPORT WRITING

Qualitative

  • Market drivers
  • Market challenges
  • Market trends
  • Five forces analysis

Quantitative

  • Market size and forecast
  • Market segmentation
  • Geographical insights
  • Competitive landscape

Interested in this report?

Get your sample now to see our research methodology and insights!

Download Now

Frequently Asked Questions

Amphibious Landing Craft market growth will increase by USD 614.4 million during 2026-2030.

The Amphibious Landing Craft market is expected to grow at a CAGR of 2.8% during 2026-2030.

Amphibious Landing Craft market is segmented by Application (Military, Commercial) Type (Amphibious ACVs and APCs, Air cushion vehicle, LCU and LCM) Usage (Amphibious operations, Naval operations, Maritime security, Others) End-user (Vehicle transportation, Infantry transportation, Others)

Abu Dhabi Ship Building PJSC, Almaz Shipbuilding Company, Austal Ltd., BAE Systems Plc, CNIM SA, Damen Shipyards Group, Fincantieri Spa, General Dynamics NASSCO, Goa Shipyard Ltd., Griffon Hoverwork Ltd., Huntington Ingalls Industries, Iveco Defence Vehicles, Marine Alutech Oy Ab, Marine Inland Fabricators, Mitsubishi Heavy Industries, Naval Group, Navantia SA, ST Engineering Ltd., Strategic Marine S Pte Ltd., Textron Systems are a few of the key vendors in the Amphibious Landing Craft market.

North America will register the highest growth rate of 31.1% among the other regions. Therefore, the Amphibious Landing Craft market in North America is expected to garner significant business opportunities for the vendors during the forecast period.

US, Canada, Mexico, Germany, UK, France, Italy, Spain, The Netherlands, China, Japan, India, South Korea, Australia, Indonesia, Brazil, Argentina, Chile, Saudi Arabia, UAE, South Africa, Israel, Turkey

  • Accelerating naval fleet modernization programs and aging asset replacement is the driving factor this market.

The Amphibious Landing Craft market vendors should focus on grabbing business opportunities from the Application segment as it accounted for the largest market share in the base year.
RIA - Research AI Assistant
Ask RIA