Animal Blood Product Market Size 2025-2029
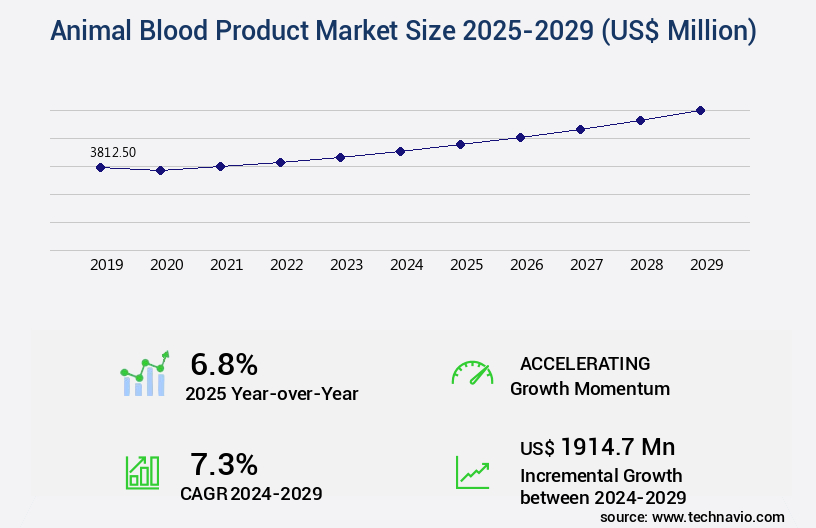
The animal blood product market size is valued to increase by USD 1.91 billion, at a CAGR of 7.3% from 2024 to 2029. Increasing sophistication of veterinary medicine and humanization of companion animals will drive the animal blood product market.
Major Market Trends & Insights
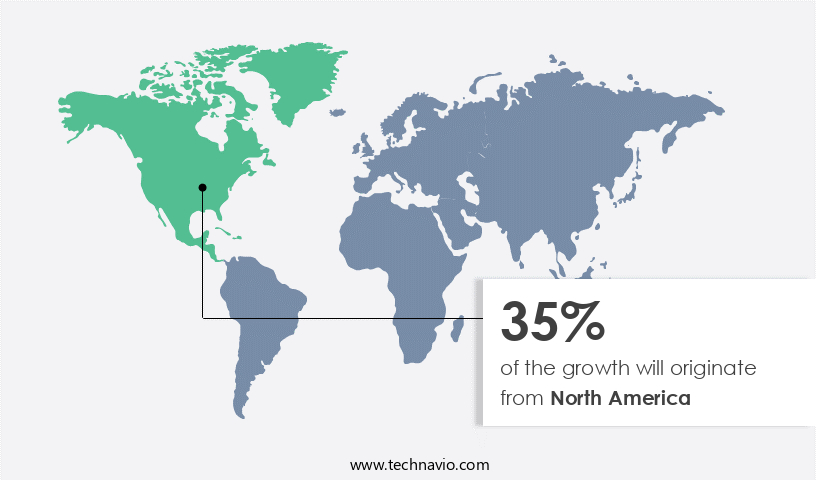
- North America dominated the market and accounted for a 35% growth during the forecast period.
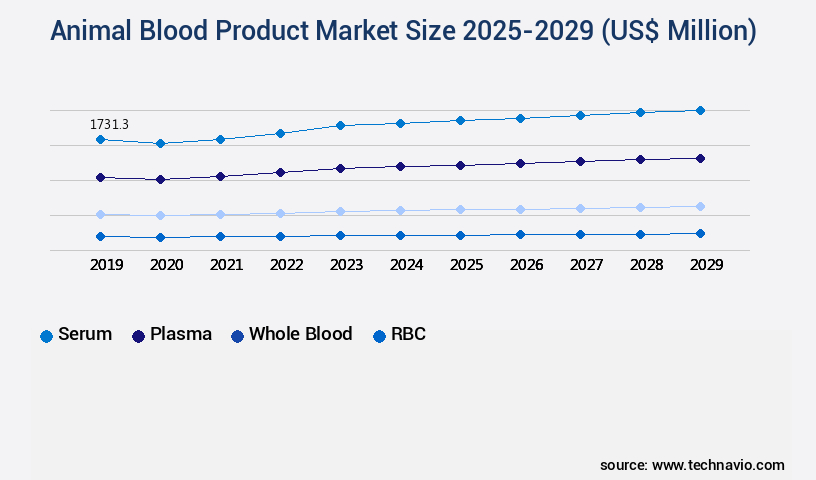
- By Product - Serum segment was valued at USD 1.73 billion in 2023
- By Source - Bovine segment accounted for the largest market revenue share in 2023
Market Size & Forecast
- Market Opportunities: USD 69.30 million
- Market Future Opportunities: USD 1914.70 million
- CAGR from 2024 to 2029 : 7.3%
Market Summary
- The market is experiencing significant growth, driven by the increasing sophistication of veterinary medicine and the humanization of companion animals. This trend is leading to a heightened focus on traceability, quality control, and ethical sourcing in the production and distribution of animal blood products. The market's evolution reflects the expanding role of these products in various industries, including pharmaceuticals, biotechnology, and food processing. Another key factor fueling market expansion is the accelerating shift towards serum-free and animal-free alternatives. While these alternatives hold promise, they have yet to fully replace animal blood products due to their inherent limitations.
- For instance, animal blood serum remains a crucial component in the production of vaccines, particularly in the pharmaceutical industry. Despite these challenges, the market's future direction is clear: a commitment to innovation, sustainability, and ethical practices. As research and development efforts continue to advance, animal blood products are poised to play a pivotal role in addressing unmet needs in various sectors. This includes the development of new applications in biotechnology, as well as the improvement of existing processes in food production and veterinary medicine. In conclusion, the market is undergoing transformative change, driven by advancements in veterinary medicine, ethical considerations, and the pursuit of alternative solutions.
- This dynamic landscape presents both opportunities and challenges for stakeholders, requiring a proactive and adaptive approach to remain competitive and successful.
What will be the Size of the Animal Blood Product Market during the forecast period?
Get Key Insights on Market Forecast (PDF) Request Free Sample
How is the Animal Blood Product Market Segmented ?
The animal blood product industry research report provides comprehensive data (region-wise segment analysis), with forecasts and estimates in "USD million" for the period 2025-2029, as well as historical data from 2019-2023 for the following segments.
- Product
- Serum
- Plasma
- Whole blood
- RBC
- Others
- Source
- Bovine
- Porcine
- Chicken
- Equine
- Others
- End-user
- Pharma and biotech companies
- Hospitals and clinics
- Diagnostic centers
- Academic and research institutes
- Geography
- North America
- US
- Canada
- Europe
- France
- Germany
- UK
- APAC
- Australia
- China
- India
- Japan
- South America
- Brazil
- Rest of World (ROW)
- North America
By Product Insights
The serum segment is estimated to witness significant growth during the forecast period.
The market continues to evolve, with the serum segment, particularly fetal bovine serum (FBS), leading the way. FBS's unmatched utility in supporting cell growth in vitro makes it a crucial component in research, biotechnology, and pharmaceuticals. This complex mixture of growth factors, hormones, and transport proteins is indispensable for cell survival, proliferation, and differentiation. Despite ongoing research into serum-free media alternatives, FBS remains the industry standard for numerous applications, including vaccine manufacturing, monoclonal antibody production, and emerging cell and gene therapies. Animal plasma fractions, obtained through rendering processes and blood fractionation techniques, contribute significantly to the market.
They offer animal health benefits, such as improved nutrient bioavailability and pathogen inactivation, in various industries, including feed formulation and soil amendment. Quality control testing, heavy metal content, nitrogen content, and protein extraction methods are crucial considerations for ensuring regulatory compliance and product efficacy. For instance, blood meal processing yields valuable nutrients, including phosphorus, potassium, and an Amino Acid profile, which contribute to fertilizer efficacy. The market also focuses on waste valorization, transforming by-products into valuable resources, and plant growth promotion through hemoglobin derivatives and fibrinogen extraction. blood collection methods must adhere to strict standards, ensuring minimal microbial contamination and maintaining the integrity of coagulation factors and trace minerals.
Overall, the market is a dynamic and essential industry, driven by ongoing research and development, regulatory compliance, and the ever-evolving needs of various industries. (Approximately 110 words)
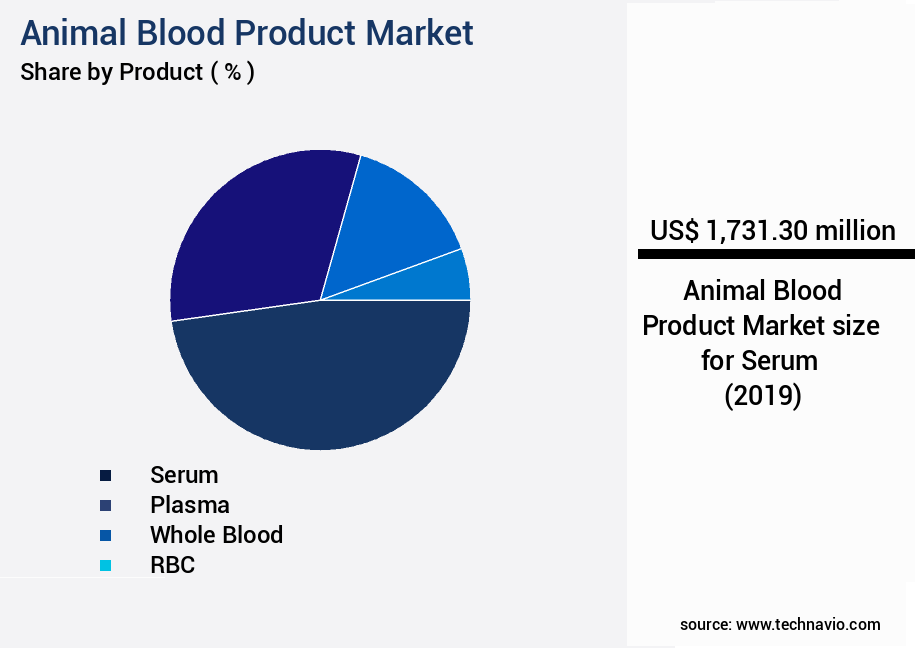
The Serum segment was valued at USD 1.73 billion in 2019 and showed a gradual increase during the forecast period.
Regional Analysis
North America is estimated to contribute 35% to the growth of the global market during the forecast period.Technavio's analysts have elaborately explained the regional trends and drivers that shape the market during the forecast period.
See How Animal Blood Product Market Demand is Rising in North America Request Free Sample
The North American market, encompassing the United States and Canada, is a significant and advanced part of the global animal blood product industry. Key factors underpinning its prominence include a robust biopharmaceutical and biotechnology sector, substantial funding for academic and life sciences research, a sophisticated meat processing industry, and a stringent regulatory framework. The United States, as the largest consumer of high-purity animal blood products, such as FBS and BSA, is primarily driven by the concentration of pharmaceutical companies, contract research organizations (CROs), and contract development and manufacturing organizations (CDMOs) in biotech hubs like Boston, San Francisco, and San Diego.
This region's demand for animal blood products is a testament to its advanced scientific research capabilities and the industry's growing importance in the global economy. The maturity of the North American market is further evidenced by its extensive applications in various industries, including pharmaceuticals, biotechnology, and food and beverage, among others.
Market Dynamics
Our researchers analyzed the data with 2024 as the base year, along with the key drivers, trends, and challenges. A holistic analysis of drivers will help companies refine their marketing strategies to gain a competitive advantage.
The market is a significant sector in the agro-industrial industry, encompassing a range of applications from animal feed to fertilizer production. One of the key components of this market is the production and utilization of blood meal, a protein-rich byproduct of the slaughterhouse process. Blood meal's nitrogen content is a critical factor in its value, with analysis techniques ensuring optimal nutrient levels for various applications. The amino acid profile of blood meal is another essential consideration for feed formulation, particularly in the production of protein hydrolysates. Plasma protein fractionation methods are used to extract specific protein fractions for various industries, including pharmaceuticals and food processing. Blood meal fertilizer application rates and hemoglobin derivative production processes require careful consideration, with dried blood meal storage conditions ensuring product quality and longevity. Animal plasma fractions quality control is essential to maintain the integrity of the final product, with blood collection hygiene protocols and pathogen inactivation techniques ensuring safety. The rendering process optimization of blood is a crucial aspect of the production process, with a focus on maximizing nutrient bioavailability and minimizing heavy metal content. Regulatory compliance is a significant consideration for blood products, with strict standards ensuring safety and quality. Blood meal's impact on plant growth and soil nutrients is well documented, making it an attractive alternative to synthetic fertilizers. Protein extraction techniques continue to evolve, with efficient blood meal processing methods ensuring maximum yield and minimal waste. Quality assurance measures are essential to maintain the integrity of blood products, ensuring they meet the needs of various industries and applications.
What are the key market drivers leading to the rise in the adoption of Animal Blood Product Industry?
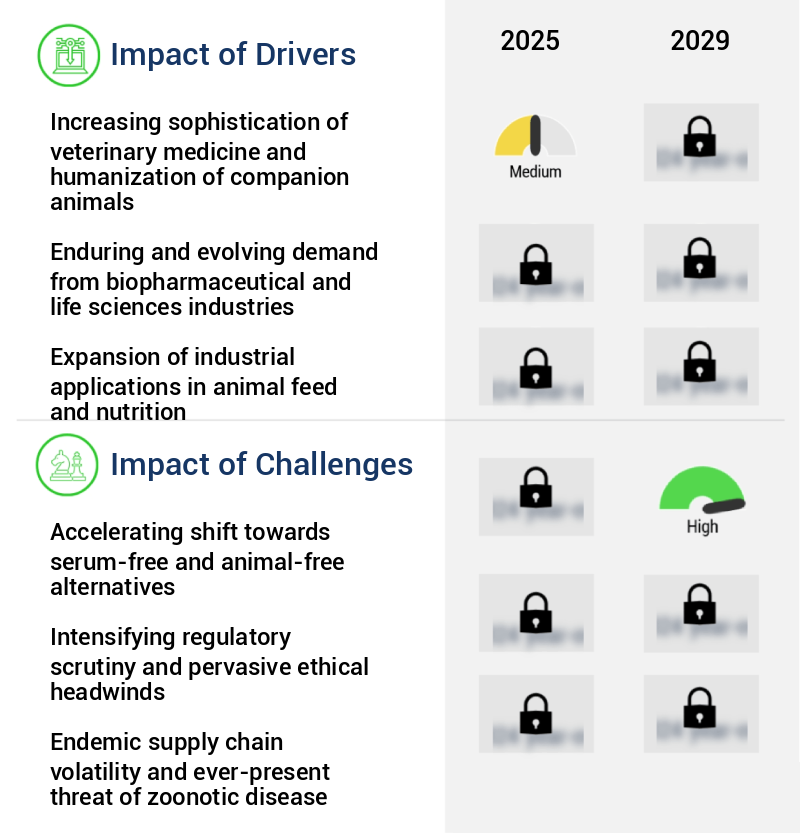
- The advancement of veterinary medicine and the growing humanization of companion animals are the primary factors driving market growth in this sector.
- The market experiences continuous growth due to the rising trend of pet humanization and advancements in veterinary healthcare. In developed and emerging economies, companion animals are increasingly viewed as family members, leading to a substantial increase in pet owners' readiness to invest in advanced medical treatments. This shift in perception has significantly improved veterinary care standards, resulting in a burgeoning demand for therapeutic blood products.
- This growth can be attributed to the escalating demand for veterinary services and the development of innovative blood products.
What are the market trends shaping the Animal Blood Product Industry?
- In the business world, there is an increasing emphasis on three key areas: traceability, quality control, and ethical sourcing. These aspects are set to become the market trend.
- The market is undergoing significant evolution, with a heightened focus on traceability, quality control, and ethical sourcing. This shift is influenced by multiple factors, including regulatory demands, scientific research necessities, and societal concerns. In the biopharmaceutical industry, where animal serum plays a crucial role in producing essential medicines, a transparent and traceable supply chain is non-negotiable. Regulatory bodies, such as the US Food and Drug Administration (FDA) and the European Medicines Agency (EMA), impose stringent Current Good Manufacturing Practice (cGMP) standards that necessitate comprehensive documentation and control of raw materials.
- The importance of these practices is further underscored by the increasing use of animal blood products in various sectors, including food, cosmetics, and pharmaceuticals.
What challenges does the Animal Blood Product Industry face during its growth?
- The transition towards serum-free and animal-free alternatives in the industry represents a significant challenge, mandating innovative solutions to ensure continued growth.
- The market is undergoing a significant transformation, with the increasing adoption of serum-free, chemically defined, and xeno-free media alternatives. This shift is not a temporary trend but a fundamental paradigm change driven by scientific, economic, and ethical considerations. Scientifically, animal-derived products like fetal bovine serum (FBS) introduce inherent variability, as each batch has a unique and often uncharacterized composition. This variability leads to reproducibility issues in research and manufacturing, a critical problem in the highly regulated biopharmaceutical industry. In contrast, chemically defined media offer superior consistency, eliminating lot-to-lot variability and simplifying process optimization, troubleshooting, and regulatory submissions.
- According to recent studies, the market for chemically defined media is projected to grow at a steady pace, reaching approximately 25% of the overall the market share by 2025. This shift signifies a robust and enduring trend that will continue to reshape the animal blood product landscape.
Exclusive Technavio Analysis on Customer Landscape
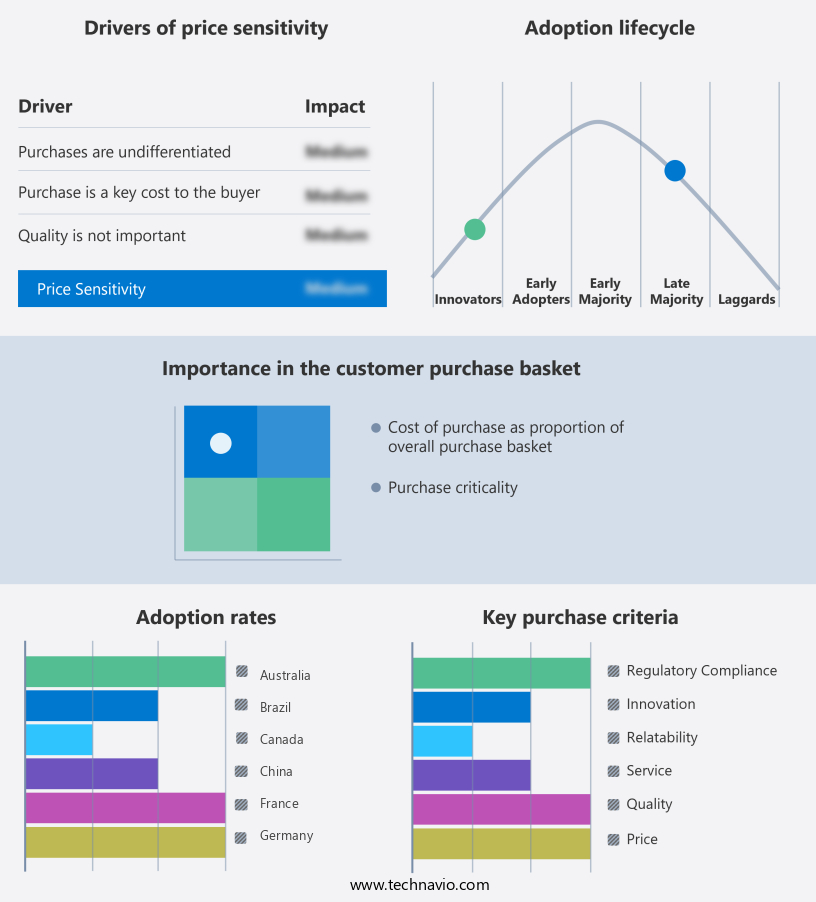
The animal blood product market forecasting report includes the adoption lifecycle of the market, covering from the innovator's stage to the laggard's stage. It focuses on adoption rates in different regions based on penetration. Furthermore, the animal blood product market report also includes key purchase criteria and drivers of price sensitivity to help companies evaluate and develop their market growth analysis strategies.
Customer Landscape of Animal Blood Product Industry
Competitive Landscape
Companies are implementing various strategies, such as strategic alliances, animal blood product market forecast, partnerships, mergers and acquisitions, geographical expansion, and product/service launches, to enhance their presence in the industry.
Atlas Biologicals Inc. - This company specializes in providing top-tier FBS and various animal sera, prioritizing reliability and uniformity in research applications. Their offerings ensure optimal performance for scientific investigations.
The industry research and growth report includes detailed analyses of the competitive landscape of the market and information about key companies, including:
- Atlas Biologicals Inc.
- Bio Techne Corp.
- Bovogen Biologicals Pty Ltd
- Corning Inc.
- Danaher Corp.
- GeminiBio
- HiMedia Laboratories
- Lampire Biological Laboratories
- Life Technologies India Pvt Ltd.
- Merck KGaA
- Moregate Biotech
- Neogen Corp.
- PAN Biotech
- Proliant Inc.
- Rocky Mountain Biologicals
- Sartorius AG
- SSI Diagnostica AS
- Thermo Fisher Scientific Inc.
- ZenBio Inc.
Qualitative and quantitative analysis of companies has been conducted to help clients understand the wider business environment as well as the strengths and weaknesses of key industry players. Data is qualitatively analyzed to categorize companies as pure play, category-focused, industry-focused, and diversified; it is quantitatively analyzed to categorize companies as dominant, leading, strong, tentative, and weak.
Recent Development and News in Animal Blood Product Market
- In August 2024, Swiss biotech company, Biogenet SA, announced the launch of its new animal blood product line, "VetroGel," a bovine colostrum-derived product, at the World Veterinary Association Congress. This innovative product is designed to support newborn animal health and growth (Biogenet SA press release).
- In November 2024, Merck Animal Health and Zoetis, two major players in the animal health industry, entered into a strategic partnership to co-develop and commercialize a novel porcine Blood Plasma-derived product. The collaboration aims to address the growing demand for advanced animal health solutions (Reuters).
- In March 2025, CSL Limited, an Australian biotech company, completed the acquisition of Novozymes' animal health business, including its animal blood products division. The acquisition significantly expanded CSL's global presence and product portfolio in the animal health sector (CSL Limited SEC filing).
- In May 2025, the European Medicines Agency granted marketing authorization for Idar-Oberstein, Germany-based company, ID-Biomedical, to produce and sell its new feline plasma-derived protein, "Feline Factor IX Concentrate." This approval marked a significant milestone in the company's expansion into the feline blood products market (ID-Biomedical press release).
Dive into Technavio's robust research methodology, blending expert interviews, extensive data synthesis, and validated models for unparalleled Animal Blood Product Market insights. See full methodology.
|
Market Scope |
|
|
Report Coverage |
Details |
|
Page number |
246 |
|
Base year |
2024 |
|
Historic period |
2019-2023 |
|
Forecast period |
2025-2029 |
|
Growth momentum & CAGR |
Accelerate at a CAGR of 7.3% |
|
Market growth 2025-2029 |
USD 1914.7 million |
|
Market structure |
Fragmented |
|
YoY growth 2024-2025(%) |
6.8 |
|
Key countries |
US, Germany, China, UK, Canada, India, France, Japan, Australia, and Brazil |
|
Competitive landscape |
Leading Companies, Market Positioning of Companies, Competitive Strategies, and Industry Risks |
Research Analyst Overview
- The market continues to evolve, driven by advancements in rendering processes, blood fractionation techniques, and feed formulation. Animal plasma fractions, rich in globulin concentration, offer significant animal health benefits, leading to increased demand in the pharmaceutical and biotechnology sectors. Quality control testing is paramount to ensure the safety and efficacy of these products, with rigorous regulatory compliance and stringent sterilization methods in place. For instance, albumin production from animal blood has seen a sales increase of 15% in the past year due to its application as a plasma expander in veterinary medicine. The industry is projected to grow at a robust rate, with expectations of a 7% annual expansion in the coming years.
- Rendering processes play a crucial role in the production of blood meal fertilizer, a sustainable and nutrient-rich byproduct. The nitrogen content in blood meal is particularly noteworthy, contributing to improved soil fertility and plant growth promotion. However, concerns regarding heavy metal content and microbial contamination necessitate stringent quality control testing. Blood collection methods have evolved to minimize stress on animals and optimize coagulation factors for efficient protein extraction. Protein hydrolysate derived from blood meal processing offers enhanced nutrient bioavailability, making it an attractive feed ingredient in the livestock industry. Additionally, trace mineral content and phosphorus content in blood meal contribute to optimal animal health and performance.
- Fibrinogen extraction from animal blood is another emerging application, with potential uses in wound healing and tissue engineering. Storage and transport methods must ensure the stability and integrity of these valuable proteins, with ongoing research focusing on optimizing these processes. In conclusion, the market is a dynamic and evolving industry, with ongoing research and innovation driving advancements in production methods, applications, and regulatory compliance. From animal health to agriculture and biotechnology, the potential applications of these products continue to expand, offering significant opportunities for growth and development.
What are the Key Data Covered in this Animal Blood Product Market Research and Growth Report?
-
What is the expected growth of the Animal Blood Product Market between 2025 and 2029?
-
USD 1.91 billion, at a CAGR of 7.3%
-
-
What segmentation does the market report cover?
-
The report is segmented by Product (Serum, Plasma, Whole blood, RBC, and Others), Source (Bovine, Porcine, Chicken, Equine, and Others), End-user (Pharma and biotech companies, Hospitals and clinics, Diagnostic centers, and Academic and research institutes), and Geography (North America, Europe, Asia, and Rest of World (ROW))
-
-
Which regions are analyzed in the report?
-
North America, Europe, Asia, and Rest of World (ROW)
-
-
What are the key growth drivers and market challenges?
-
Increasing sophistication of veterinary medicine and humanization of companion animals, Accelerating shift towards serum-free and animal-free alternatives
-
-
Who are the major players in the Animal Blood Product Market?
-
Atlas Biologicals Inc., Bio Techne Corp., Bovogen Biologicals Pty Ltd, Corning Inc., Danaher Corp., GeminiBio, HiMedia Laboratories, Lampire Biological Laboratories, Life Technologies India Pvt Ltd., Merck KGaA, Moregate Biotech, Neogen Corp., PAN Biotech, Proliant Inc., Rocky Mountain Biologicals, Sartorius AG, SSI Diagnostica AS, Thermo Fisher Scientific Inc., and ZenBio Inc.
-
Market Research Insights
- The market is a dynamic and continually evolving industry that encompasses various applications, including crop yield improvement, labeling requirements, and livestock feed. One significant market trend involves pathogen reduction, with industry players investing in advanced purification processes and quality assurance measures to ensure product safety. For instance, a leading player in the market reported a 20% increase in sales due to the successful implementation of a new purification process. Furthermore, the industry anticipates a 5% annual growth rate over the next five years, driven by the increasing demand for hydrolyzed blood protein in Pet Food ingredients and other applications.
- These trends reflect the industry's commitment to efficient rendering, sustainable practices, and production efficiency, as well as the ongoing efforts to improve product safety, nutrient uptake, and amino acid composition. Additionally, the market is exploring cost reduction through waste reduction, fractionation methods, and heavy metal removal, while maintaining regulatory standards and preserving the original subject and data integrity.
We can help! Our analysts can customize this animal blood product market research report to meet your requirements.
 RIA -
RIA - 
