
Annuloplasty Rings Market Size 2025-2029
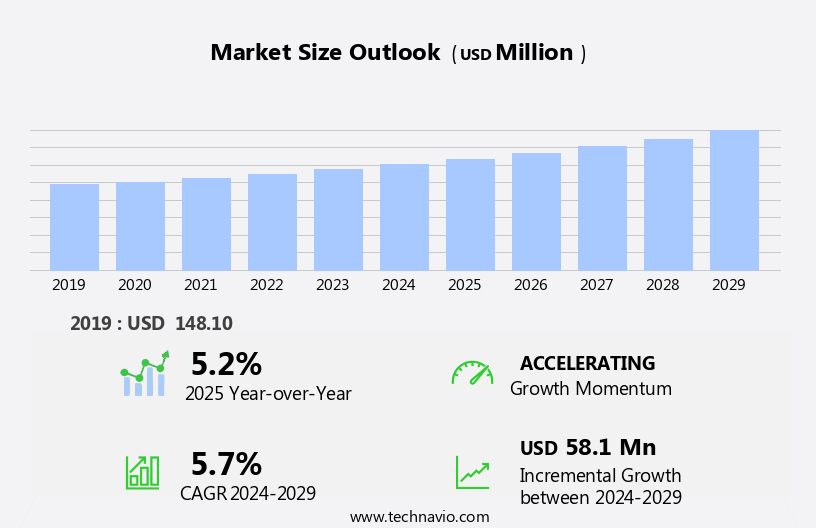
The annuloplasty rings market size is forecast to increase by USD 58.1 million at a CAGR of 5.7% between 2024 and 2029.
- The market is experiencing significant growth, driven by the increasing prevalence of heart valve diseases and the growing preference towards annuloplasty for aortic valve repair. Annuloplasty rings offer a minimally invasive approach to heart valve repair, making them an attractive alternative to traditional surgical methods. However, the high cost of annuloplasty rings remains a significant challenge, limiting their widespread adoption, particularly in developing countries. Furthermore, regulatory hurdles and supply chain inconsistencies can temper growth potential, requiring companies to navigate these complexities effectively to capitalize on market opportunities. The growing preference for minimally invasive procedures in interventional cardiology and radiology is further fueling market growth.
- To succeed in this dynamic market, companies must focus on innovation, cost reduction, and regulatory compliance, while also building strong partnerships and collaborations to address supply chain challenges. By staying agile and responsive to market trends and customer needs, companies can differentiate themselves and capture a larger share of the growing market. The use of transcatheter pulmonary valves, which include annuloplasty rings and valves delivered via catheters, is increasing as they offer less invasive alternatives to surgical procedures.
What will be the Size of the Annuloplasty Rings Market during the forecast period?
- The annuloplasty rings market, a segment of the larger medical device and valve surgery markets, experiences continuous evolution due to advancements in technology and growing demand for valve repair procedures. Annuloplasty ring placement is a crucial aspect of valve surgery, with the size and durability of the rings significantly impacting patient outcomes. Innovations in annuloplasty ring materials aim to enhance durability and reduce complications, such as infection and structural failure. Valve leaflet repair techniques, in conjunction with annuloplasty rings, contribute to improved patient outcomes and expanded treatment options. The future of annuloplasty rings lies in further innovation and addressing reimbursement challenges, ensuring affordability and accessibility for patients undergoing cardiac surgery. Analytics indicate that the market is expected to continue its upward trajectory, driven by technological advancements and increasing demand for minimally invasive heart valve replacement options.
- The valve repair market, a key consumer of annuloplasty rings, is expected to grow, driven by an aging population and increasing prevalence of valve diseases. Annuloplasty ring guidelines and cost remain essential considerations for healthcare providers and insurers, shaping market dynamics and patient access.
How is this Annuloplasty Rings Industry segmented?
The annuloplasty rings industry research report provides comprehensive data (region-wise segment analysis), with forecasts and estimates in "USD million" for the period 2025-2029, as well as historical data from 2019-2023 for the following segments.
- Application
- Mitral valve repair
- Tricuspid valve repair
- Aortic valve repair
- End-user
- Hospitals
- Ambulatory surgical centers
- Specialty clinics
- Service
- Saddle-shaped rings
- Semi-rigid rings
- Flat-shaped rings
- Geography
- North America
- US
- Canada
- Mexico
- Europe
- France
- Germany
- Italy
- UK
- APAC
- China
- India
- Japan
- Rest of World (ROW)
- North America
By Application Insights
The mitral valve repair segment is estimated to witness significant growth during the forecast period.
Mitral valve repair is the preferred treatment for mitral valve regurgitation (MR) due to its ability to preserve native valve function and offer long-term outcomes without the need for anticoagulation. Modern mitral valve reconstruction techniques, including prosthetic ring annuloplasty, have been shown to improve left ventricular function and increase long-term survival in MR patients. Prosthetic ring annuloplasty is the gold standard procedure for mitral valve repair, used in nearly all cases as an isolated procedure or in conjunction with leaflet or sub-valvular apparatus repair. Medical innovation continues to drive advancements in mitral valve repair techniques. Sutureless valve repair and transcatheter valve repair are emerging minimally invasive options.
Image-guided surgery and robotic surgery offer increased precision and reduced recovery time. Artificial intelligence and machine learning are being integrated into heart valve surgery to enhance procedural planning and improve surgical outcomes. Evidence-based medicine plays a crucial role in the development and implementation of these innovative surgical techniques. Clinical trials and clinical research are essential in evaluating the safety, efficacy, and long-term durability of these approaches. Biodegradable and bioabsorbable materials are being explored for valve ring and device design, offering potential benefits in terms of patient satisfaction and reduced reoperation rates. Cardiovascular disease remains a significant health concern, with heart failure and valve dysfunction being common complications.
Patient education and medical education are essential in raising awareness of the importance of timely diagnosis and treatment of these conditions. 3D printing technology is being used to develop customized prosthetic valves and valve repair devices, further advancing the field of heart valve surgery. In the realm of aortic valve repair, sutureless techniques and transcatheter approaches are gaining popularity. Minimally invasive surgical procedures and percutaneous valve repair are also being increasingly utilized to improve patient outcomes and reduce recovery time. Material science and device design continue to be key areas of focus in the development of new and improved heart valve repair solutions.
Heart failure, valve regurgitation, and valve prolapse are common valve diseases that can significantly impact a patient's quality of life and life expectancy. Effective treatment and management of these conditions are essential in maintaining optimal cardiac health and improving patient outcomes. The ongoing advancements in heart valve repair techniques and technologies offer promising solutions for addressing these challenges. The market is experiencing growth as advancements in medical technologies improve treatment options for patients with congenital heart defects.
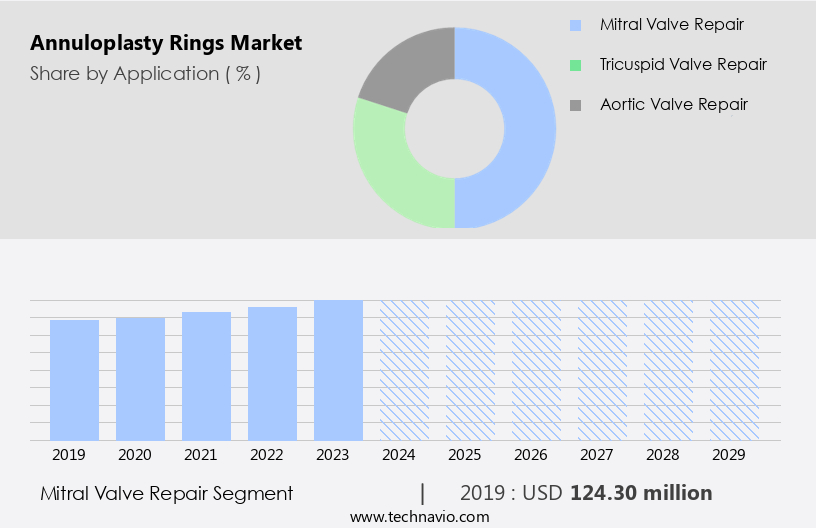
The Mitral valve repair segment was valued at USD 124.30 million in 2019 and showed a gradual increase during the forecast period.
Regional Analysis
North America is estimated to contribute 45% to the growth of the global market during the forecast period. Technavio's analysts have elaborately explained the regional trends and drivers that shape the market during the forecast period.

The market in the US and Canada is witnessing significant growth due to the increasing prevalence of heart valve diseases and the adoption of advanced annuloplasty rings. The region's major revenue contributors are improved healthcare infrastructure and the presence of established companies. These companies are launching novel annuloplasty rings to address enlarged annuli and reduce the risk of systolic anterior motion. The aging population is a significant factor driving market growth, as they are more likely to develop heart valve diseases and undergo repair procedures. Medical innovation, such as sutureless valve repair and image-guided surgery, is revolutionizing heart valve repair.
Sutureless valve repair allows for faster recovery times, while image-guided surgery ensures precise placement of annuloplasty rings. Transcatheter valve repair and minimally invasive surgery are also gaining popularity due to their minimal invasiveness and reduced risk of complications. Evidence-based medicine and patient education are crucial in the selection and implementation of annuloplasty rings. Long-term durability is a critical factor in patient satisfaction, leading to the exploration of bioabsorbable materials and biodegradable materials for device design. Machine learning and artificial intelligence are being integrated into heart valve surgery to improve surgical outcomes and reduce reoperation rates.
The market is witnessing the integration of 3D printing technology and robotic surgery in the production and implementation of annuloplasty rings. Clinical trials and clinical research are ongoing to ensure the safety and efficacy of these advanced technologies. The use of prosthetic valves, mechanical valves, and bioprosthetic valves in heart valve repair is also a focus of ongoing research. Cardiovascular disease, valve dysfunction, valve regurgitation, and valve prolapse are common conditions treated with annuloplasty rings. Stainless steel and other materials, such as titanium and carbon fiber, are used in the production of annuloplasty rings due to their durability and biocompatibility.
The market's future growth is expected to be driven by the ongoing development of medical devices and the increasing focus on patient-centered care.
Market Dynamics
Our researchers analyzed the data with 2024 as the base year, along with the key drivers, trends, and challenges. A holistic analysis of drivers will help companies refine their marketing strategies to gain a competitive advantage.
What are the Annuloplasty Rings market drivers leading to the rise in the adoption of Industry?
- The rising prevalence of heart valve diseases serves as the primary market driver. The global prevalence of heart valve diseases is on the rise, with mitral regurgitation (MR) being the most common valvular abnormality, affecting around 2% of the population. MR can stem from various causes, including cardiac ischemia (functional MR), rheumatic diseases, and infective endocarditis. According to the National Center for Biotechnology Information (NCBI), approximately 7.2 million people die annually from coronary artery disease (CAD) worldwide. Moreover, rheumatic heart disease, a commonly acquired heart disease among individuals under 25, is projected to increase from approximately 36 million to 44 million between 2011 and 2025. Simultaneously, the prevalence of endocarditis is anticipated to rise from approximately 568,000 to 695,000 during the same period.
- Transcatheter valve repair through minimally invasive surgery has emerged as a promising alternative to traditional surgical procedures for addressing heart valve diseases. Percutaneous valve repair, specifically, offers several advantages, including improved surgical outcomes and reduced recovery time. The development of advanced materials, such as bioabsorbable materials, and innovative device designs are crucial in enhancing the long-term durability and effectiveness of these procedures. The intersection of medical education, material science, and device design plays a pivotal role in driving the growth of the transcatheter valve repair market.
What are the Annuloplasty Rings market trends shaping the Industry?
- The preference for annuloplasty in aortic valve repair is increasingly common in the market. This trend signifies a shift towards more advanced and effective valve repair techniques. Annuloplasty rings play a crucial role in aortic valve repair procedures, offering several advantages over valve replacement surgeries. These rings help reduce the dilated aortic annulus, safeguarding the repair and enhancing the coaptation surface. Aortic valve repair is increasingly preferred due to its benefits, including lower operative mortality, decreased risk of valve-related complications, improved long-term ventricular function, and extended life expectancy. Patient satisfaction is a significant consideration in heart valve surgery. Annuloplasty rings contribute to a more rapid recovery process, with shorter recovery times compared to valve replacement procedures. Moreover, the use of advanced technologies like 3D printing in the manufacturing of annuloplasty rings ensures a precise fit, further enhancing the effectiveness of the procedure.
- Mitral valve repair, which often includes annuloplasty, is a well-established and effective treatment for heart failure caused by valve regurgitation or valve prolapse. By addressing the underlying structural issues, annuloplasty rings contribute to a more and long-term solution for patients. Effective patient education is essential in the success of any heart valve surgery. Understanding the benefits and implications of annuloplasty rings can help patients make informed decisions about their treatment options. With ongoing research and advancements in the field, the future of heart valve repair using annuloplasty rings looks promising.
How does Annuloplasty Rings market faces challenges during its growth?
- The exorbitant costs associated with annuloplasty rings pose a significant challenge to the growth of the industry. Annuloplasty rings are essential medical devices used in cardiac surgery for the treatment of valve disease. Reoperation rates due to valve deterioration remain high, necessitating the need for these rings. However, their high cost is a significant barrier to their widespread adoption, especially in developing countries. The cost of annuloplasty rings can range from USD 1,000 to USD 2,000, with an average price of USD 1,755. Mitral valve repair procedures in the US typically cost around USD 30,000, and the price can increase significantly depending on factors such as the type of ring used, the extent of surgery, special tests, insurance coverage, medications, and postoperative complications requiring additional surgery.
- Clinicians also face challenges with reimbursement for annuloplasty rings in many countries. Clinical trials and research in healthcare technology are ongoing to explore alternatives, including biodegradable materials. Robotic surgery is another area of focus, as it may offer advantages in terms of precision and reduced invasiveness. Despite these challenges, annuloplasty rings remain a critical tool in cardiac surgery for the repair and replacement of damaged heart valves.
Exclusive Customer Landscape
The annuloplasty rings market forecasting report includes the adoption lifecycle of the market, covering from the innovator's stage to the laggard's stage. It focuses on adoption rates in different regions based on penetration. Furthermore, the annuloplasty rings market report also includes key purchase criteria and drivers of price sensitivity to help companies evaluate and develop their market growth analysis strategies.

Customer Landscape
Key Companies & Market Insights
Companies are implementing various strategies, such as strategic alliances, annuloplasty rings market forecast, partnerships, mergers and acquisitions, geographical expansion, and product/service launches, to enhance their presence in the industry.
Abbott Laboratories - The company provides advanced annuloplasty rings, including the Abbott Attune Ring, engineered for adaptability to various procedural requirements.
The industry research and growth report includes detailed analyses of the competitive landscape of the market and information about key companies, including:
- Abbott Laboratories
- AFFLUENT MEDICAL SA
- BioStable Science and Engineering Inc.
- Bon Secours Health System Inc.
- Boston Scientific Corp.
- Braile Biomedica
- Coroneo
- Edwards Lifesciences Corp.
- FOC Medical SA
- Genesee BioMedical Inc.
- Labcor Laboratorios Ltda.
- LivaNova PLC
- Medtentia International Ltd. Oy
- Medtronic Plc
- Micro Interventional Devices Inc.
- Valcare Medical
Qualitative and quantitative analysis of companies has been conducted to help clients understand the wider business environment as well as the strengths and weaknesses of key industry players. Data is qualitatively analyzed to categorize companies as pure play, category-focused, industry-focused, and diversified; it is quantitatively analyzed to categorize companies as dominant, leading, strong, tentative, and weak.
Recent Development and News in Annuloplasty Rings Market
- In February 2024, Medtronic plc, a leading medical technology company, announced the U.S. Food and Drug Administration (FDA) approval of its Harmony Annuloplasty Ring System for mitral and tricuspid valve repair. This innovative solution, which utilizes a unified annuloplasty ring design, aims to simplify the surgical procedure and improve patient outcomes (Medtronic Press Release, 2024).
- In March 2025, Edwards Lifesciences Corporation, a prominent player in the global cardiology market, entered into a strategic collaboration with the University of California, San Francisco (UCSF) to develop advanced annuloplasty rings. This partnership, which combines UCSF's expertise in valve research with Edwards' manufacturing capabilities, is expected to yield next-generation annuloplasty rings that cater to a broader range of patient needs (Edwards Lifesciences Press Release, 2025).
- In June 2024, Abbott Laboratories completed the acquisition of St. Jude Medical, a major competitor in the cardiovascular devices market, for approximately USD 25 billion. This deal significantly expanded Abbott's portfolio in the cardiovascular sector, including the acquisition of St. Jude Medical's annuloplasty rings business, which is expected to bolster Abbott's market position and enhance its offerings to customers (Abbott Laboratories Press Release, 2024).
Research Analyst Overview
The market continues to evolve, driven by advancements in medical innovation and the ongoing quest to improve surgical techniques for addressing valve disease. Valve dysfunction, including regurgitation and prolapse, can significantly impact the quality of life for patients with cardiovascular disease. Traditional suture-based repair methods have given way to sutureless techniques, offering potential benefits in terms of surgical outcomes and recovery time. Artificial intelligence and image-guided surgery are increasingly being integrated into valve repair procedures, enhancing precision and accuracy. Transcatheter and percutaneous valve repair methods, including minimally invasive surgery, are gaining popularity due to their reduced invasiveness and potential for improved patient satisfaction.
Biodegradable materials are emerging as a promising option for annuloplasty rings, offering the potential for long-term durability without the need for reoperation. Medical devices companies are investing in clinical trials to evaluate the safety and efficacy of these new materials. Device design and material science continue to advance, with a focus on improving patient outcomes and reducing reoperation rates. Mechanical and bioprosthetic valves are being optimized for improved performance and durability. Clinical research and healthcare technology are playing a crucial role in advancing the field of heart valve surgery. Patient education and satisfaction are increasingly prioritized, with a focus on minimizing recovery time and improving life expectancy. Robotic surgery and machine learning are also being explored as potential tools for enhancing the market, offering the potential for increased precision and efficiency. Ongoing clinical trials and research will continue to shape the market dynamics and unfold new patterns in the market.
The Annuloplasty Rings Market is evolving with advancements in annuloplasty ring size customization and enhanced annuloplasty ring durability for improved patient outcomes. Addressing concerns around annuloplasty ring complications, researchers focus on refining designs to optimize annuloplasty ring outcomes and ensure long-term success. Factors such as annuloplasty ring cost and annuloplasty ring reimbursement influence adoption rates within the expanding valve surgery market and broader cardiac surgery market. Continuous annuloplasty ring innovation is driving technological breakthroughs, shaping the annuloplasty ring future with minimally invasive solutions. As part of the dynamic medical device market, these rings remain a critical component in valve repair procedures, supporting better cardiovascular health globally.
Dive into Technavio's strong research methodology, blending expert interviews, extensive data synthesis, and validated models for unparalleled Annuloplasty Rings Market insights. See full methodology.
|
Market Scope |
|
|
Report Coverage |
Details |
|
Page number |
224 |
|
Base year |
2024 |
|
Historic period |
2019-2023 |
|
Forecast period |
2025-2029 |
|
Growth momentum & CAGR |
Accelerate at a CAGR of 5.7% |
|
Market growth 2025-2029 |
USD 58.1 million |
|
Market structure |
Concentrated |
|
YoY growth 2024-2025(%) |
5.2 |
|
Key countries |
US, Canada, Germany, UK, China, Mexico, France, Japan, Italy, and India |
|
Competitive landscape |
Leading Companies, Market Positioning of Companies, Competitive Strategies, and Industry Risks |
What are the Key Data Covered in this Annuloplasty Rings Market Research and Growth Report?
- CAGR of the Annuloplasty Rings industry during the forecast period
- Detailed information on factors that will drive the growth and forecasting between 2025 and 2029
- Precise estimation of the size of the market and its contribution of the industry in focus to the parent market
- Accurate predictions about upcoming growth and trends and changes in consumer behaviour
- Growth of the market across North America, Europe, Asia, and Rest of World (ROW)
- Thorough analysis of the market's competitive landscape and detailed information about companies
- Comprehensive analysis of factors that will challenge the annuloplasty rings market growth of industry companies
We can help! Our analysts can customize this annuloplasty rings market research report to meet your requirements.
 RIA -
RIA - 
